
Abstract
Background
Extremely preterm neonates undergo significant serum sodium (Na) changes in the first few days after birth. The objectives of this study were to describe the epidemiology of early onset hyponatremia, examine the investigations and interventions chosen, and assess the association of early onset hyponatremia with sodium and fluid intake in extremely preterm neonates.
Methods
Retrospective study of 100 extremely preterm neonates admitted between 2018 and 2019; data was collected 1-14 days post-birth. Early onset hyponatremia was defined as: hyponatremia within first 14 days, with mild (serum Na 130-134), moderate (Na 126-129), and severe (Na ≤125 mmol/L).
Results
Early onset hyponatremia prevalence was 85%. Amongst mild hyponatremia, 23% progressed to moderate, 21% to severe hyponatremia. Repeat Na was ordered in 84%, Na intake increased in 57%, fluid intake reduced in 7% in the 24-h following hyponatremia. Higher cumulative weight gain and fluid intake >171 ml/kg/day had higher moderate/severe hyponatremia after 7 days. Na intake higher than 5 mmol/L (OR = 1.03) and increased fluid intake (OR = 1.00) did not reduce hyponatremia risk.
Conclusions
Early onset hyponatremia is common in extremely preterm neonates. Early recognition of mild hyponatremia is critical in preventing progression to moderate-severe hyponatremia. Fluid management in the early days of life of extremely preterm neonates should prioritize weight loss and Na balance while providing adequate nutrition.
Introduction
Serum sodium (Na) is one of the most common investigations in the neonatal intensive care unit (NICU).1,2 Neonates admitted to the NICU frequently experience wide variations in their Na levels, especially in the early days of their life. Several factors including fluid intake, insensible water losses, hemodynamic instability, acute kidney injury (AKI), endocrine disturbances, and medications can significantly impact Na levels in extremely preterm neonates (EPN). 3 Conditions including Syndrome of Inappropriate Antidiuretic Hormone Secretion (SIADH), congestive cardiac failure, and hypoalbuminemia may lead to water retention; on the other hand, insensible water loss, gastrointestinal (GI) losses, and diuretic use may lead to free water deficit and hypernatremia. 2 Hyponatremia can result in rapid changes in intracellular volume and osmolality in many organs, especially the brain, where such abrupt changes can result in cellular dysfunction and irreversible cell damage. 3 Early Onset Hyponatremia (EOH) has been commonly reported in EPN and associated with short term and long-term neurodevelopmental concerns.1,4 However, detailed analysis in this population is lacking, and there are no clear guidelines on how to investigate or treat EOH in EPN.
The primary objective of this study was to describe the epidemiology of EOH in EPN. Our secondary objectives were (1) to examine the investigations and interventions chosen for EOH and (2) to assess the association of EOH with sodium and fluid intake.
Methods
Data source and study population
The data for this study was collected retrospectively from electronic and non-electronic medical records of neonates admitted to British Columbia Women’s Hospital (BCWH) NICU. This is the main tertiary care/level 4 NICU in British Columbia with approximately 900 admissions per year. Data was collected for neonates born between January 1st, 2018, and December 31st, 2019. This study was approved by the University of British Columbia/Children’s and Women’s Health Centre of British Columbia Research Ethics Board (REB number: H21-01441).
Patient enrollment was done by non-probability sampling technique; all EPN who met the inclusion criteria of being admitted to BCWH NICU in the first 2 weeks after birth were enlisted, and the enrollment stopped after the sample size of 100 was reached (Figure 1). We excluded those EPN who spent >1 week of the first 2 weeks of life in another hospital. Data from the day the baby was born (Day 1) to Day 14 were collected, including: laboratory measured Na values (mmol/L), excluding point of care testing; total fluid intake (TFI) (ml/kg/day); total Na intake including all parenteral and enteral forms (mmol/kg/day); and daily weight (kg) including birth weight. Study flow describing enrollment for data collection.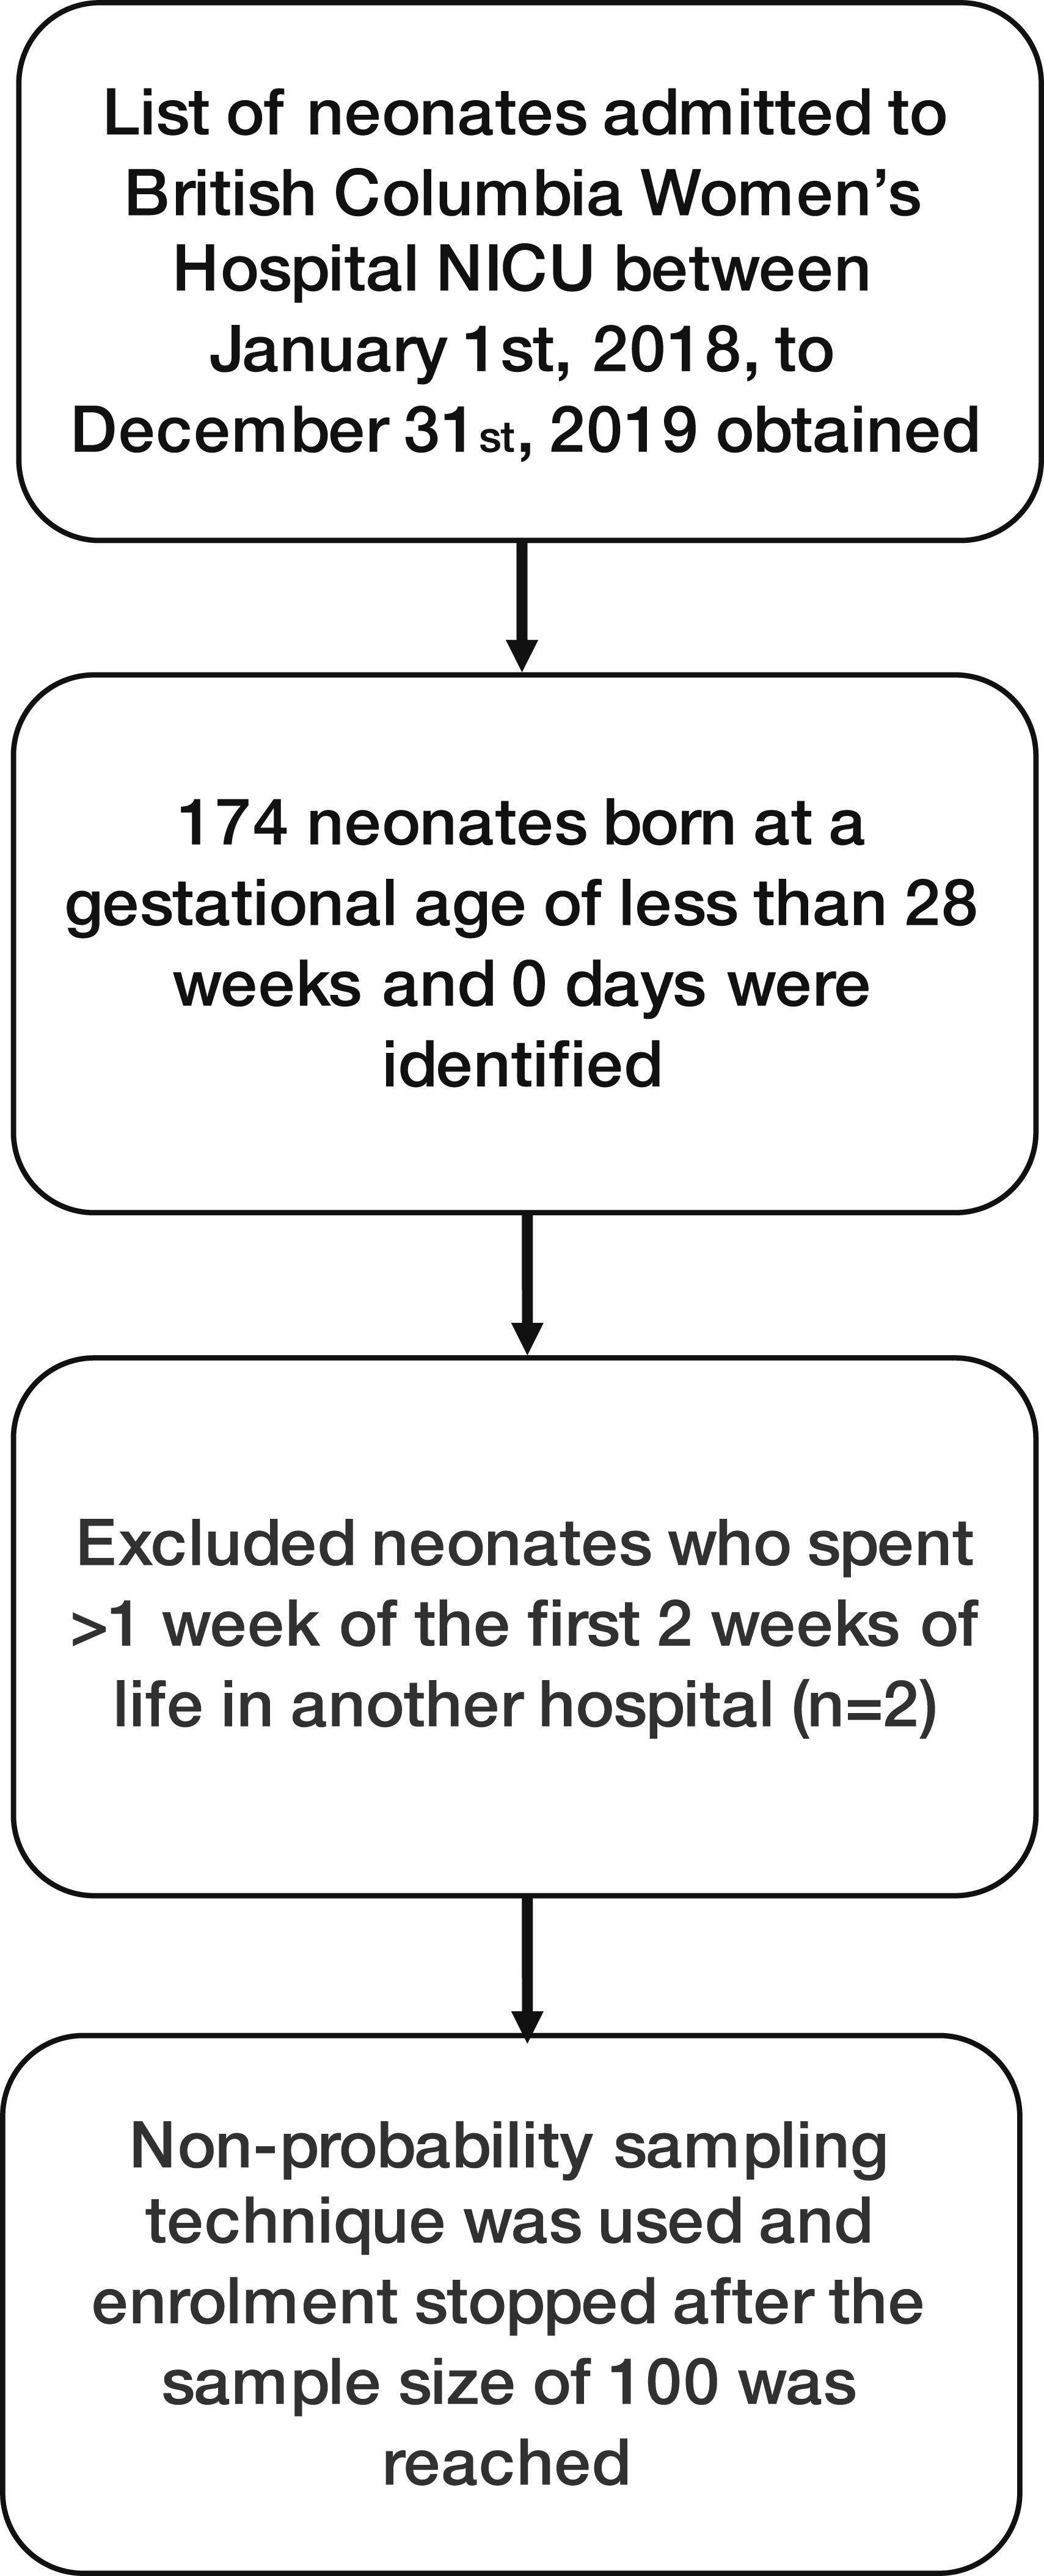
We documented the serum sodium levels during the first 14 days after birth. When documenting Na in an infant with multiple normal Na reports in a day, the first reported Na of the day was recorded. If the infant had multiple hyponatremia readings, the lowest value was recorded. When a patient had one or more laboratory values revealing hyponatremia on the same day, this was labeled as a hyponatremia day (HD). Investigations performed during the first 24-h period after identification of hyponatremia (repeat Na, urea, creatinine, urine osmolality, urinalysis, urine electrolytes, thyroid function, serum cortisol level) were documented. Similarly, treatment interventions in the first 24-h period after identification of hyponatremia (changes in TFI or sodium intake, 3% sodium chloride correction, normal saline bolus, blood products) were documented for each HD. The actual fluid intake calculation included all intravenous (IV) fluids, boluses, medications, blood products, and enteral feeds in ml/kg/day. The total sodium intake included all IV fluids, boluses, sodium and bicarbonate corrections, and oral sodium supplements in mmol/kg/day. Sodium intake from blood products was not included while calculating the total sodium intake. Patent ductus arterioles (PDA) was recorded only if it was hemodynamically significant.
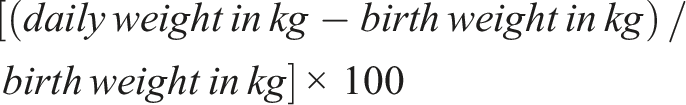
Cumulative fluid overload percent was calculated using the formula:
Definitions
EPN was defined as a neonate born at a gestational age of less than 28 weeks and 0 days. EOH was defined as hyponatremia experienced in the first 14 days. Hyponatremia was defined as serum Na below 135 mmol/L. 1 To enable assessing hyponatremia in a more granular fashion we further defined mild (serum Na 130-134 mmol/L), moderate (serum Na 126-129 mmol/L), and severe hyponatremia (serum Na ≤125 mmol/L), based on earlier published studies.1,4,5 HD was defined as any day when one or more hyponatremia values were recorded. When a patient continued to have hyponatremia the following day, it was labeled as a separate HD irrespective of the severity of hyponatremia. AKI was defined based on both serum creatinine (SCr) and 24-h average urine output according to the Kidney Disease Improving Global Outcomes (KDIGO) work group AKI definition 6 modified for neonates as previously published in neonatal studies. 7 The lowest prior SCr measurement after the first 48 h of life was considered as baseline SCr. The SCr from the first 48 h of life was disregarded. Oliguria was defined as a urine output of <1 ml/kg/hr for 24 h. A hemodynamically significant PDA was defined as a duct requiring medical treatment or surgical intervention for closure.
Statistical analysis
With an estimate of hyponatremia prevalence between 35 and 55% based on a pilot study conducted in our institute, and a sample size of 100, we obtained a precision of ±10%. Based on the smallest detectable odds ratio we had ∼80% power to detect an odds ratio of 1.85 per standard deviation increase in predictor variable. Descriptive data including means and standard deviations for continuous variables and counts and percentages for categorical variables were used. The proportion of hyponatremia on a given day (as a fraction of neonates on that day) was calculated and plotted by severity level. To determine the relationship between Na, TFI, and the occurrence of hyponatremia the following day, we used a generalized estimating equation logistic regression model (to account for repeated measurements) adjusted for the treatment 2 days prior to hyponatremia. The models excluded the data of first 2 days after birth as these are likely influenced by in-utero exposures. Na intake was coded as the number of units above 5 mmol/kg/day (upper limit for Na supplementation in preterm neonates as per American Academy of Pediatrics). 8 TFI results are presented per 10 ml/kg/day increase. The odds ratios from this model represent the estimated effect of Na and TFI on a given day on the following day’s outcome. We assessed the relationship between Na intake and cumulative weight gain % graphically, stratified by days 1-14. We calculated quartiles of maximum weight gain and maximum fluid intake on day ≥7 and examined the distribution of these quartiles by worst hyponatremia episode on day ≥7 (to preserve the temporality of weight gain trajectory leading up to the HD). All analyses were conducted using R statistical software version 4.0.3 (Vienna, Austria).
Results
The gestational age range of the study population varied from 22 weeks 3 days to 27 weeks 6 days. The birth weight varied from 400 g to 1360 g. In the present study, EOH was noted in 85% of EPNs. Hyponatremia was most often first noted on day 6 and least commonly on days 3, 11, and 13 (Figure 2). Forty two percent of neonates had mild hyponatremia, 19% had moderate, and 18% had severe hyponatremia as their only hyponatremia experience. Among those with hyponatremia, 76% started with mild, 8% with moderate, and 1% with severe hyponatremia. Of the 76 who started with mild hyponatremia, 42 (55%) remained mild, 18 (23%) progressed to moderate (median 4 days later), and 16 (21%) progressed to severe hyponatremia (median 4 days later). Of the 8 who started with moderate hyponatremia, 2 (25%) became severely hyponatremic. At the end of 14 days, mortality rate was 9% (n = 9) and 3% were transferred to another hospital. The highest mortality rate was observed on day 3 (33%) after birth. Incidence graph of mild, moderate, and severe hyponatremia in extremely preterm neonates in the first 14 days of life. Notes. Mild (serum Na 130-134 mmol/L), moderate (serum Na 126-129 mmol/L) and severe hyponatremia (serum Na ≤125 mmol/L).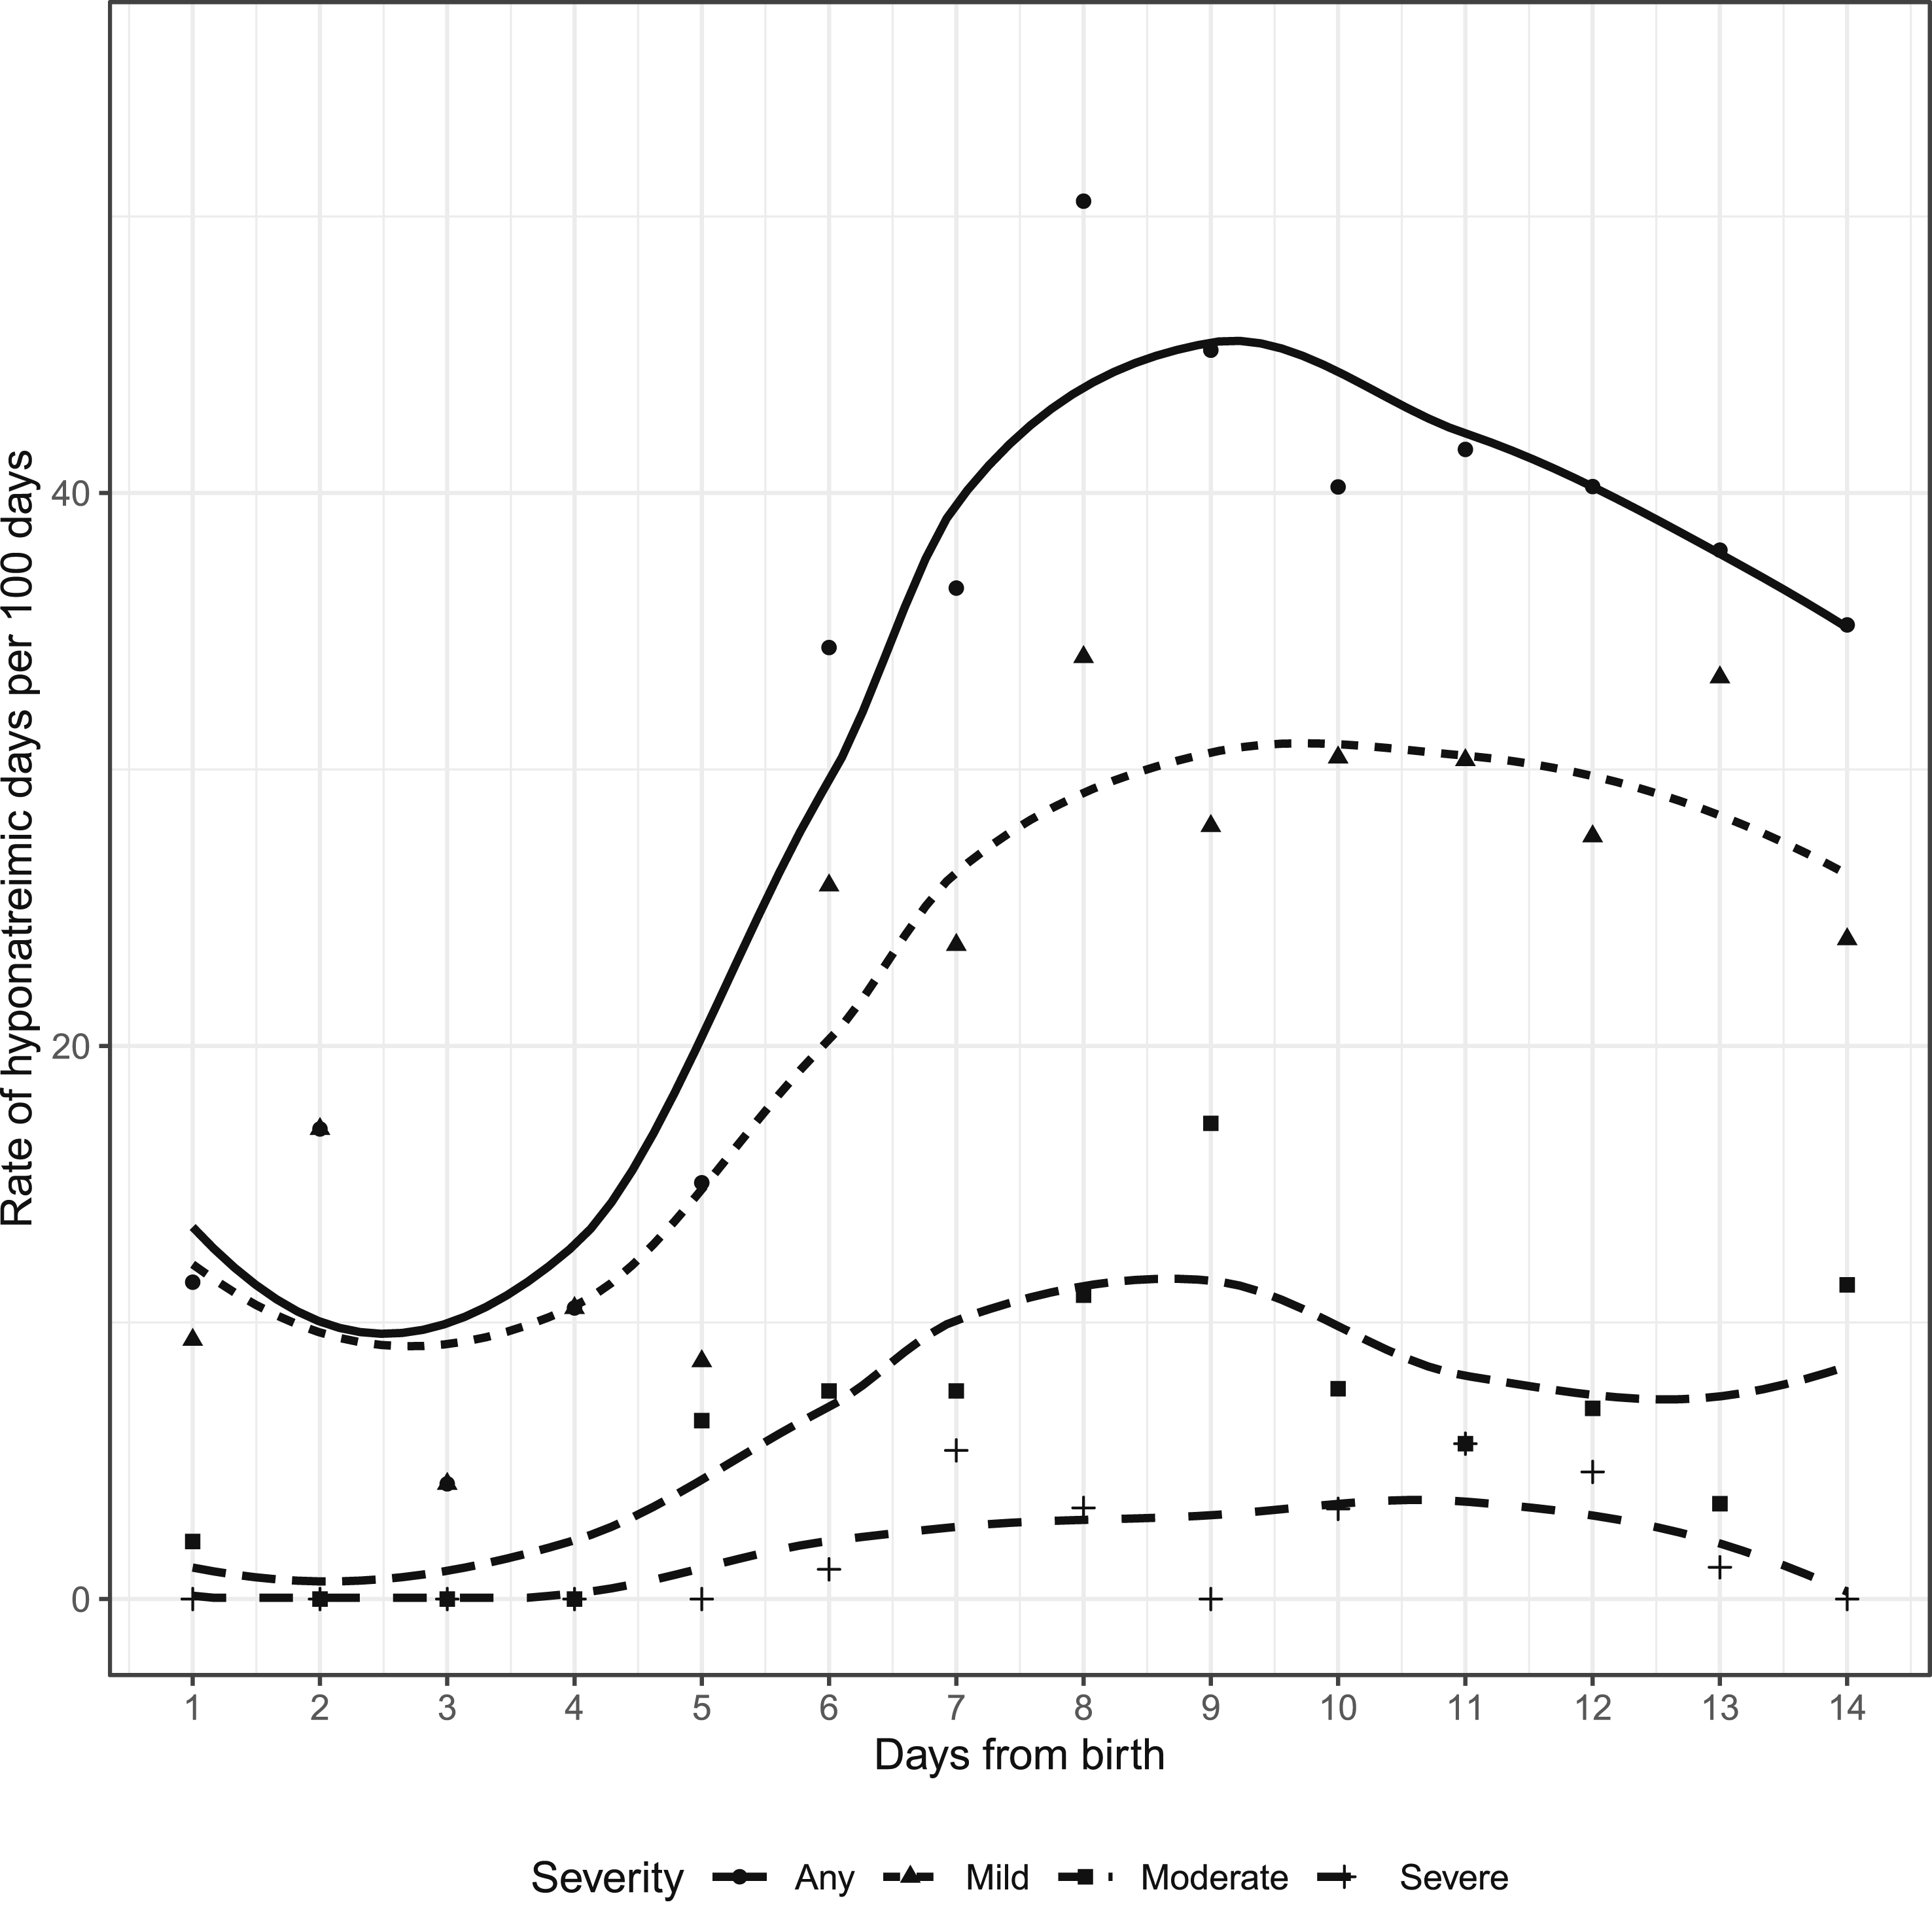
Maternal and infant demographics and infant outcomes by worst hyponatremic episode.

Notes. PIH (Pregnancy induced hypertension), GDM (Gestational diabetes mellitus), SGA (Small for gestational age).
aHyponatremia units in mmol/L.
bValues in n (%).
cValues in mean ± SD; all other infant values n (%).
There was a total of 383 HDs (29.5%) out of 1295 patient days recorded from 100 EPNs during the first 14 days after birth. Of the 383 HDs, lowest frequency of hyponatremia was seen on day 3, and highest frequency was seen on day 9, with increasing frequency noted from day 3 to day 9, followed by a gradual decline from day 9 to day 14 after birth. This pattern was similar for mild hyponatremia, with moderate and severe being more consistent across the 14 days (Figure 2). Of the 383 HDs, 323 HDs (84.3%) had a repeat Na check done in the next 24 h. In the rest of the cases, the infant had a day off getting labs done. At least one of the following urine investigations including: urinalysis, urine sodium, urine creatinine, or urine osmolality were performed in 21 HDs (5.4%), 132 HDs (34.4%) had SCr checked, and 42 HDs (10.9%) had no investigations sent in the following 24 h. Regarding interventions in the 24 h following HDs, 219 HDs (57.1%) had their sodium intake increased as a response to hyponatremia, 27 HDs (7%) had TFI restriction, 60 HDs (15.6%) had increased TFI prescribed, and 92 HDs (23.4%) had no interventions performed.
The median daily intake of sodium was 3.4 mmol/kg/day (IQR = 2.0 to 5.7) throughout the study period. The highest median sodium intake was on day 9, and lowest was on day 1. The day with highest median cumulative weight gain was day 14 and the lowest was day 4. On day 14 the median maximum change of body weight was +43.9% (IQR = 0% to +114%). Figure 3 shows the relative weight change curves based on worst hyponatremia episode. Relative weight change curves based on worst hyponatremia episode in extremely preterm neonates in the first 14 days of life. Notes. Serum sodium level units in mmol/L.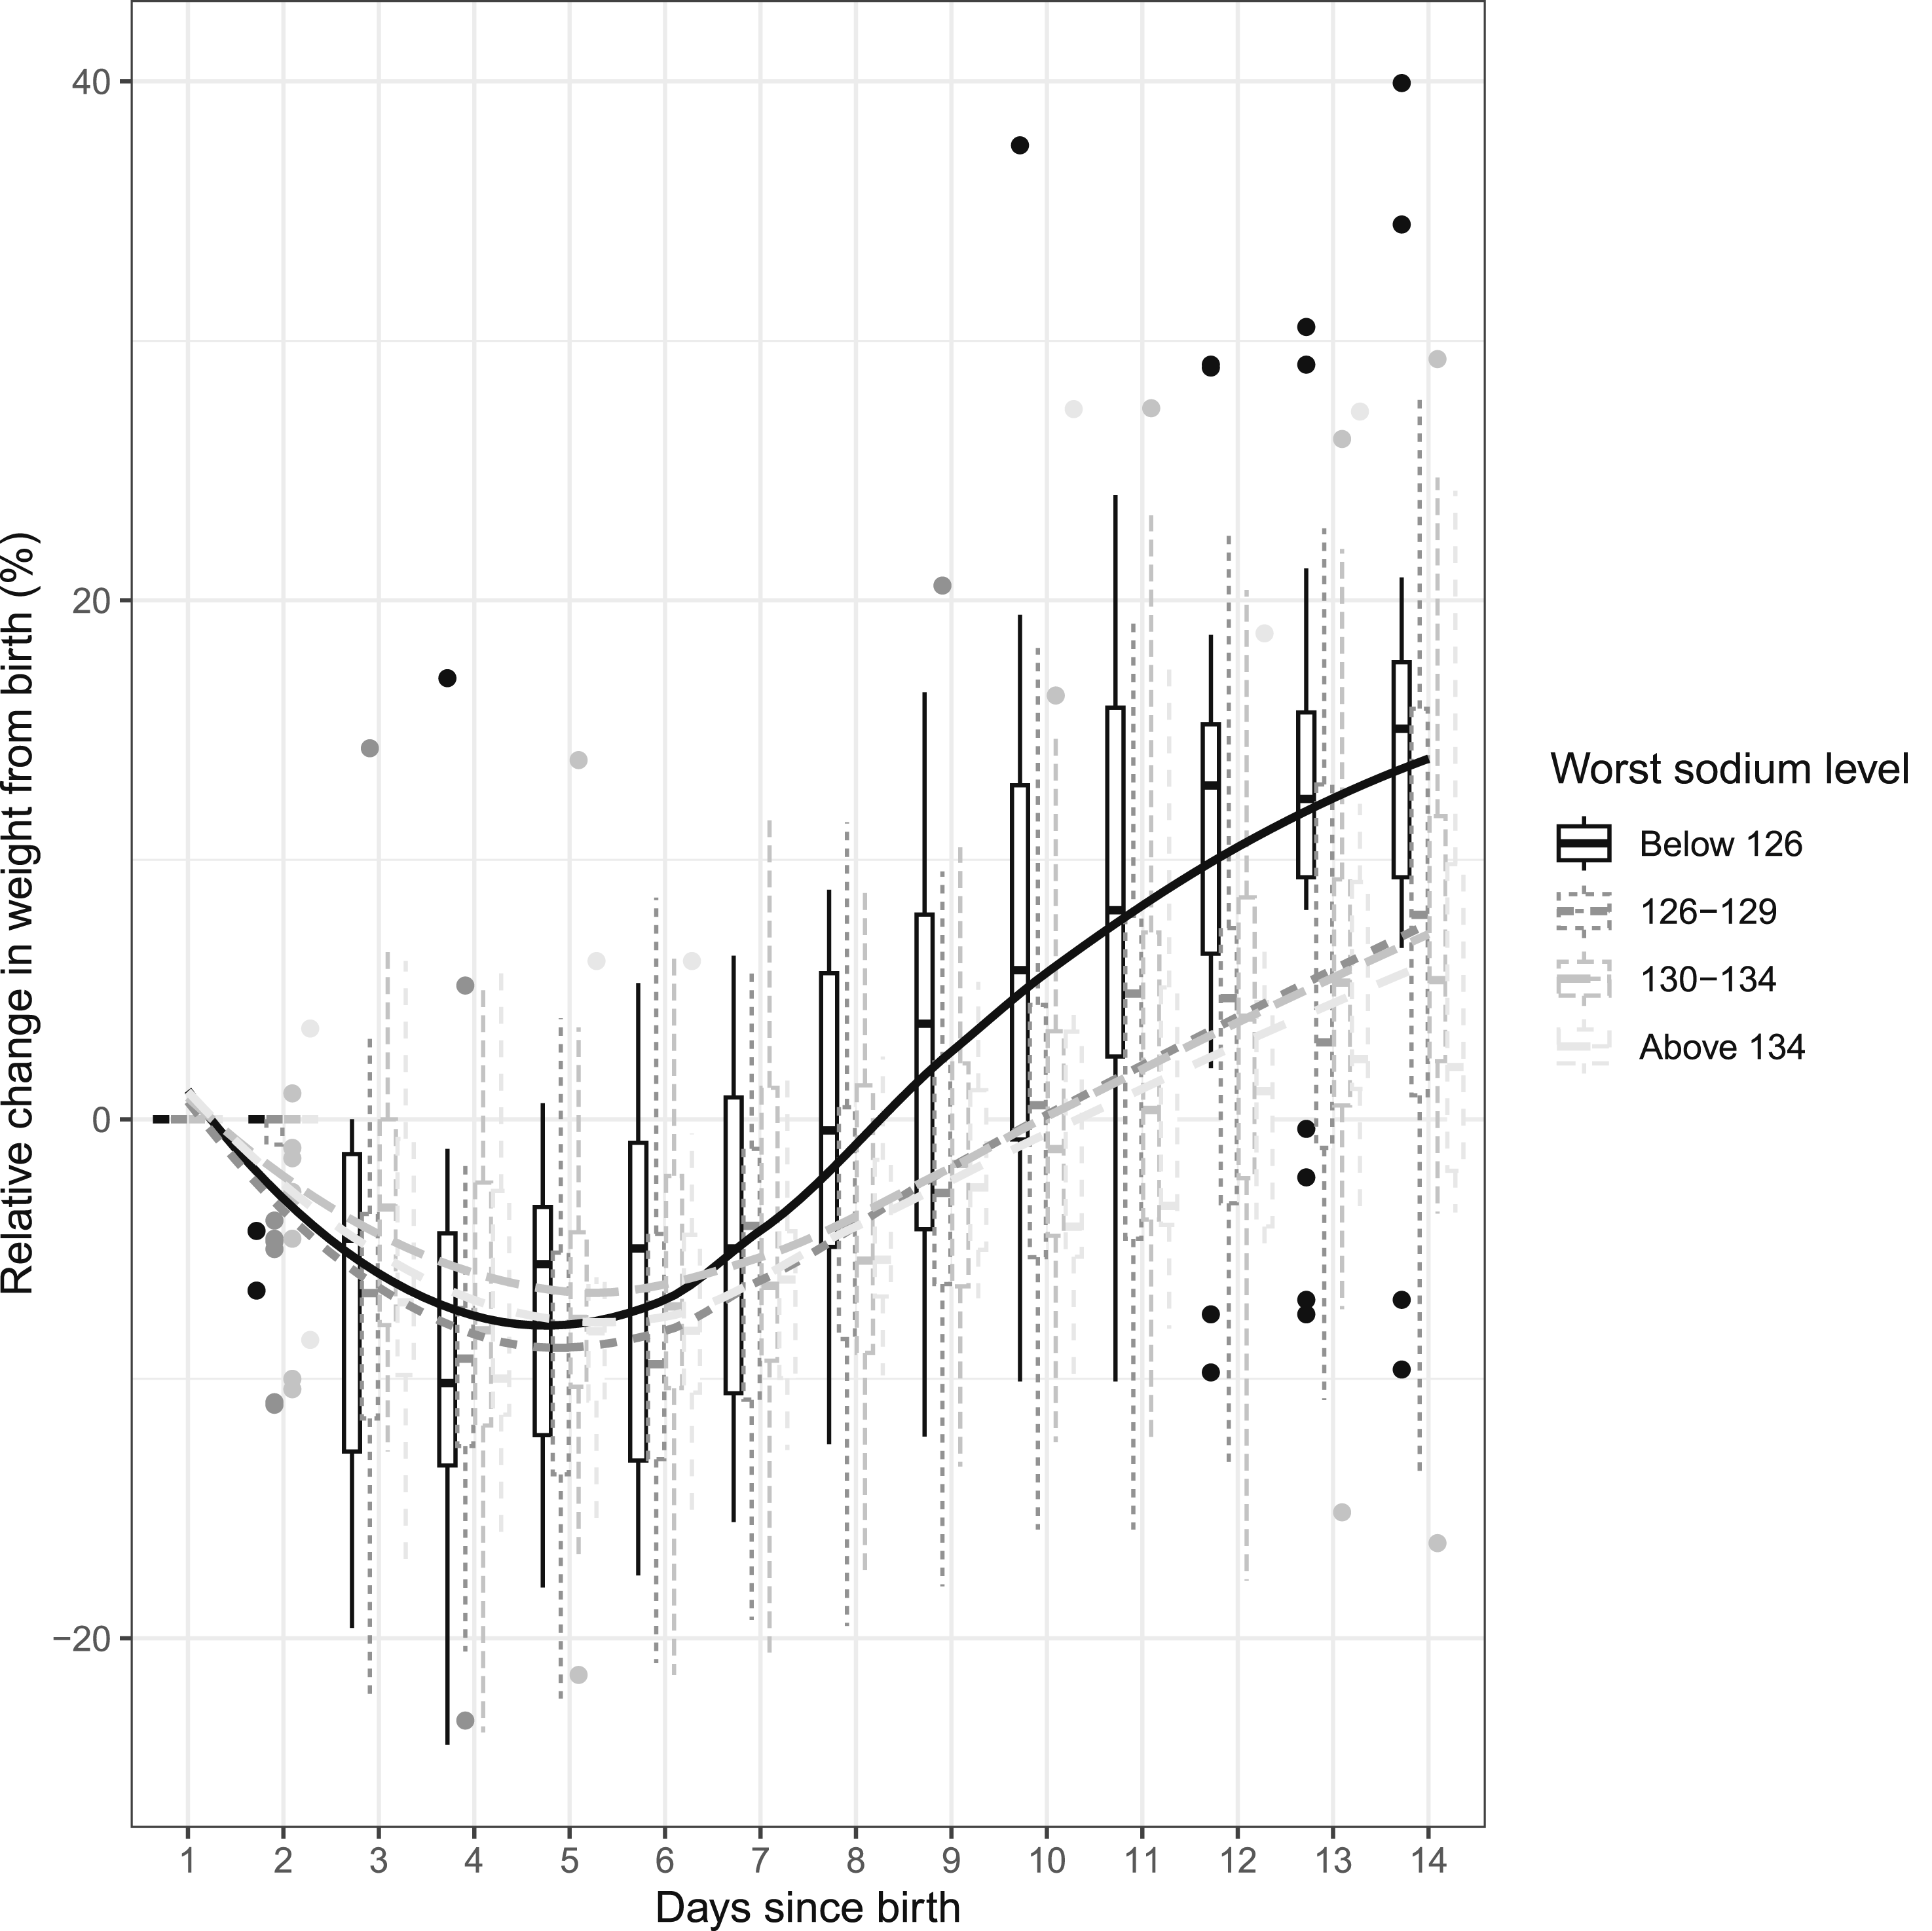
Supplemental Table 1 shows maximum weight gain at ≥7 days in the entire cohort of 93 neonates who were alive after 7 days. Ninety-three neonates were divided into 4 quartiles. Quartile 1 had cumulative weight change of −12.4 to +2.5%, quartile 2 had +2.5% to +9.1%, quartile 3 had +9.1 to +16.6%, and quartile 4 had +16.6 to +39%. A dose-response relationship was observed between maximum weight gain and the incidence of moderate or severe hyponatremia in neonates—Quartile 1: 8/24 (33%), Quartile 2: 9/23 (39%), Quartile 3: 10/23 (43%), and Quartile 4: 14/23 (61%).
Supplemental Table 2 shows the maximum fluid prescribed at ≥7 days in the entire cohort of 93 neonates who were alive after 7 days. Ninety-three neonates were divided into 4 quartiles. Quartile 1 had maximum fluid prescribed at 155-170 ml/kg/day, Quartile 2 had 171-178 ml/kg/day, Quartile 3 had 178-187 ml/kg/day, and Quartile 4 had 188-232 ml/kg/day. For a fluid intake of >171 ml/kg/day, there was a dose-response relationship trend between maximum fluid prescribed and the percentage of neonates developing moderate or severe hyponatremia as follows—Quartile 1: 10/24 (42%), Quartile 2: 7/23 (30%), Quartile 3: 12/23 (52%), and Quartile 4: 13/23 (57%).
Outcomes in moderate/severe hyponatremia group compared to no/mild hyponatremia group.
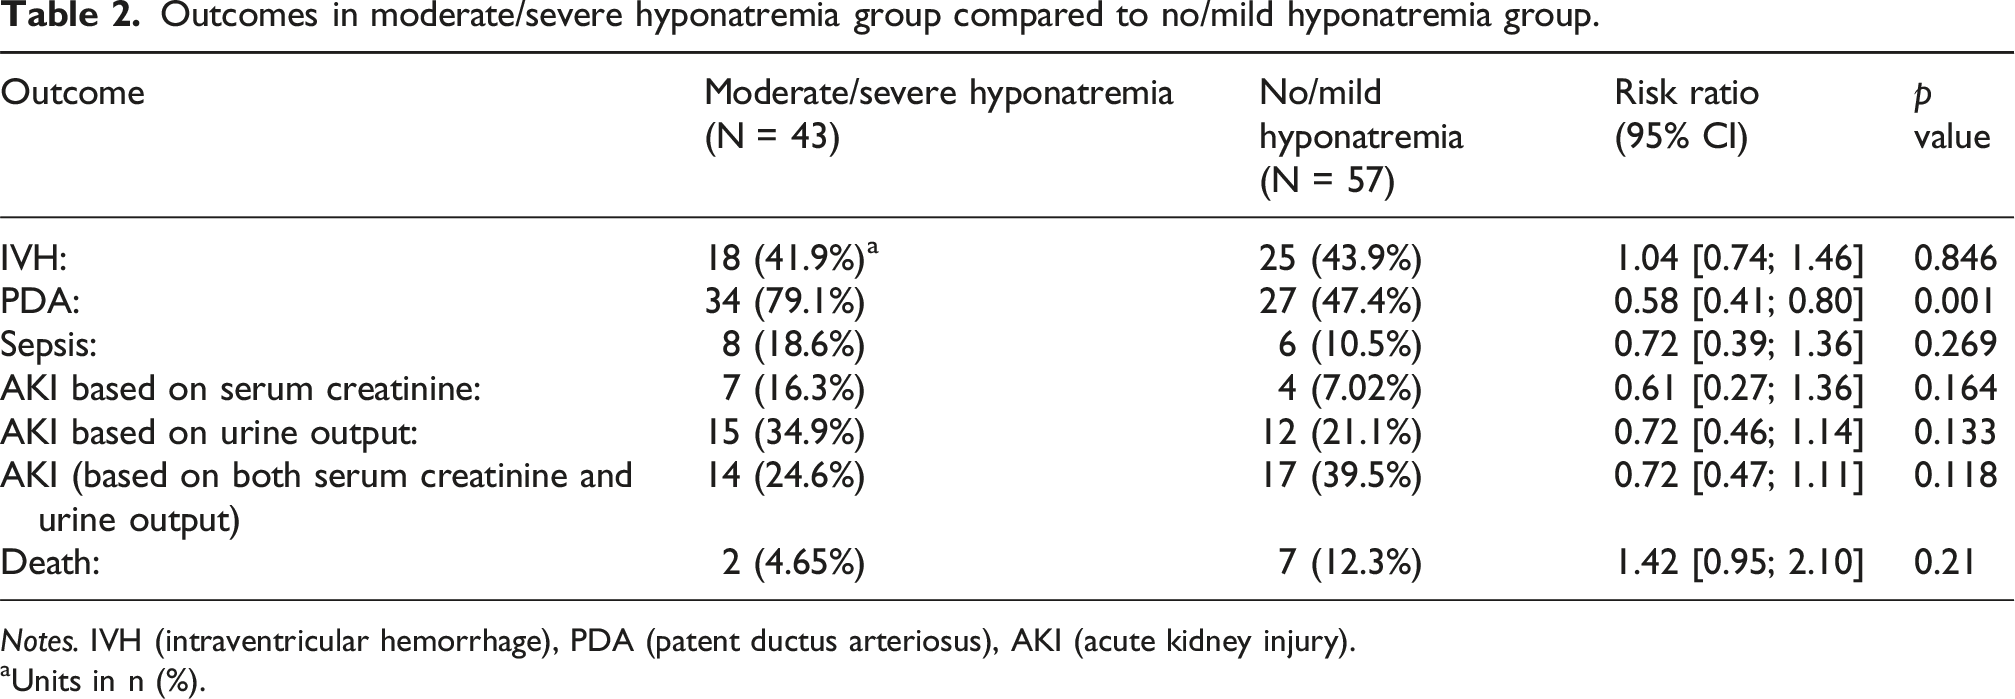
Notes. IVH (intraventricular hemorrhage), PDA (patent ductus arteriosus), AKI (acute kidney injury).
aUnits in n (%).
Figure 4 shows the trend of fluid and sodium intake across 14 days. For every 1 mmol/kg/day increase in sodium intake beyond 5 mmol, there was minimal increase in the odds of either having a new episode of hyponatremia, or the same episode continuing the next day (OR 1.03, 95% CI 0.97-1.10, p = 0.36). There was no relationship with increase in fluid intake by 10 ml/kg/day and the risk of hyponatremia on the following day (OR 1.00, 95% CI 0.99-1.01, p = 0.80). The median difference between daily actual fluid intake versus prescribed fluid intake was 8.4 ml/kg/day (IQR 1-22), indicating the actual intake was higher than prescribed. In terms of ventilation parameters, a 10-g increase in cumulative weight led to a 0.09 cm H2O (CI 0.06-0.13, p < 0.001) increase in mean airway pressure (MAP), and a 0.55% (CI 0.34-0.75, p < 0.001) increase in inhaled oxygen. Trend of sodium intake and fluid intake in extremely preterm neonates in the first 14 days of life. Notes. Sodium intake in mmol/kg/d; fluid intake in ml/kg/d.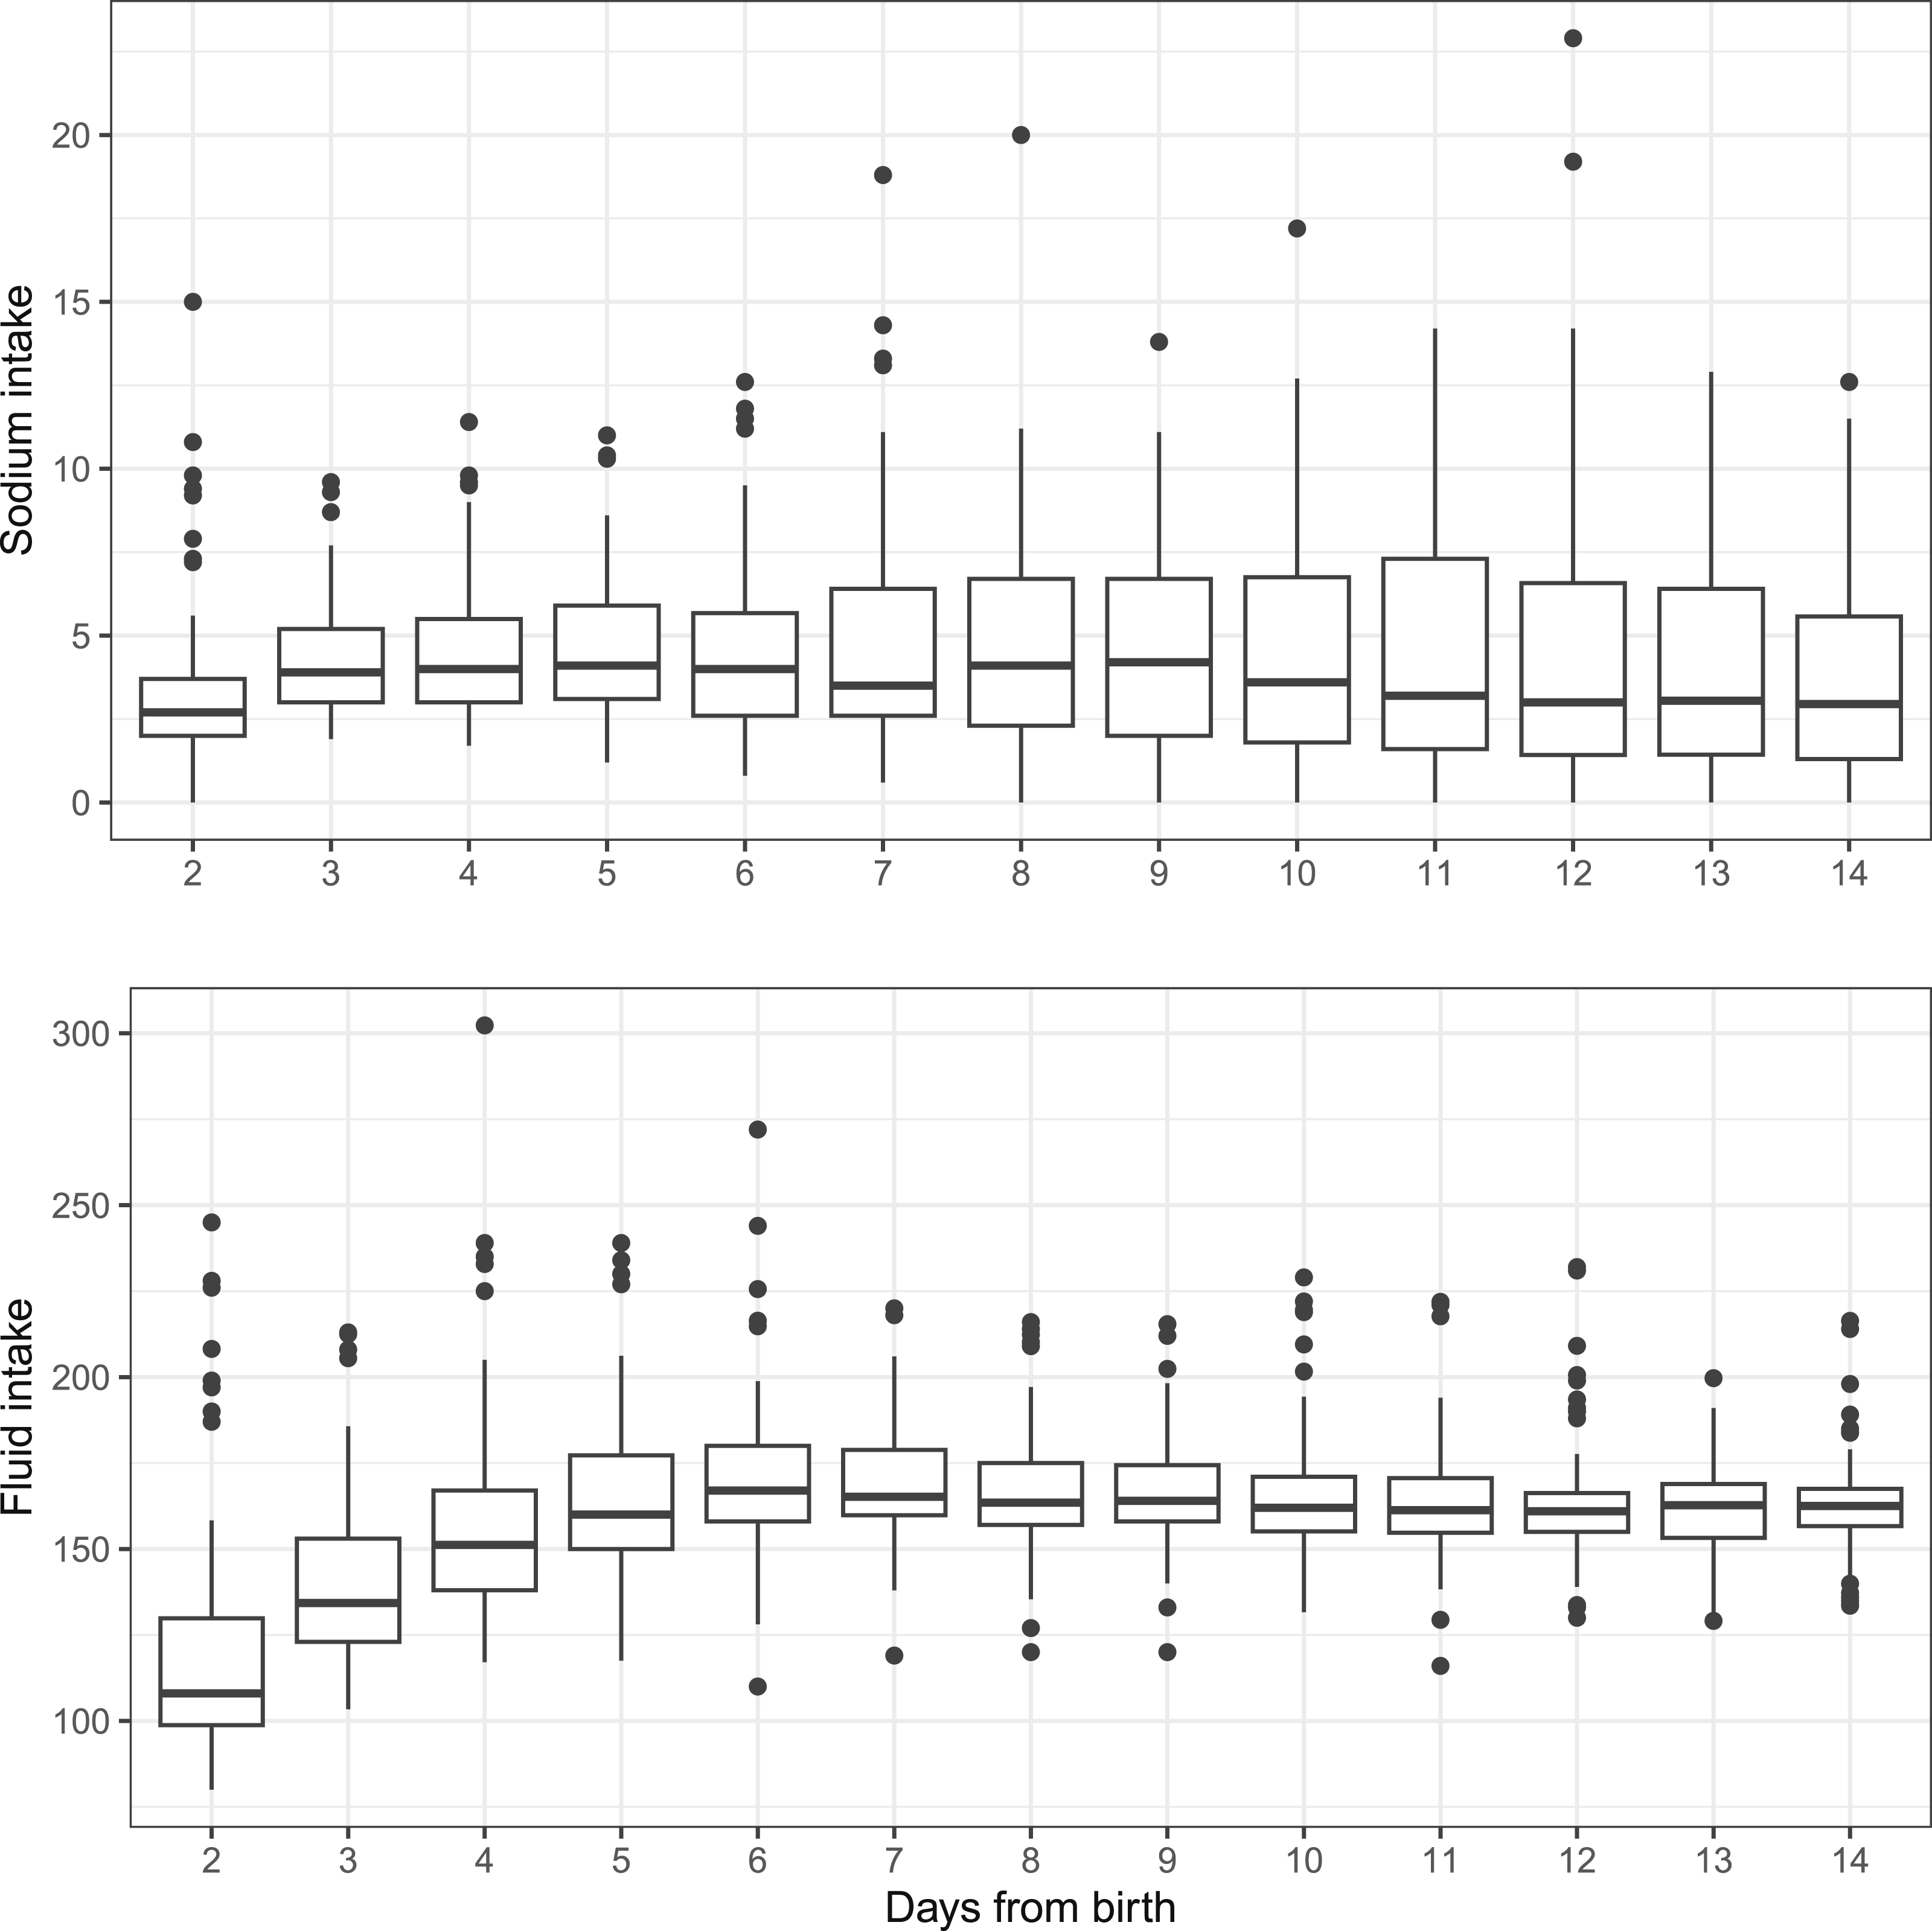
Discussion
Our study highlights the high prevalence of EOH in EPN, with a greater occurrence than previously reported.1,9,10 The higher prevalence may be due to our focus on neonates born before 28 weeks gestational age (GA), who are sicker than those in studies with broader GA ranges. Another reason could be the definition of hyponatremia considered as Na <135 mmol/L1,11, while hyponatremia has been variably defined in the literature. 9 We included a more detailed definition to help analyze the data in EPN better. Our findings demonstrate that mild hyponatremia (serum Na 130-134 mmol/L) often progresses to moderate (serum Na 126-129 mmol/L) or severe (serum Na ≤125 mmol/L) hyponatremia, underscoring the importance of early detection in this population. To the best of our knowledge, this is the first study performed on EPN that delineates the progression in the severity of hyponatremia. Time of onset of hyponatremia was different to that seen by Hao who had a slightly lower mean onset of hyponatremia at 3.4 ± 1.5 days after birth. 9
A notable finding is that physicians commonly responded to hyponatremia by simply repeating Na measurements, and not investigating for underlying causes such as AKI, SIADH, or urinary Na wasting. The lack of fluid restriction suggests that providers may assume hyponatremia is due to Na wasting rather than fluid overload. Segar et al. recommended identifying preterm neonates at risk for Na depletion based on Na concentrations.12–14 Our study is the first to report how physicians manage Na changes in hospitalized neonates.
The median daily intake of Na was well within the recommended levels.12,15,16 However, factors such as severity of illness, underlying kidney injury, and low GA could be contributing towards hyponatremia. Preterm neonates have limited Na reabsorption capacity due to immature renal tubular transporters, with urinary Na excretion inversely related to gestational and postnatal age.4,8,16 Additionally, the variability in fluid diuresis influenced by kidney maturity, elevated atrial natriuretic peptide, and use of nephrotoxic agents may explain why hyponatremia persisted despite Na supplementation.4,17–21 Factors such as administration of normal saline boluses, sodium bicarbonate infusions and blood products may lead to increased cumulative Na intake and resultant fluid overload.10,22 Thus, Na and fluid requirements should be re-assessed daily, with consultation with nephrology considered when hyponatremia becomes severe and resistant to Na supplementation.
Excessive weight gain was another key observation, which is likely indicative of fluid overload. In our study neonates regained their birth weight at around day 9 to day 10, similar to other reports.23–25 However, after this period, the weight gains were inappropriately high, evident by a very high median maximum change of body weight of +43.9% on day 14. The dose-response relationship of increasing fluid intake and particularly of cumulative weight gain, with the percentage of those with moderate and severe hyponatremia, supports association with fluid overload. The effects of excessive weight gain are reflected in the ventilation parameters in the form of higher mean airway pressure and oxygenation needs. In a retrospective study of 60 neonates undergoing abdominal surgery by Niknafs et al., fluid overload in the first three postoperative days was positively associated with increased duration of invasive ventilator support. 22 Based on two separate sub-analyses of the AWAKEN study, Selewski et al. found that in neonates with both GA of >36 weeks and <36 weeks, a higher peak fluid balance during the first postnatal week was independently associated with the need for mechanical ventilation on postnatal day 7.26,27 With our finding of higher maximum weight gain being related to higher proportions of moderate and severe hyponatremia, the latter is a potential biomarker that signals the provider to assess whether the infant is fluid overloaded.
We found no significant relationship between AKI and severity of hyponatremia (p = 0.118). The ability to diagnose AKI is affected by the lack of SCr monitoring and inconsistent urine output documentation, which could have led to missing episodes. Significant association of PDA with severe hyponatremia is an important finding while the role of fluid overload on PDA is being questioned by current research in Neonatology. 28 Our study found that EOH was not associated with Na intake exceeding the recommended 5 mmol/kg/day or with the previous day’s fluid intake. However, we only accounted for the prescribed doses of fluid and Na in the previous day and not the cumulative dose over several days.
Our study raises the important question of whether the daily increase in TFI is necessary while managing an EPN in the first few days after birth. Failure to lose weight postnatally in the context of inappropriate increase in fluid intake during the first week should raise concern that the neonate’s ability to contract the extracellular fluid space has been overwhelmed. We suggest that, in such cases, fluid management regimens should be re-evaluated. Fluid management of EPN should focus more closely on targeting weight loss (6-12% of birthweight) while maintaining Na homeostasis, rather than specific fluid intake values.
There are a few limitations to our study that include the inability to draw causal conclusions due to the observational nature of the study. Additionally, the complete response of clinical teams to hyponatremia, including whether investigations were ordered in response to hyponatremia, or were part of routine workups, was not evaluated. Further, the experience level of the physicians and the effects of resuscitation fluids were not considered, and Na intake from certain sources like blood products, medications, breast milk, formula, and fortifiers were not measured. The retrospective design of this study adds to the limitations and a prospective study would help draw causal conclusions.
In conclusion, our study demonstrates that EOH is highly prevalent in EPN. Recognition of mild hyponatremia is important as nearly half progressed to moderate and severe hyponatremia. The common clinical response of increasing sodium intake, without investigating the underlying cause, may result in unchecked fluid overload. Early identification of hyponatremia and a more thoughtful approach to sodium and fluid intake—considering causes such as AKI, SIADH, or salt wasting—is likely necessary. Future research, particularly prospective studies with planned investigations, is required to better understand the causes of hyponatremia and to refine fluid management strategies in EPN.
Supplemental material
Supplemental Material - Epidemiology of early onset hyponatremia in extremely preterm neonates: A retrospective observational study
Supplemental Material for Epidemiology of early onset hyponatremia in extremely preterm neonates: A retrospective observational study by Namrata Todurkar, Susan Albersheim, Jeffrey N. Bone, Li Wang, Cherry Mammen, and Rajavel Elango in Journal of Neonatal-Perinatal Medicine
Footnotes
Ethical considerations
University of British Columbia/Children’s and Women’s Health Centre of British Columbia Research Ethics Board, C&W REB, (REB number: H21-01441).
Author contributions
Study design, NT, SA, CM, and RE; Data acquisition, NT and LW; Data analysis, NT and JB; Data interpretation, NT, SA, JB, CM, and RE; Manuscript drafting, NT, SA, JB, LW, CM, and RE.
Funding
The authors disclosed receipt of the following financial support for the research, authorship, and/or publication of this article: Unfunded research, conducted as part of N Todurkar’s Neonatal Fellowship program.
Declaration of conflicting interests
The authors declared no potential conflicts of interest with respect to the research, authorship, and/or publication of this article.
Data Availability Statement
Original data collected will be made available based on reasonable request.
Supplemental material
Supplemental material for this article is available online.
Appendix
References
Supplementary Material
Please find the following supplemental material available below.
For Open Access articles published under a Creative Commons License, all supplemental material carries the same license as the article it is associated with.
For non-Open Access articles published, all supplemental material carries a non-exclusive license, and permission requests for re-use of supplemental material or any part of supplemental material shall be sent directly to the copyright owner as specified in the copyright notice associated with the article.