
Abstract
Objectives
This study investigated the relationship between the chemical composition of Yucca schidigera saponins and their antimicrobial and anticoccidial activities against Clostridium perfringens and Eimeria tenella.
Methods
Extracts of Y. schidigera were obtained using 100% methanol (MeOH), 50% MeOH, and water, and characterized by LC–HRMS to identify saponins. Multivariate analyses (PLS–DA and OPLS-DA) were performed to assess chemical differences among extracts. In vitro assays were conducted to evaluate antimicrobial activity against C. perfringens and anticoccidial activity against E. tenella. The most active extract was fractionated into three saponin-enriched subfractions, and ridge regression was applied to link chemical composition to bioactivity.
Results
LC–HRMS identified multiple saponins in all extracts, with chemical differences among solvents. The 100% and 50% MeOH extracts inhibited C. perfringens growth at 750 ppm, while the water extract was inactive. The 100% MeOH extract reduced E. tenella intracellular development by 77%, compared with 48% and 25% inhibition by the 50% MeOH and water extracts. Fractionation of this extract produced three subfractions, of which the first (fraction 1) showed the highest bioactivity (MIC = 500 ppm; 84% inhibition of E. tenella). Ridge regression highlighted schidigerasaponins D3/D4, smilagenin, sarsasapogenin, and hecogenin as key contributors to bioactivity.
Conclusion
Y. schidigera saponins exhibit significant antimicrobial and anticoccidial activity. The study establishes a data-driven framework for predicting structure–activity relationships, providing a rational basis for botanical screening and standardization.
Introduction
Intestinal diseases significantly impact poultry production, with coccidiosis and necrotic enteritis being the most prevalent and economically damaging. 1 Coccidiosis, caused by protozoan parasites of the genus Eimeria, and necrotic enteritis, primarily caused by Clostridium perfringens, lead to clinical symptoms such as diarrhea, reduced feed intake, poor weight gain, and increased mortality. 2 These diseases typically operate in tandem and are responsible for annual global losses estimated at 13 billion USD for coccidiosis, 3 and other 6 billion for necrotic enteritis. 4 Conventional anticoccidial drugs and antibiotics have been extensively used for the control of these infections; however, cases of resistance to these treatments have emerged, and the restrictions on the use of antibiotics have further exacerbated their impact on the poultry industry. 1 For this reason, there is growing interest in exploring novel anticoccidial candidates, like plant-derived molecules, as potential game-changers in the battle against parasite and bacterial infections.
Among plant-derived bioactive compounds, Yucca schidigera has gained attention for its reported anticoccidial, antimicrobial, antifungal, and antiparasitic properties, making them promising candidates for animal health and nutrition.5–7 Its biological activity is attributed to saponins, a diverse class of steroidal or triterpenoid secondary metabolites linked to sugar moieties.6,8 However, despite their use in animal health,9–11 the efficacy of Y. schidigera extracts in controlling Eimeria spp., and C. perfringens remains poorly characterized. Moreover, the characterization of Y. schidigera extracts is particularly challenging due to the considerable variability in aglycone structures and in the type and number of sugar moieties attached.12,13
Solvent polarity plays a key role in determining plant extracts’ chemical composition and biological activity. 14 While pure methanol (MeOH) and methanol-water mixture are known to extract saponins, 15 water and the hydroalcoholic mixtures can also be used to extract more polar compounds, 16 leading to differences in biological activity. Understanding the saponins composition in different extraction solvents is important for optimizing Y. schidigera extracts for biological applications. While previous studies have generally attributed the biological effects to the whole plant rather than to individual metabolites, 17 the present work specifically investigated the role of saponins. A major challenge in this context has been the difficulty in identifying these compounds, which has hindered efforts to standardize Y. schidigera extracts across the industry. Establishing reliable methods for standardization would be a significant step forward, as it would enable a direct correlation between saponin content and key bioactivities, such as antimicrobial and anticoccidial effects, providing a meaningful measure of extract quality.
This study investigated the chemical composition of Y. schidigera extracts using liquid chromatography coupled with high-resolution mass spectrometry (LC-HRMS), comparing metabolite profiles across three solvents (100% MeOH, 50% MeOH, and water). Partial Least Squares Discriminant Analysis (PLS-DA) and Orthogonal Partial Least Squares Discriminant Analysis (OPLS-DA) were performed to identify clustering patterns and link key metabolites to biological activity.18–20 The extracts were tested in vitro for antimicrobial effects against C. perfringens and inhibition of E. tenella intracellular development, highlighting their potential as natural alternatives for maintaining poultry health. The most bioactive extract was then fractionated, and subsequently ridge regression in combination with correlation analyses was used to identify the saponins most closely associated with the observed activities.
Therefore, the main objectives of this study were to characterize the saponin profile of Y. schidigera extracts obtained using solvents of different polarities to determine the most suitable solvent for saponin extraction, evaluate their antimicrobial and anticoccidial activities in vitro, and identify the metabolites most strongly associated with these biological effects.
Experimental Section
Plant Material
Y. schidigera Roezl ex Ortigies dried stems were obtained from Or SELL S.p.A (Soliera, MO, Italy). The plant material was dried and ground into a fine powder using a mechanical mill. The resulting powder was homogenized and sieved through a 60 mesh sieve (250 µm) to ensure a uniform particle size distribution. The material was supplied with certificates of analysis confirming their botanical origin and composition (feed and food grade, in compliance with EU Regulation 2022/1104). The authenticity of the plant material was verified based on these certificates and confirmed taxonomically according to The Plant List database.
Extraction and Purification of Saponins
The extraction method was adapted from Skhirtladze et al (2011) 21 with minor modifications. Briefly, dried plant material was placed in a round-bottom flask, and the extraction solvent (methanol, MeOH, Carlo Erba, Milan, Italy, technical grade; 50% MeOH or water) was added at a 1:5 (w/v) ratio. The mixture was stirred at room temperature for 1 h, followed by reflux extraction for 2 h. The supernatant was filtered through Whatman No. 41 filter paper (pore size 20-25 µm, Cytiva, Marlborough, MA, USA), and the solvent was completely evaporated using a rotary evaporator (BUCHI Labortechnik AG, Flawil, Switzerland) under reduced pressure. The dried residue was resuspended in water and purified by liquid-liquid extraction (3 × 20 mL n-hexane, Carlo Erba, Milan, Italy; 3 × 20 mL n-butanol, Carlo Erba, Milan, Italy). The n-butanol fraction, containing saponins, was concentrated using a rotary evaporator, and the resulting residue was subjected to LC-HRMS analysis. The dried residues were stored in Eppendorf tubes at −20 °C until further use. Fractions collected from TLC and column chromatography were stored in Falcon® tubes under the same conditions. Biological assays were performed at Vetagro S.p.A. (Reggio Emilia, Italy), whereas LC-HRMS characterization was carried out at Oregon State University (USA). The study was conducted between June 2024 and March 2025.
Saponin Fractionation and TLC Analysis
The fractionation and chromatography procedures were adapted from Skhirtladze et al (2011) 21 and the TLC development method from Moghimipour and Handali (2014), 22 with minor modifications. Briefly, the residue from the extraction and purification of the sample was rinsed with 2 mL of 100% MeOH and fractionated using a glass chromatography column (15.00 mm i.d, 200 mm, 35 mL, 14/23 NS; VWR, Radnor, PA, USA) packed with silica gel 60. The column was prepared using the wet-loading technique with MeOH as the packing solvent, and the sample was eluted with a chloroform/MeOH gradient (9:1 to 0:1, v/v; CHCl3, Carlo Erba, Milan, Italy). Elution was monitored using thin-layer chromatography (TLC; 0.20 mm silica gel 60, 5 cm × 15 cm, Macherey-Nagel, Düren, Germany). The elution chamber consisted of CHCl3:MeOH (1:1, v/v), and vanillin-sulfuric acid (H2SO4:EtOH, 1:50, v/v, with 2% vanillin) was used as the developing reagent. Molecular spots were visualized after thermal development at 105 °C for 15 min in a laboratory oven.
Fractions were collected into Falcon® tubes, and the eluent composition was adjusted based on changes observed in the TLC profile. The collected fractions were pooled to obtain fractions F1, F2, and F3, then dried using a vacuum concentrator (Savant SpeedVac DNA 130, Thermo Scientific), subsequently used for antimicrobial and anticoccidial development assays, and analyzed in LC-HRMS.
Reference Standards
Reference standards for hecogenin (CAS: 467-55-0), sarsasapogenin (CAS: 126-19-2), schidigerasaponin F2 (CAS: 117210-12-5), and smilagenin (CAS: 126-18-1) were purchased from Aaron Chemicals (Shanghai, China). Digoxin-d3 (internal standard, CAS: 127299-95-0) was purchased from Cayman Chemical (Ann Arbor, MI, USA). All standards were used without further purification.
LC-HRMS Characterization of the Extracts
Chemical characterization of the saponin-rich extracts and fraction was performed using high-resolution mass spectrometry. Chromatographic separation was carried out on a Nexera UHPLC system (Shimadzu, Kyoto, Japan) equipped with an LC-30AD pump, SIL-30AC autosampler, and CTO-20A column oven. Separation was achieved using a Waters ACQUITY UPLC® BEH C18 column (1.7 µm, 2.1 × 100 mm). The mobile phase consisted of water with 0.1% formic acid (solvent A, UHPLC-MS grade, Carlo Erba, Milan, Italy) and acetonitrile (solvent B, UHPLC-MS grade Carlo Erba, Milan, Italy). The flow rate was set to 0.6 mL/min with the following gradient profile: 25% B at 1.32 min, linear increase to 50% B from 1.1 to 5.39 min, a further increase to 90% B until 6.59 min, maintained at 90% B until 15.16 min, then decreased to 25% at 16.02 min and held at 25% until 19.45 min. The injection solvent was 50% MeOH, and the injection volume was 3 µL.
Mass spectrometric analysis was performed using a TripleTOF 5600 system (Sciex) operated in information-dependent acquisition (IDA) mode. Digoxin-d3 was used as an internal standard. The ionization source was electrospray ionization (ESI) operated in positive mode. The collision energy was set to 40 V, and the declustering potential was 80 V. Data acquisition and processing were performed using PeakView software (XIC manager) from a list of 115 saponins generated by comparison with literature reports 21 23–28 and the KNApSAck database. In particular, the identification method of the compounds was classified into level 1, if the identification was conducted using standards, or level 2, using comparison with data available in literature or specific datasets. 29
Antimicrobial Assay on C. perfringens
The minimal inhibitory concentration (MIC) of the saponins was determined using a microdilution method in 96-well microtiter plates. For the test, C. perfringens ATCC 13124 was grown in reinforced clostridial medium (RCM, VWR, Radnor, PA, USA) with 1.5% agar at 37 °C in anaerobic conditions.
Yucca extracts were tested over a range of concentrations from 2000 to 25 ppm. MeOH was tested from 6 to 0.25 ppm to exclude any inhibitory effect of the solvent. Considering previous literature,
30
the concentration range was selected to cover both high and low dosages to ensure detection of the antimicrobial effect. The bacterial strain (105 CFU/mL) was incubated with the tested substances under anaerobic conditions for 24 h. Afterwards, the absorbance was read with a spectrophotometer at 630 nm to measure bacterial growth. The growth was determined as follows:

MIC was defined as the lowest concentration that resulted in a complete inhibition of visible growth. 31
The minimal bactericidal concentration (MBC) was determined by plating the MIC wells showing no visible bacterial growth on fresh agar medium without the substances. The plates were incubated at 37 °C in anaerobic conditions for 24 h. The MBC was determined as the lowest concentration at which no bacterial colonies were observed. 32
Cell Culture
Madin-Darby Bovine Kidney cells (MDBK, Cat.# CCL-22, ATCC, Manassas, VA) were maintained in cell culture flasks (Sarstedt AG & CO. KG) in basal medium, containing Dulbecco's Modified Eagle's Medium (Sigma Aldrich, St. Louis, MO, USA), 10% fetal bovine serum (Sigma-Aldrich, St. Louis, MO, USA), 1x penicillin-streptomycin (Sigma-Aldrich, St. Louis, MO, USA), 1x MEM non-essential amino acid solution (Sigma-Aldrich, St. Louis, MO, USA), and 10 mM L-glutamine (Sigma-Aldrich, St. Louis, MO, USA).
For the anticoccidial assay, 3 × 10⁴ MDBK cells were seeded on 96-well plates (Corning Incorporated, Corning, NY, USA) and grown for 48 h at 37 °C and 5% CO2.
Eimeria tenella Development Assay
E. tenella sporozoites were obtained as previously described. 9 A total of 5 × 10⁴ sporozoites per well were used to infect MDBK cells. After 4 h post-infection (hpi), the non-invading sporozoites were removed and the medium was replaced with a fresh one. The treatments were applied at the moment of infection and kept through the whole time course. After 48 hpi, the cells were provided with fresh medium containing their respective treatments. A dose of 100 ppm of all the extracts and saponin fractions was chosen as treatment based on previous literature findings reporting anticoccidial efficacies of botanical extracts in vitro.2,33
Cells were harvested at 24 hpi and 72 hpi. For the harvesting, the cells were washed twice with phosphate-buffered saline (PBS – Sigma Aldrich, St. Louis, MO, USA) and lysed using RP1 buffer (Macherey-Nagel GmbH & Co. KG, Düren, Germany) for nucleic acid extraction.
Nucleic Acid Extraction and qPCR
The DNA of the cells harvested at 24 hpi and 72 hpi was extracted using NucleoSpin Tri-prep kit according to the manufacturer's instructions. The DNA was used to quantify copies of E. tenella DNA according to the number of copies of the internal transcribed spacer 1 gene (ITS-1 - forward primer: TGGAGGGGATTATGAGAGGA, reverse primer: CAAGCAGCATGTAACGGAGA). Real-time PCR reactions were performed in duplicate using CFX Connect Real-Time PCR System and iTaq Universal SYBR Green Supermix (Bio-Rad Laboratories, Hercules, CA, USA) as previously described.
34
The quantification of the intracellular parasites was achieved with a standard curve obtained with serial dilutions of the cloned sequence of the ITS-1 gene. The presence of the parasite in the cells was calculated with the following formula:

Statistical Analysis
Statistical analyses were conducted using SPIDER (v5.5.1). For the multivariate analysis, LC–MS/MS peak intensity data obtained from GNPS (Global Natural Products Social Molecular Networking) were used. 35 Raw chromatograms acquired in ESI+ mode were processed in GNPS for feature detection, alignment, and molecular networking. The resulting normalized feature table was imported into SPIDER for PLS-DA and OPLS-DA modeling. Additional data processing, scaling, and visualization were performed in Python using pandas, numpy, scikit-learn (StandardScaler, PLSRegression), and seaborn.
Variable Importance in Projection (VIP) scores were used to identify the solvent that contributed the most to the separation of the clusters. Data visualization was carried out with matplotlib and seaborn.
The importance of metabolites was assessed by constructing a correlation matrix and applying a Ridge Regression model to a dataset consisting of LC-HRMS intensity data from three saponin-containing fractions (F1, F2, F3), scaled using the min-max method, along with the corresponding MIC values. The correlation matrix was generated using pandas, matplotlib, and seaborn for data processing and visualization. Ridge Regression was performed with pandas, numpy, and scikit-learn (RidgeCV, train_test_split, StandardScaler, mean_squared_error, and r2_score) to determine the saponins most contributing to biological activity. Ridge regression was selected because it is particularly suitable for small datasets with several potentially correlated predictors, as in this study (15 metabolites across three fractions). 19 This approach applies an L2 regularization term that penalizes large coefficients, thereby reducing model variance and preventing overfitting, leading to better generalization on unseen data. 19 Similar to the approach of Vigneswaran et al (2024), 36 it was used here to obtain a stable and interpretable preliminary model to identify the metabolites most closely associated with the observed biological activity.
Concerning data of the biological activity assessment, GraphPad prism 10.2.3 was used for statistical analysis. For all the data, normality was assessed with the Shapiro-Wilk test (p > 0.05). Normally distributed data were analyzed using one-way ANOVA, to compare groups within each test or timepoint. To define significant differences among groups, post hoc Tukey's test was used. Differences were considered significant when the p value was ≤ 0.05 and were denoted as letters.
Results
Metabolic Profiling of Y. schidigera Extracts
LC-HRMS allowed the identification of 15 saponins, 13 saponins, and 11 saponins in Y. schidigera extracted with 100% MeOH, 50% MeOH, and water, respectively (Figure 1). Table 1 shows the detailed LC–HRMS identification data for the compounds, including compound name, molecular formula, molecular ion (calculated), molecular ion (experimental), mass error (ppm), MS/MS fragmentations pattern, retention time, reference, and detection in extracts. The representative total ion chromatogram (TIC) of the 100% MeOH extract, which highlights the overall profile and relative abundances of the detected metabolites, is shown in Figure 2. Chromatograms and mass spectra of the metabolites and reference standards are provided in the Supplemental Material (Figures S1–S32).
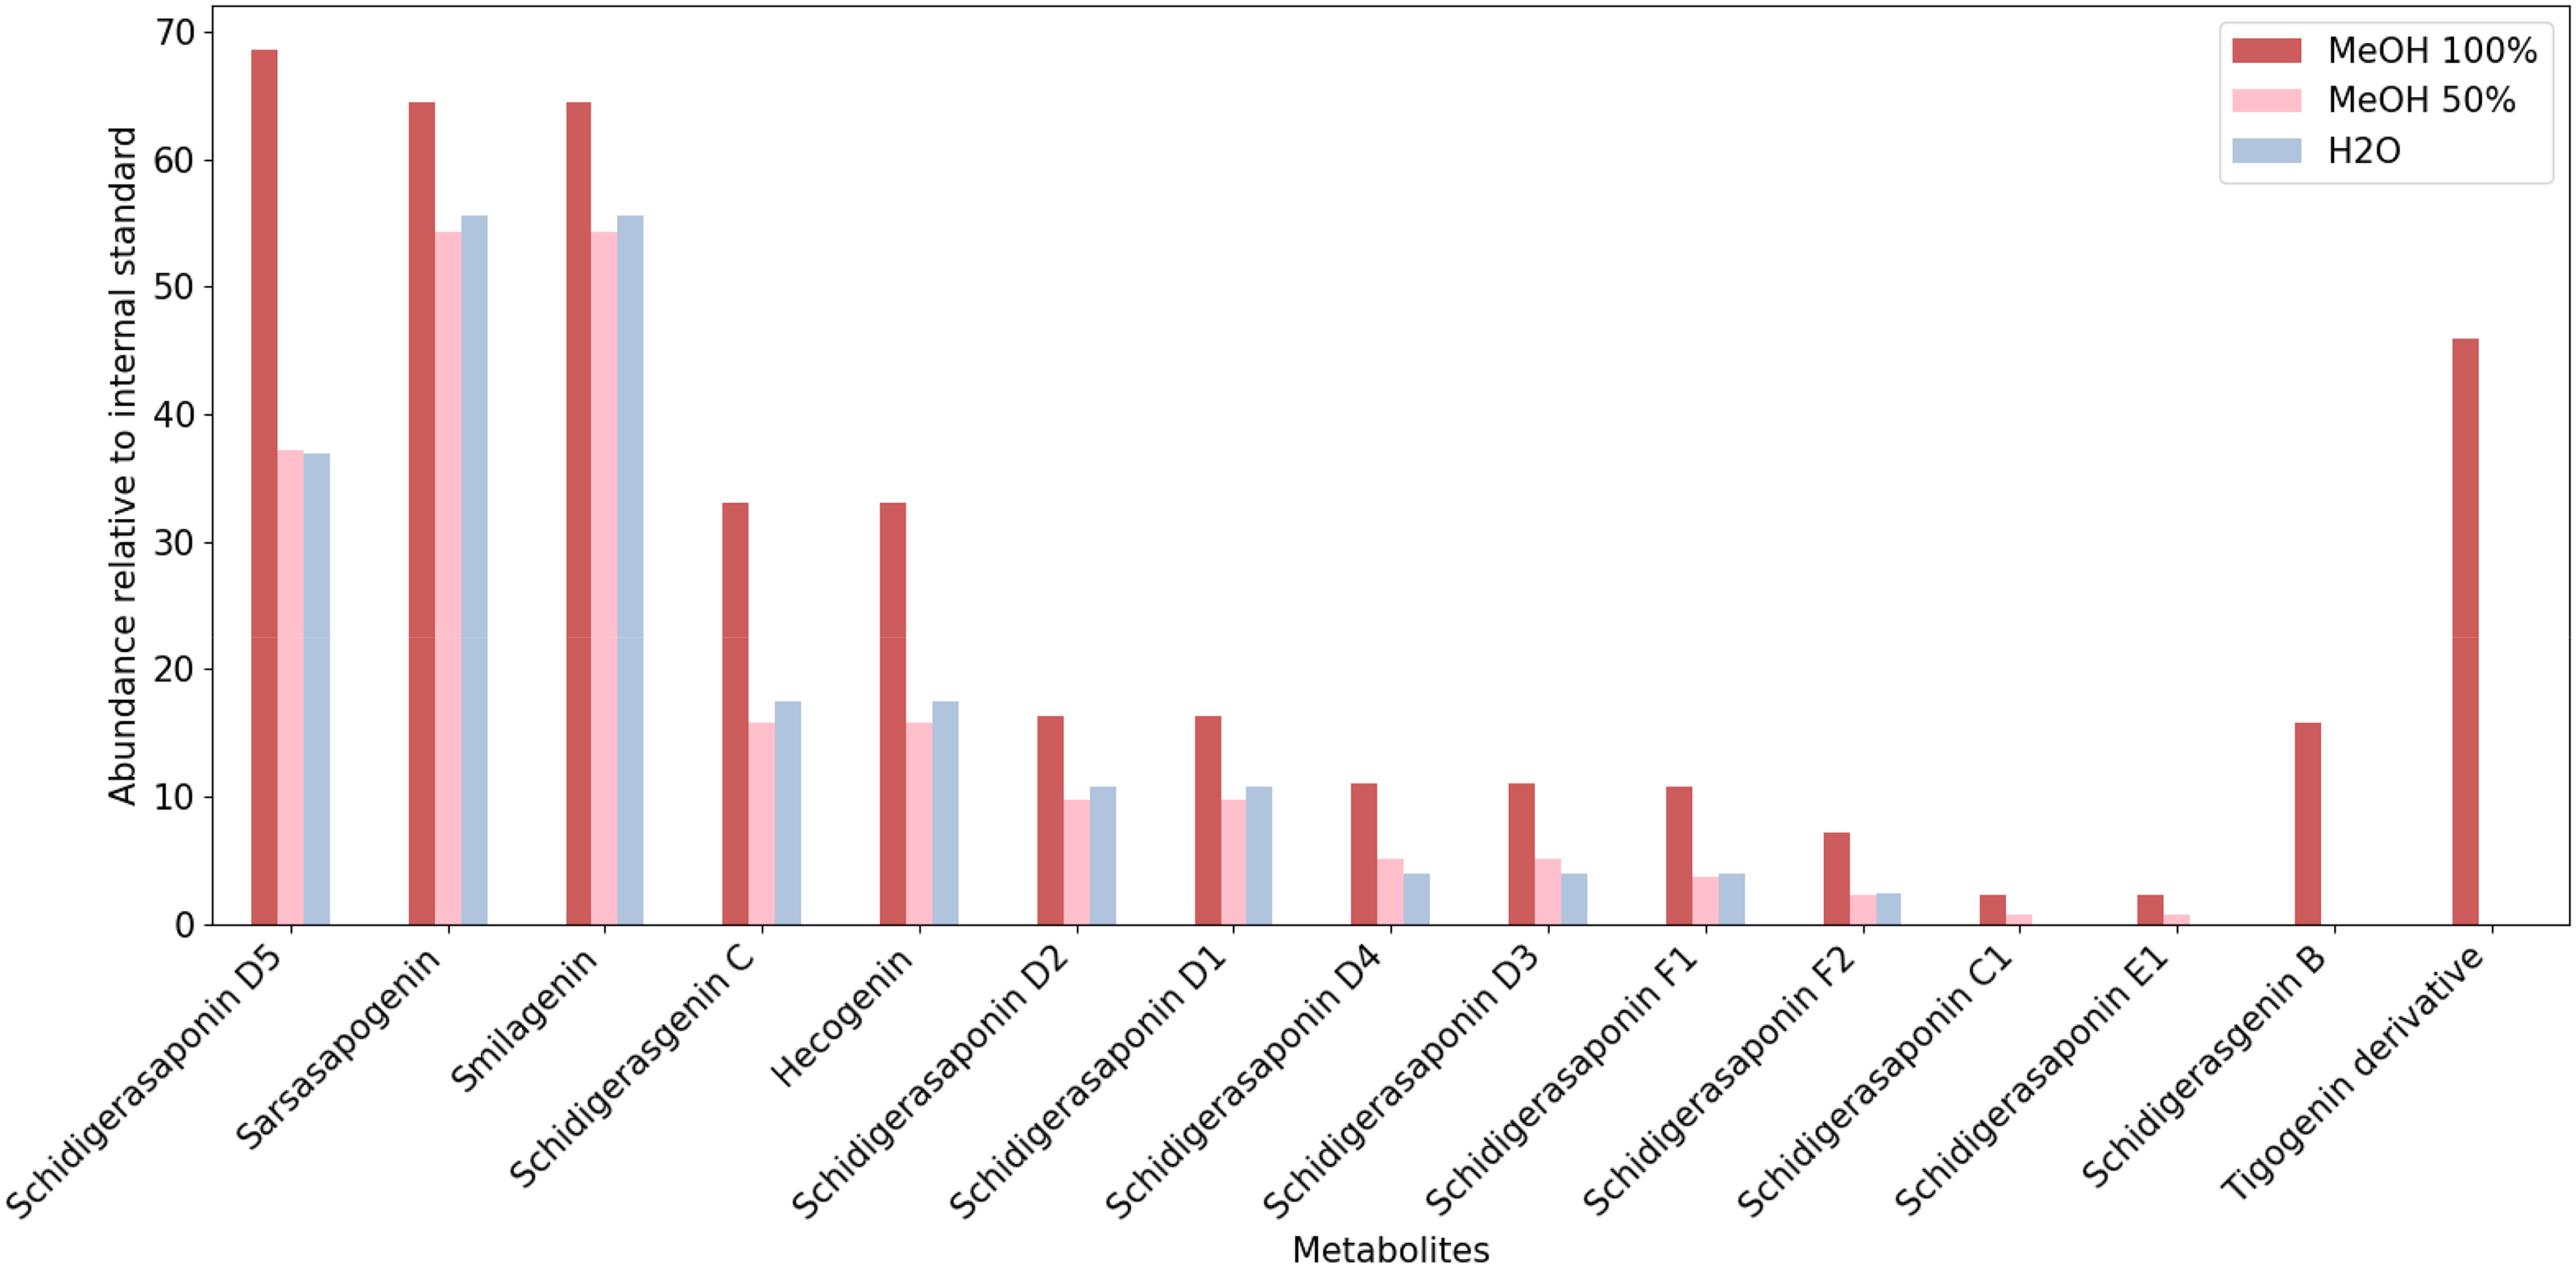
Lc–HRMS profiles of Y. schidigera extracts obtained with 100% MeOH (red), 50% MeOH (pink), and water (gray). Peak intensities were normalized to the internal standard (digoxin-d3).

Total ion chromatogram (TIC) of the Y. schidigera 100% MeOH extract. Each numbered and colored marker corresponds to a compound that is further detailed in the extracted ion chromatograms (XICs) (Supplemental Materials, Figure S1–S32).
Saponins Identified in Y. schidigera Extracts by LC–HRMS. Compounds Were Detected in 100% MeOH (A), 50% MeOH (B), and Water (C) Extracts.

1Reference standards were purchased from commercial suppliers (see Experimental section for details).
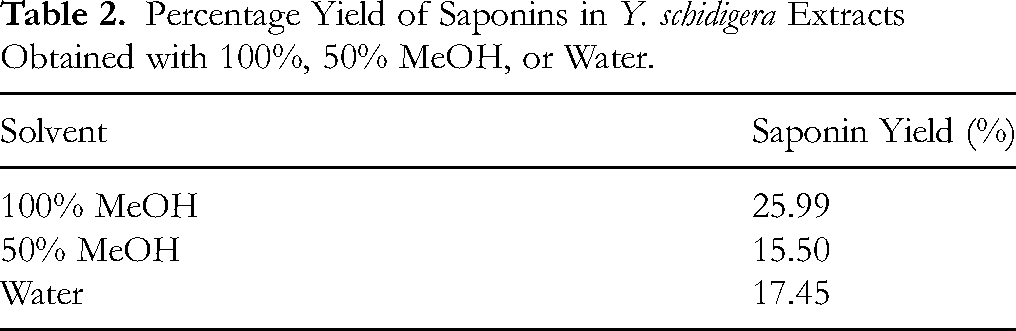
To ensure comparability between extracts, intensities were normalized using the internal standard, digoxin-d3, to obtain the relative abundance of individual compounds. The percentage yield of saponins was highest in 100% MeOH (25.99%) and almost equal between 50% MeOH and water (15.50% and 17.45%, respectively) (Table 2). Extract yield (w/w × 100%) was calculated based on dry plant weight.
Percentage Yield of Saponins in Y. schidigera Extracts Obtained with 100%, 50% MeOH, or Water.
Multivariate Analysis of Y. schidigera Extracts
The extraction profiles of the three solvents (100% MeOH, 50% MeOH, and water) were assessed using PLS-DA and OPLS-DA, which revealed differences among them, resulting in three distinct clusters—one corresponding to each solvent (Figure 3). The first latent component (PLS1) explains 95% of the total variance; the VIP scores allow us to identify the solvent that is mainly responsible for the separation. 100% MeOH is identified as the solvent that contributes most to the separation (VIP score = 1.46), while 50% MeOH and water do not contribute as much as 100% MeOH (VIP score = 0.64 and 0.68, respectively) (Figure S33).

(a) PLS-DA and (b) OPLS-DA score plots of Y. schidigera extracts obtained with different solvents: 100% MeOH (purple), 50% MeOH (pink), and water (light blue).
Antimicrobial and Anticoccidial Activity of Y. schidigera Extracts
Figure 4 reports the MIC and MBC of the Y. schidigera extracts against C. perfringens. Bacterial growth was expressed as a percentage relative to the untreated control. Results indicate a MIC of 750 ppm and MBC of 1000 ppm for extracts in MeOH 100% and MeOH 50%, while for the extract in water, no MIC value was found in the tested range.
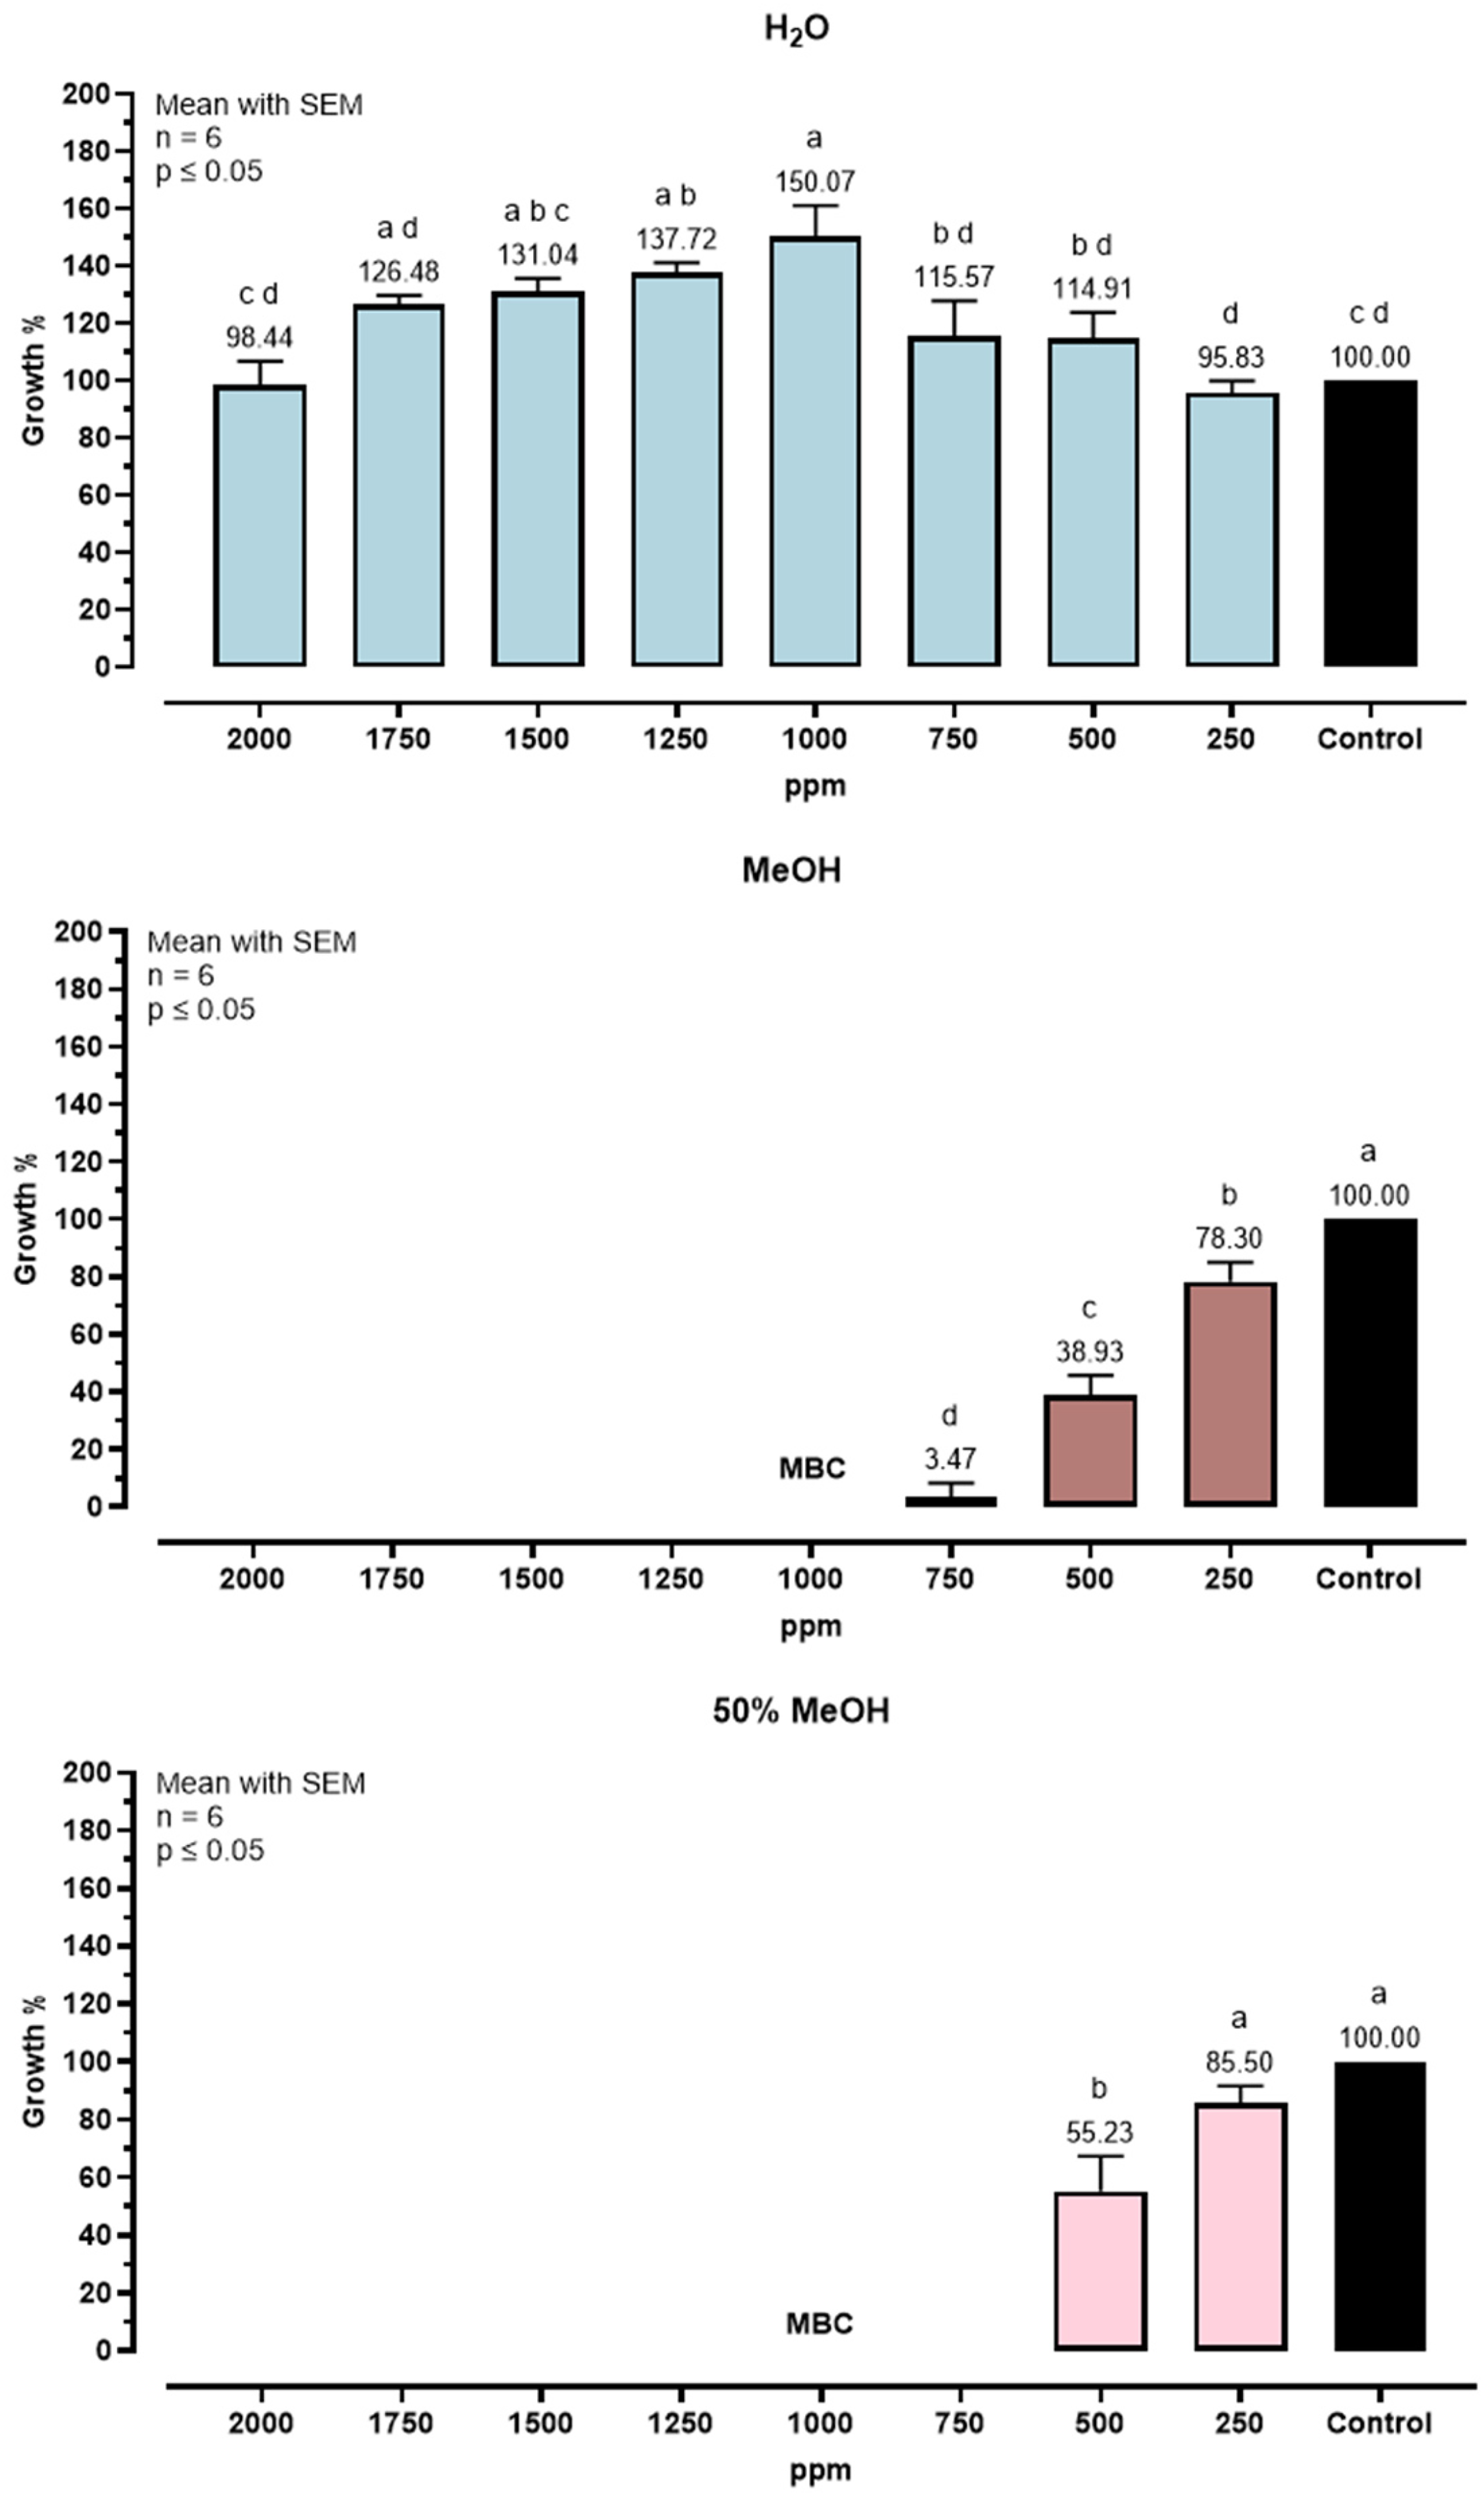
Growth inhibition of C. perfringens after 24 h exposure to Y. schidigera extracts. Data are mean ± SEM (n = 6). Different letters indicate significant differences (p ≤ 0.05).
The intracellular development of E. tenella was quantified by qPCR and expressed as a percentage relative to the untreated control at 24 h post-invasion. Figure 5 shows the percentages of invasion and replication of E. tenella in MDBK cells resulting from the development assay. At 24 h post-invasion, 100% MeOH and 50% MeOH reduced invasion of sporozoites to 62.16% and 69.03% of the untreated control, but the difference is not significant. Conversely, water reduced the invasion to 46.61%, but no significant difference within the three extracts was observed.

Intracellular development of E. tenella in MDBK cells treated with Y. schidigera extracts. Values, determined by qPCR, are expressed as a percentage of the untreated control at 24 hpi. Data are mean ± SEM (n = 8). Different letters indicate significant differences (p ≤ 0.05).
At 72 h post-invasion, significant differences emerged between treatments and control in the extracts 100% MeOH and 50% MeOH. The control shows a development percentage of 743% (compared to the value of the 24-h control), while the values observed for the treated samples are 174% for 100% MeOH, 387% for 50% MeOH, and 555% for water, with water being not different from the untreated control (Figure 5–6). Representative micrographs of MDBK cells at 72 h post-invasion are shown in Figure 6, illustrating the morphological differences in the intracellular development of E. tenella under the different treatments. Late developmental stages of the parasite are indicated by black circles.
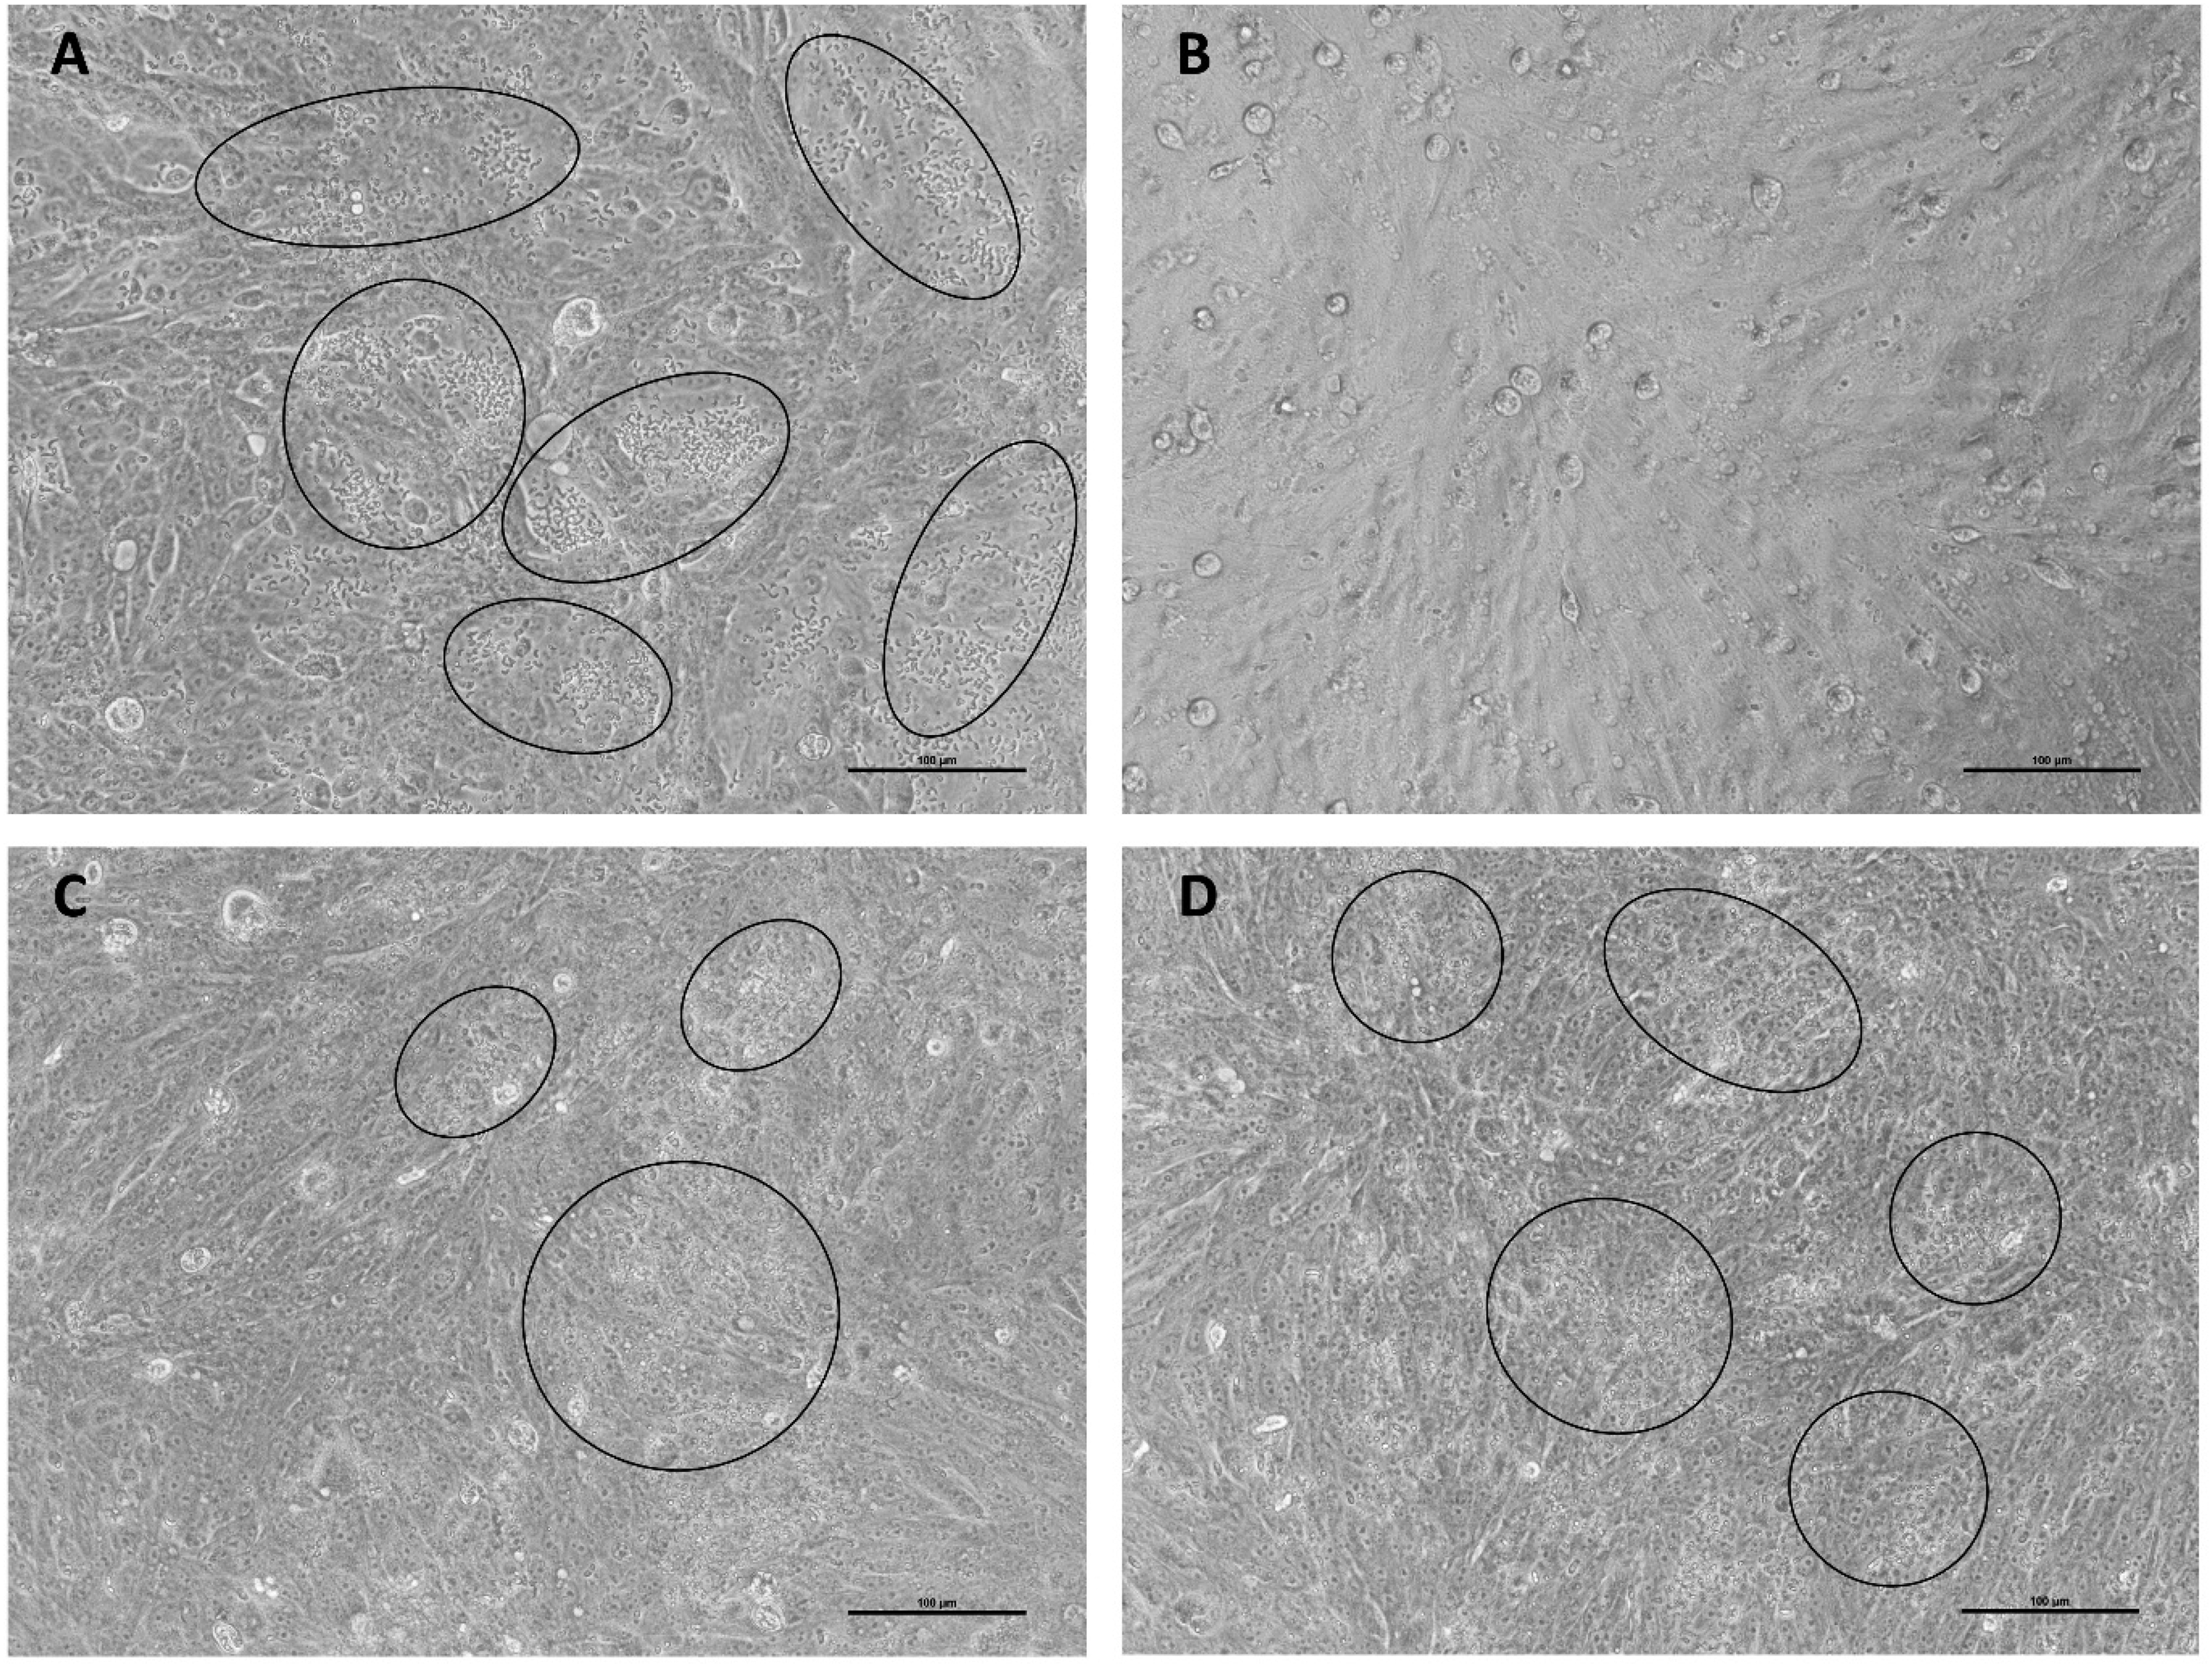
Intracellular development of E. tenella at 72 hpi (20x objective). Panel A: positive control, panel B: MeOH, panel C: MeOH 50%, panel D: water. Black circles indicate late developmental stages of the parasite (ie merozoites or mature schizonts). Size bar = 100 um.
Metabolic Profiling of Y. schidigera Fractions
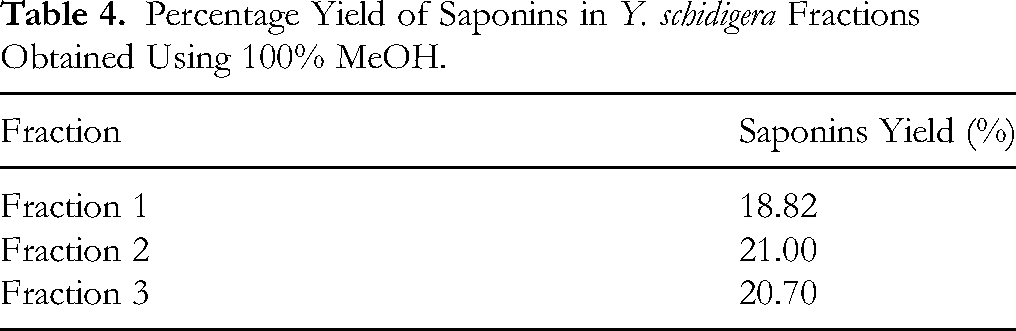
The extract in 100% MeOH was selected for further investigation, as it showed the highest inhibition of E. tenella development, was effective against C. perfringens, and contained the highest concentration of saponins according to LC-HRMS analysis. Subsequent studies aimed to identify the specific saponins responsible for the antimicrobial and anticoccidial activities of Y. schidigera extracts. After fractionation by column chromatography and LC-HRMS analysis, five fractions were collected. Three of them, referred to as fraction 1 (F1), fraction 2 (F2), and fraction 3 (F3), contained saponins (Table 3). The table reports compound names, molecular formulas, theoretical and observed masses, and normalized abundances in F1, F2, and F3. The metabolite abundances were similar for metabolites in F1 and F2, with F2 showing higher abundances, except for schidigerasaponins D3 and D4, which were more abundant in F1 (Table 3, Figure 7). The total percentage yield of F1, F2, and F3 was 18.82%, 21.00%, and 20.70%, respectively (Table 4). Yields were calculated as percentages based on the dry extract matter, showing similar extraction efficiency across the three fractions.

LC-HRMS analysis of metabolite intensities in Y. schidigera fractions: fraction 1 (blue), fraction 2 (light blue), fraction 3 (purple). Peak intensities were normalized to the internal standard (digoxin-d3).
Characterization of Saponins Identified in Y. schidigera 100% MeOH Fractions by LC-HRMS.

Percentage Yield of Saponins in Y. schidigera Fractions Obtained Using 100% MeOH.
Antimicrobial and Anticoccidial Activity of Y. schidigera Fractions
The fractions selected for biological testing were F1, F2, and F3. Bacterial growth was expressed as a percentage relative to the untreated control. The antimicrobial assay results show a MIC of 500 ppm for F1, 1000 ppm for F2, and 1500 ppm for F3 and MBC of 500 ppm for F1, 1500 ppm for F2, and 2000 ppm for F3 (Figure 8).

Growth inhibition of C. perfringens after 24 h exposure to Y. schidigera fractions. Data are mean ± SEM (n = 6). Different letters indicate significant differences (p ≤ 0.05).
The intracellular development of E. tenella was quantified by qPCR and expressed as a percentage relative to the untreated control at 24 h post-invasion. Figure 9 shows the quantification of the intracellular E. tenella after treatment with F1, F2, and F3. At 24 h post-invasion, only F1 caused a slight decrease in infection to 77%, although not significantly different from the control. At 72 h post-invasion, the parasite replication is significantly lower than the untreated control, with F1 being the lowest (118%) and the other two fractions being intermediately effective at a similar level (429.69% and 392.64%, F2 and F3, respectively).

Intracellular development of E. tenella in MDBK cells treated with Y. schidigera fractions (F1–F3). Values, determined by qPCR, are expressed as a percentage of the untreated control at 24 hpi. Data are mean ± SEM (n = 4). Different letters indicate significant differences (p ≤ 0.05).
Correlation Between Chemical Structure and Biological Activity of Saponins
To correlate the chemical structure of the saponins identified in the 100% MeOH extract with their biological activities, the intensity values of the metabolites detected in F1, F2, and F3 by LC-HRMS were correlated with antimicrobial data against C. perfringens and anticoccidial data against E. tenella. Both the correlation matrix and the ridge regression model list the same saponins as the most important ones (Figure 10–11, Figure S33-35). Higher negative coefficient values indicate a greater contribution of each metabolite to the biological effect. In particular, the saponins contributing most to the bioactivity are schidigerasaponin D3 and D4, sarsasapogenin and smilagenin, schidigerasgenin B, hecogenin and schidigerasgenin C.

Ranking of saponins from the 100% MeOH extract of Y. schidigera according to their contribution to antimicrobial activity, based on correlation and ridge regression analyses.

Ridge regression analyses correlating saponin intensities in Y. schidigera fractions with (a) antimicrobial activity against C. perfringens and (b) anticoccidial activity against E. tenella.
To evaluate the robustness of these results, a simulated scrambled dataset was generated by randomly assigning importance values to each metabolite. This simulation allowed visual assessment of feature importance in the presence or absence of an informative biological signal. As expected, the randomization caused a loss of structured feature importance, confirming that the associations observed in the ridge regression model were driven by genuine biological correlations rather than random noise (Figure 10).
Discussion
In recent years, there has been a growing global concern over the continued use of antibiotics and anticoccidial drugs in chicken feed, primarily due to their potential contribution to drug resistance. These concerns have led to increased regulatory restrictions, driving the search for natural, safe, and effective alternatives that can support animal health and productivity. Among the various natural compounds, Y. schidigera and its saponins have gained attention due to their long use in traditional medicine and livestock nutrition.7,48–50 The present study focuses on the characterization, extraction, and evaluation of the antimicrobial and anticoccidial activity of saponins derived from Y. schidigera.
LC-HRMS Investigation of Y. schidigera Extracts
To investigate the composition of each extract, LC-HRMS analysis was performed. Previously, Ruan et al 37 provided a comprehensive chemical profiling of Y. schidigera, reporting eleven spirostanol aglycones. In our study, four major aglycones were identified (sarsasapogenin, smilagenin, hecogenin, and schidigeragenin C), showing partial overlap with the literature. This difference likely reflects the high chemical complexity of Y. schidigera extracts, which makes a full structural characterization particularly challenging. 13 Such complexity, combined with variability in plant origin, processing methods, and analytical strategies, may account for the differing number of compounds reported. These aglycones were identified based on their characteristic MS/MS fragmentation patterns and authentic standards.
Among the 15 saponins identified in Y. schidigera extracts, we selected four representative pairs of isomers for detailed discussion — the aglycones sarsasapogenin and smilagenin, hecogenin and schidigeragenin C, and the glycosides schidigerasaponins D3 and D4. These compounds were chosen as representative examples because they exhibited the most characteristic and interpretable fragmentation patterns and included both free aglycones and glycosylated derivatives, thus covering the main structural features of Y. schidigera saponins. All additional MS/MS interpretation details, including proposed fragmentation mechanisms and diagnostic fragment rationalization for the remaining compounds, are provided in the Supplementary Information, together with extracted ion chromatograms (XIC) and MS/MS spectra (Figures S1–S32).
The diastereoisomers sarsasapogenin and smilagenin exhibited highly similar fragmentation spectra, with shared diagnostic ions at m/z 417.3, 399.3 ([M–H2O]+, −18 Da), 285.3 (loss of [M–C6H10O2+H]+, −114 Da), 273.2, and 255.2 ([M–2H2O]+, −36 Da). However, the relative intensities of these fragments allowed differentiation: smilagenin showed a more intense signal at m/z 255.2, while sarsasapogenin exhibited a more prominent peak at m/z 273.2. Likewise, the structural isomers hecogenin and schidigeragenin C produced identical fragments, including m/z 431.3 (base peak), 413.3, and 395.3 (both corresponding to sequential [M–H2O]+ losses), as well as m/z 292.2 and 281.2. Their relative intensities were distinct: hecogenin showed a higher intensity at m/z 395.3 compared to 413.3, whereas in schidigeragenin C, the fragment at m/z 413.3 was more intense than that at m/z 395.3. These differences in fragmentation intensity are consistent with subtle structural variations between the isomers, which can influence the stability and formation of specific fragment ions during collision-induced dissociation (CID).
In addition to the aglycones, nine glycosylated derivatives were identified, including various schidigerasaponins (D1/D2, D3/D4, D5, F1, F2, E1/C1) and a tigogenin-based saponin. As no glycoside reference standards were available, structural identification relied on MS/MS fragmentation patterns compared with literature data.28,37,41 This approach enabled the reconstruction of glycosylation patterns through the observation of sequential losses—[M–C6H10O5]+ (–162 Da, hexose loss), [M–C5H8O4]+ (–132 Da, pentose loss), and [M–H2O]+ (–18 Da)—leading to diagnostic aglycone fragments.
Schidigerasaponins D3/D4 (m/z 903.5), selected as representative examples, exhibited fragmentation patterns consistent with a smilagenin-type backbone. Specifically, D3/D4 underwent successive losses of three hexose units ([M–3C6H10O5]+), yielding fragment ions at m/z 741.4, 579.4, and 417.4, followed by characteristic cleavages to m/z 273.2 ([M–C8H16O2+H]+) and 255.2 ([M–H2O]+). The higher intensity of the fragment at m/z 255.2 compared to 273.2 supports the presence of a smilagenin aglycone. Fragment ion intensities were evaluated qualitatively to aid structural interpretation, and the correspondence between glycosylated and free aglycones was supported by comparison with authentic standards.
Overall, metabolite identification was supported by MS/MS spectra and retention times. Reference standards confirmed the identification of sarsasapogenin, smilagenin, hecogenin, and schidigerasaponin F2, while other compounds were assigned based on literature elution data.28,37 The elution order correlated with compound polarity, with more polar glycosylated saponins eluting before their less polar aglycones. The degree of glycosylation influenced retention behavior, making chromatographic separation a valuable complement to MS/MS-based identification, particularly for distinguishing isomeric species. Nevertheless, partial co-elution of closely related peaks — such as D1/D2 and D3/D4 — highlights the chemical complexity of the extract and the analytical limitations under the applied conditions (Tables 2–4, Supplementary Figures S1–S32).
In contrast to the findings reported in the literature, this study identified 15 saponins, while Ruan et al found 110 saponins in Y. schidigera, 37 and El Sayed et al found 10 saponins in Yucca spp. 28 Skhirtladze et al found 12 saponins in Yucca gloriosa, 21 and Falev et al found 33 saponins in different Yucca spp. 26 This discrepancy may reflect the inherent variability of the plant,12,25 as the composition can differ depending on the plant part used and the processing method (such as powder vs syrup form). 25 Additionally, intrinsic variations within the plant itself may contribute to these differences. For this reason, a thorough characterization of the extract composition and the correlation with the biological activity is critical to optimize plant-based feed additives with a potent action against specific targets.
Solvent Selection and Biological Investigation
The characterization of the Y. schidigera extracts began with the generation of their metabolic profiles, followed by a comparative analysis using PLS-DA20,48 to assess the influence of the extraction solvent on the metabolite profile. The multivariate analysis separated the three extracts according to the solvent used, with 100% MeOH producing the most distinct and extensive cluster, while 50% MeOH and water extracts showed more similar profiles. This was consistent with the quantitative evaluation of extraction efficiency, which revealed that 100% MeOH yielded the highest saponin content (25.99%), followed by 50% MeOH (15.50%) and water (17.45%). VIP scores further confirmed that 100% MeOH was the main factor driving the observed separation, underscoring its greater efficiency in extracting saponins. Nevertheless, the 50% MeOH and water extracts still contained bioactive compounds of interest that are less efficiently extracted compared to pure MeOH. The differences in the metabolic profiles among the solvents suggest that each solvent preferentially extracts distinct classes of metabolites, which may be relevant for further studies targeting other bioactive components in Y. schidigera.
The biological activities of the crude extracts were subsequently evaluated. Both the 100% and 50% MeOH extracts demonstrated significant antimicrobial activity against C. perfringens (MIC = 750 ppm), in agreement with previous reports describing the antimicrobial properties of plant-derived saponins. 10 Interestingly, the comparable activity of the 50% MeOH extract, despite its lower overall saponin content, suggests the possible contribution of additional bioactive compounds. Conversely, the 100% MeOH extract exhibited the highest anticoccidial activity against E. tenella, supporting the hypothesis that saponins are major contributors to the antiparasitic effects of Y. schidigera. 10 The correlation between the higher saponin concentration in the 100% MeOH extract and its superior anticoccidial efficacy further reinforces the selection of 100% MeOH as the preferred extraction solvent for these bioactive molecules.
To better characterize the specific saponins responsible for the observed biological activities, the 100% MeOH extract was fractionated. The resulting fractions were analyzed by LC-HRMS and tested for antimicrobial and anticoccidial effects. LC-MS profiles revealed that the three fractions were qualitatively similar to the crude extract and each other, although quantitative differences in metabolite intensities were evident. Fractions 1 and 2 displayed particularly similar profiles, while fraction 3 showed a marked reduction in overall metabolite intensity. Notably, schidigerasaponins D3 and D4 were more abundant in fraction 1 compared to fraction 2, whereas other metabolites were more concentrated in fraction 2.
Biological testing of the fractions revealed a dose-dependent trend, with fraction 1 being the richest in saponins and exhibiting the highest activity against both C. perfringens and E. tenella. These findings further support the role of saponins in the observed bioactivities, confirming results observed by previous studies conducted in vivo. 51 Bafundo et al found that supplementation of Quillaja and Y. shidigera mixtures can lower the oocyst excretion in broilers infected with Eimeria spp. and improve significantly their growth performance. 7 In another study, they observed a significant reduction in the number of fecal Clostridia in broiler farms subject to recurrent necrotic enteritis outbreaks, leading to performance improvements and decreased mortality. 52 Additionally, the ability of Y. schidigera extracts to mitigate the adverse effects of C. perfringens infection has been reported in laying hens. 11
The anticoccidial mechanism of saponins is supposed to involve their interaction with cell membranes. 8 It has been documented that saponins can form pores in membranes by interacting with sterols, such as cholesterol, leading to the formation of insoluble complexes or micellar aggregates. 8 A previous study highlighted that saponins might boost the anticoccidial action of other compounds such as terpenes, suggesting a potential synergistic interaction with other botanical molecules. 9
Although the exact mechanism of action of saponins against bacterial populations is not yet fully understood,7,8 it is known that saponins initiate cytotoxic effects through nonspecific mechanisms, including the promotion of cell aggregation due to their surfactant properties. 8 The amphiphilic nature of saponins, characterized by both hydrophilic and lipophilic components, 7 likely enables them to disrupt bacterial membranes, impairing their structural integrity and function. Studies in ruminants have shown that Yucca saponins can selectively impact specific bacterial populations, such as cellulolytic bacteria, while sparing others, suggesting potential selectivity or variable sensitivity among microbial species. 8
To identify the key active compounds responsible for the observed bioactivities, correlation analysis and ridge regression modeling were performed, 36 linking metabolite abundances in the fractions to their respective MIC and development percentage values. Both approaches consistently identified schidigerasaponins D3 and D4 as the main contributors to both antimicrobial and anticoccidial activities, followed by sarsasapogenin, smilagenin, schidigerasaponin B, hecogenin, and schidigerasaponin C. The prominent role of schidigerasaponins D3 and D4, which feature a sarsapogenin aglycone linked to three glucose units, highlights the importance of specific glycosylation patterns for bioactivity and suggests potential synergistic effects between the sugar moieties and the aglycone.
This observation is consistent with existing literature, which emphasizes the critical role of the sugar moiety and glycosylation in modulating membrane-permeabilizing and hemolytic activities of saponins. 8 For example, hydrolysis of sugar residues has been shown to abolish the membrane-permeabilizing activity of certain saponins. 8 Furthermore, the stereochemistry of terminal sugars and the presence of mono versus bidesmosidic structures can significantly influence biological activity, with aglycones and bidesmosidic forms often displaying reduced or absent activity. 8 These findings suggest that the presence and specific structure of the sugar chains are essential for the effective interaction of saponins with biological targets, including E. tenella and C. perfringens membranes. 8
Although our results reveal clear associations between specific saponins and the observed bioactivities, the structure–activity patterns obtained from correlation and regression analyses remain predictive and require validation with purified metabolites. Because neither aglycones nor glycosylated saponins were isolated at sufficient purity for individual testing, synergistic effects or a greater-than-expected contribution of aglycones cannot be excluded. Moreover, because all assays were performed in vitro, the effective concentrations may not fully reflect in vivo conditions, underscoring the need for subsequent validation under practical production settings.
Conclusion
In conclusion, our results strengthen the evidence that Y. schidigera saponins are promising candidates for controlling coccidiosis and necrotic enteritis. They demonstrated dose-dependent efficacy against E. tenella, direct antibacterial activity against C. perfringens, and a critical role of glycosylation in mediating biological activity. By linking saponin chemical structure to biological function, our study provides a framework for predicting structure–activity relationships and supports the rational standardization and optimization of Y. schidigera extracts for animal health applications. The identification of key bioactive saponins further underlines their potential as natural alternatives to conventional therapeutics in poultry. Future in vivo studies under practical farming conditions are warranted to validate these findings and establish effective dosing strategies.
Supporting Information
The following supporting information are provided: detailed fragmentation patterns and compound characterization of all saponins and aglycones detected in Y. schidigera extracts. Figure S1: chromatogram of schidigerasaponin D4 and D3. Figure S2: chromatogram of tigogenin derivative. Figure S3: chromatogram of schidigerasaponin E1 and C1. Figure S4: chromatogram of schidigeragenin C and hecogenin. Figure S5: chromatogram of schidigerasaponin F1. Figure S6: chromatogram of schidigerasaponin F2. Figure S7: chromatogram of schidigerasaponin D2 and D1. Figure S8: chromatogram of schidigerasaponin D5. Figure S9: chromatogram of schidigeragenin B. Figure S10: chromatogram of smilagenin and sarsasapogenin. Figure S11: chromatogram of schidigerasaponin F2 reference standard. Figure S12: chromatogram of hecogenin reference standard. Figure S13: chromatogram of smilagenin reference standard. Figure S14: chromatogram of sarsasapogenin reference standard. Figure S15: mass spectrum of schidigerasaponin D4 and D3. Figure S16: mass spectrum of tigogenin derivative. Figure S17: mass spectrum of schidigerasaponin E1. Figure S18: mass spectrum of schidigerasaponin C1. Figure S19: mass spectrum of schidigeragenin C. Figure S20: mass spectrum of hecogenin. Figure S21: mass spectrum of Schidigerasaponin F1. Figure S22: mass spectrum of schidigerasaponin F2. Figure S23: mass spectrum of schidigerasaponin D2. Figure S24: mass spectrum of Schidigerasaponin D1. Figure S25: mass spectrum of schidigerasaponin D5. Figure S26: mass spectrum of schidigeragenin B. Figure S27: mass spectrum of smilagenin. Figure S28: mass spectrum of sarsasapogenin. Figure S29: mass spectrum of schidigerasaponin F2 reference standard. Figure S30: chromatogram of hecogenin reference standard. Figure S31: chromatogram of smilagenin reference standard. Figure S32: chromatogram of sarsasapogenin reference standard. Figure S33: VIP scores from PLS–DA of Y. schidigera extracts obtained with the different solvents. Figure S34: Correlation matrix between saponin intensities and antimicrobial activity of Y. schidigera fractions. Figure S35: Correlation matrix between saponin intensities and anticoccidial activity of Y. schidigera fractions.
Supplemental Material
sj-docx-1-npx-10.1177_1934578X251412198 - Supplemental material for LC–HRMS Identification of Yucca schidigera Saponins and Correlation with Antimicrobial and Anticoccidial Properties
Supplemental material, sj-docx-1-npx-10.1177_1934578X251412198 for LC–HRMS Identification of Yucca schidigera Saponins and Correlation with Antimicrobial and Anticoccidial Properties by Maria Federica Marchesi, Martina Felici, Jaewoo Choi, Teresa Gazzotti, Roberta Majer, Benedetta Tugnoli, Ester Grilli and Jan F. Stevens in Natural Product Communications
Footnotes
Acknowledgment
The work was supported by Vetagro S.p.A, and College of Pharmacy, Oregon State University, USA (JFS).
ORCID iDs
Author Contributions
R.M, T.G, B.T, E.G, and J.F.S: Conceptualization, supervision, writing–review, and editing; M.F.M, J.C, M.F: Investigation, methodology, validation, and formal analysis; M.F.M, M.F: Writing original draft. All authors: Writing–review, and editing; J.F.S, E.G.: Funding acquisition.
Funding
The authors disclosed receipt of the following financial support for the research, authorship, and/or publication of this article: This work was supported by Vetagro S.p.A, and College of Pharmacy, Oregon State University, USA (JFS).
This research was funded by Vetagro S.p.A. and Oregon State University and the U.S. National Institutes of Health (Grant no. S10 RR027878).
Declaration of conflicting interests
The authors declared the following potential conflicts of interest with respect to the research, authorship, and/or publication of this article: Ester Grilli serves as an assistant professor at the University of Bologna and is a member of the board of directors of Vetagro, Inc. Roberta Majer, Martina Felici, and Benedetta Tugnoli are employed at Vetagro S.p.A. The remaining authors declare that research was conducted in the absence of any commercial or financial relationships that could be construed as a potential conflict of interest
Supplemental Material
Supplemental material for this article is available online.
References
Supplementary Material
Please find the following supplemental material available below.
For Open Access articles published under a Creative Commons License, all supplemental material carries the same license as the article it is associated with.
For non-Open Access articles published, all supplemental material carries a non-exclusive license, and permission requests for re-use of supplemental material or any part of supplemental material shall be sent directly to the copyright owner as specified in the copyright notice associated with the article.