
Abstract
Objective:
In this study, the impact of geniposide on the growth of quercetin nanowires was systematically investigated. Subsequently, quercetin nanorods with reduced particle size were synthesized.
Methods:
A comprehensive characterization approach, including scanning electron microscopy, Transmission electron microscopy, X-ray powder diffractometry, Fourier transform infrared spectroscopy, ultraviolet spectrum, fluorescence spectroscopy, Raman spectroscopy, molecular docking, and molecular dynamics simulations, was employed to elucidate the morphology and growth mechanisms of the prepared quercetin nanowires.
Results:
Microscopic observations revealed that geniposide can modulate the crystal morphology of quercetin. Spectral analysis and molecular simulation elucidated the interaction between quercetin and geniposide, leading to a proposed mechanism for the growth process of quercetin nanowires in the presence of geniposide. Experimental data demonstrated that the prepared quercetin nanorods exhibit enhanced 1,1-diphenyl-2-picrylhydrazyl radical scavenging activity and improved in vitro release characteristics compared to quercetin raw material.
Conclusion:
Under the influence of geniposide, quercetin exhibits a directional growth trend, ultimately forming high aspect ratio crystals. Moreover, during the crystallization process, gardenoside modifies the crystal structure without altering its composition, facilitating the formation of quercetin crystals with superior performance and purity.
Introduction
Quercetin (QUE) is a flavonoid compound widely found in traditional Chinese medicine (TCM), fruits, and vegetables. QUE exerts various pharmacological properties such as anticancer, 1 anti-inflammatory, 2 and antioxidant activity 3 ; however, it belongs to BCS IV drugs, which have low solubility and low penetration. 4 Using nano-formulation technologies, such as nanomicelles, 5 composite nanoparticles, 6 nanoemulsions, 7 and nanocrystals, 8 can solve the above problems. Nanocrystals have attracted wide attention among these technologies due to their high drug-carrying capacity. The preparation methods of QUE nanocrystals include high-pressure homogenisation, 9 wet milling, 10 thin film hydration, 11 etc. However, most previous studies have focused on applying macromolecule stabilizers and physical pulverization methods, with fewer reports focusing on the modulation of the growth of nanostructures from the perspective of interactions of active ingredients of TCM.
Nanostructures formed through the self-assembly of active compounds from TCM are widely regarded as the material foundation for elucidating the efficacy of TCM preparations. Investigating the interactions between these active compounds can facilitate the development of nanomedicines with enhanced properties. Existing studies indicate that QUE molecules exhibit tight packing via π-π interactions, and hydrogen bonds form between QUE molecules and solvent molecules, promoting interactions among polar groups. 12 The intramolecular hydrogen bonds within QUE play a crucial role in maintaining the planarity of its crystal structure, 13 wherein the C5-OH exhibits a pronounced tendency to form strong intra-molecular hydrogen bonds with the carbonyl group. 14 QUE possesses five hydroxyl groups, which function as both hydrogen bond donors and acceptors, along with two other hydrogen bond acceptors i.e. aromatic cyclic oxygen and keto group. 15 Due to its structural characteristics, QUE readily forms hydrogen bonds with hydroxy-rich compounds. Geniposide (Gen), a glycoside compound with multiple hydroxyl groups, is one of the primary active ingredients in Mongolian medicine Sendeng-4, alongside QUE. 16 The crystalline morphology of QUE is influenced by various factors, including hydration structure, 17 solvent, and additives. 18 Previous research has demonstrated that Gen influences the crystallization rate of QUE. In the presence of Gen, the directional growth trend of QUE crystals was significantly enhanced, and this stacking characteristic is closely associated with the final acicular morphology. 19 This distinct morphological change serves as a basis for further investigation into the growth mechanisms of QUE crystals under Gen influence. In the field of nanomaterials, computer simulation tools significantly enhance our understanding and predictive capabilities regarding self-assembly properties, molecular interactions, and the biological functions of drugs. 20 Consequently, the comprehensive study combining computational simulations and experimental investigations has been conducted to elucidate the detailed mechanisms of these interactions.
Particle size control is very important for the quality control of drug crystals, but there is no report on the use of interaction between the active substances of TCM to regulate the particle size of QUE crystals. Therefore, the aim of this study was to elucidate the growth mechanism of QUE nanowires (QUE-NWs) under the intervention of geniposide, characterize the obtained QUE-NWs in vitro, and further prepare monodisperse QUE nanorods (QUE-NRs) with uniform particle size by ultrasonic method. The dissolution performance and the 1,1-diphenyl-2-picrylhydrazyl (DPPH) scavenging activity of QUE-NRs and QUE were compared in vitro. Exploring the interaction between the active ingredients of TCM may provide a new method for the preparation of insoluble drug nanocrystals.
Materials and Methods
Materials and Instruments
Geniposide (90%, Green Sea Treasury Biological Technology Co., Ltd), Quercetin (97.97%, Bide Pharmatech Co., Ltd), anhydrous ethanol (Jindong Tianzheng), 96-well enzyme labeling plate (Corning Inc.), and DPPH (TCI Shanghai) were utilized. All reagents were used as received without further purification, and distilled water was employed in all experiments.
Centrifuge (CATTE INDUSTRY CO.,LTD TG16B), Scanning Electron Microscope (Nova NanoSEM 450), Transmission Electron Microscope (JEM-2100), X-ray Diffractometer (SHIMADZU XRD-6100), Raman Spectrometer (RFS-100), Fluorescence Spectrophotometer (SHIMADZU RF-5301PC), Enzyme Labeller (SpectraMax® i3x), Ultrasonic Cell Pulveriser (JY88-IIN), Fourier Transform Infrared Spectrometer (SHIMADZU IRAffinity-1), Dual-beam UV-Vis Spectrophotometer (Meipuda Instrument Co., Ltd P9), Laser Particle Sizer (HORIBA SZ-100V2), VacuumFreeze Dryer (Shanghai Sheyan Instrument Co., Ltd SR-A10N-50).
Preparation of QUE-NWs and QUE-NRs
Preparation of QUE-NWs
QUE 8.0 mg·mL−1 anhydrous ethanol solution and 8.0 mg·mL−1 Gen aqueous solution were prepared. A total of 5 mL of QUE anhydrous ethanol solution was added to 5 mL of Gen aqueous solution under stirring, centrifuged for 5 min at 16000 r·min−1, after which the precipitate was washed twice by adding distilled water, then pre-frozen at −20 °C for 12 h, and freeze-dried for 24 h to obtain the QUE-NWs.
Preparation of QUE- NRs
QUE 9.8 mg·mL−1 anhydrous ethanol solution and 0.22 mg·mL−1 Gen aqueous solution were prepared, and 1 mL of QUE anhydrous ethanol solution was added into 12 mL of Gen aqueous solution under ultrasonication (200 W, 5 min), and centrifuged for 5 min at 16,000 r·min−1. Next, the precipitates were washed by adding distilled water for two times, pre-frozen at −20 °C for 12 h, and freeze-dried for 24 h to obtain QUE-NRs.
FTIR Measurements
A Fourier Transform Infrared Spectrometer was used for the infrared analysis of QUE samples. The prepared QUE and QUE-NWs were placed on the ATR sample table. The spectrum scanning range was 4000–400 cm−1 with a resolution of 4 cm−1.
XRD Analysis
Measurements of QUE and QUE-NWs were carried out using an X-ray diffractometer (Cu-Kα radiation), graphite monochromator, and scintillation counter.
UV Analysis
Equal concentrations of Gen ethanol solution and QUE ethanol solution were prepared, and 1.5 mL of the sample solution was taken in the cuvette, respectively. Next, the UV absorption spectra of the mixed solutions in the wavelength range of 200–800 nm were determined by a UV spectrophotometer.
Fluorescence Spectroscopy
QUE was dissolved in anhydrous ethanol at a concentration of 100 μg·mL−1 and diluted to a QUE solution at a concentration of 10 μg·mL−1 with a distilled water solution containing 30% ethanol. Next, the Gen of different qualities was added to prepare a mixed solution with a mass ratio of 3:1, 2:1, 1:1, 1:2, and 1:3. Fluorescence emission spectra were recorded at 375 nm excitation wavelength. Both excitation and slit emission slits were 10.0 nm.
Raman Spectroscopy
Appropriate amounts of QUE and QUE-NWS were taken and placed on a Raman spectrometer for detection. The sample excitation laser power was 40 mW, the spectral resolution was 6 cm−1, the scanning range was 0–4000 cm−1, and the integration time for each grating position was 40 s.
Molecular Docking
The Autodock program was used to perform docking operations on QUE and Gen, and the most optimal result from the docking results was selected.
Molecular Dynamics (MD) Simulations
The Sobtop program was utilized to generate force field parameter files for QUE and Gen, employing the GAFF force field for both QUE and Gen, 21 while the TIP3P model was adopted for water molecules. 22 Using Gromacs 2023.3 software, 23 a cubic simulation box with dimensions of 8 × 8 × 8 nm³ was constructed. Two types of molecules were introduced into the box according to a mass ratio of QUE:Gen = 3.75:1, resulting in the addition of 48 QUE molecules and 10 Gen molecules, which were initially randomly distributed within the box. Subsequently, the box was filled with water molecules to solvate the system, yielding a total of 50,460 atoms.
All kinetic simulations were conducted using Gromacs2023.3. 23 Following energy minimization and pre-equilibration under NVT and NPT ensembles, a 100 ns molecular dynamics simulation was conducted. The simulation parameters were set as follows: the steepest descent method (Steep) was employed for energy minimization with a tolerance of 1000 kJ/mol/nm, followed by pre-equilibration simulations under NVT and NPT conditions for 100 ps at a temperature of 298.15 K (25 °C). Temperature coupling was achieved using the V-rescale thermostat, 24 and pressure coupling was managed by the C-rescale barostat, 25 with the pressure set to 1 bar. Long-range van der Waals interactions were truncated at 10 Å, and electrostatic interactions were treated using the particle-mesh Ewald method. 26 Production simulations were conducted with a time step of 2 fs, and trajectory snapshots were saved every 10 ps. Visualization of the trajectories was performed using VMD, 27 and interaction details were rendered using PyMOL software. 28 Periodic boundary conditions were applied in all three spatial directions, including the x, y, and z directions. Electrostatic potential energy profiles of the two molecules were mapped using the Multiwfn 3.8 program 29 and visualized with VMD. 28
In Vitro Antioxidant Experiment
A DPPH ethanol solution (40 μg·mL−1) was prepared and placed in a brown bottle for later use. Then, 10, 20, 30, 40, 50 μg·mL−1 QUE-NRs suspension, QUE, and vitamin C solution were prepared with distilled water. The above three solutions with different concentrations of 50 μL were mixed with 150 μL DPPH solution, and the absorbance was measured at 517 nm with an enzyme label after the reaction at room temperature for 30 min and was recorded as A1. Under the same measurement conditions, DPPH was replaced by anhydrous ethanol as the control, which was recorded as A2. The solution to be measured was replaced with distilled water, denoted A0.

Evaluation of Release In Vitro
The in vitro release characteristics of QUE-NRs prepared using the dialysis bag method were investigated. Accurately weighed 1 mg of QUE-NRs was placed into a pre-treated dialysis bag with a molecular weight cut-off of 7000 Da, followed by the addition of 2 mL of release medium. The release media used were PBS at concentrations of 0.01 M and pH values of 1.2, 6.8, and 7.4, each containing 1% Tween 80. An equal amount of raw quercetin material was also placed in another dialysis bag with 2 mL of the same release medium. Both dialysis bags were then immersed in conical flasks containing 20 mL of the respective release media and incubated in a thermostatic shaker at 37 ± 0.5 °C with a shaking speed of 100 rpm. At predetermined time intervals (0.5, 1, 2, 4, 6, 8, 10, 12, and 24 h), 1 mL of the dialysate was collected, and an equal volume of fresh release medium was added to maintain isothermal conditions. The cumulative release rate was determined using HPLC. The in vitro release behavior was analyzed, and the release curve was plotted with time on the x-axis and cumulative release percentage on the y-axis.
Statistical Analysis
The data were analyzed using variance analysis through IBM SPSS Statistics 25 software. Comparisons were conducted using the Least Significant Difference (LSD) and Waller-Duncan tests. A p-value of 0.05 or less was considered statistically significant.
Results
QUE Crystal Characterization
Crystal Appearance
SEM images show the morphology of the Gen-assisted prepared QUE crystals (Figure 1a), whose surface shows tightly aligned QUE-NWs, which is different from the smooth surface of the QUE (Figure S1). The QUE-NWs have an elongated morphology with a uniform width, and the aspect ratio reaches more than 300. The QUE-NWs are closely aligned with each other and constitute QUE needle-like microcrystals.
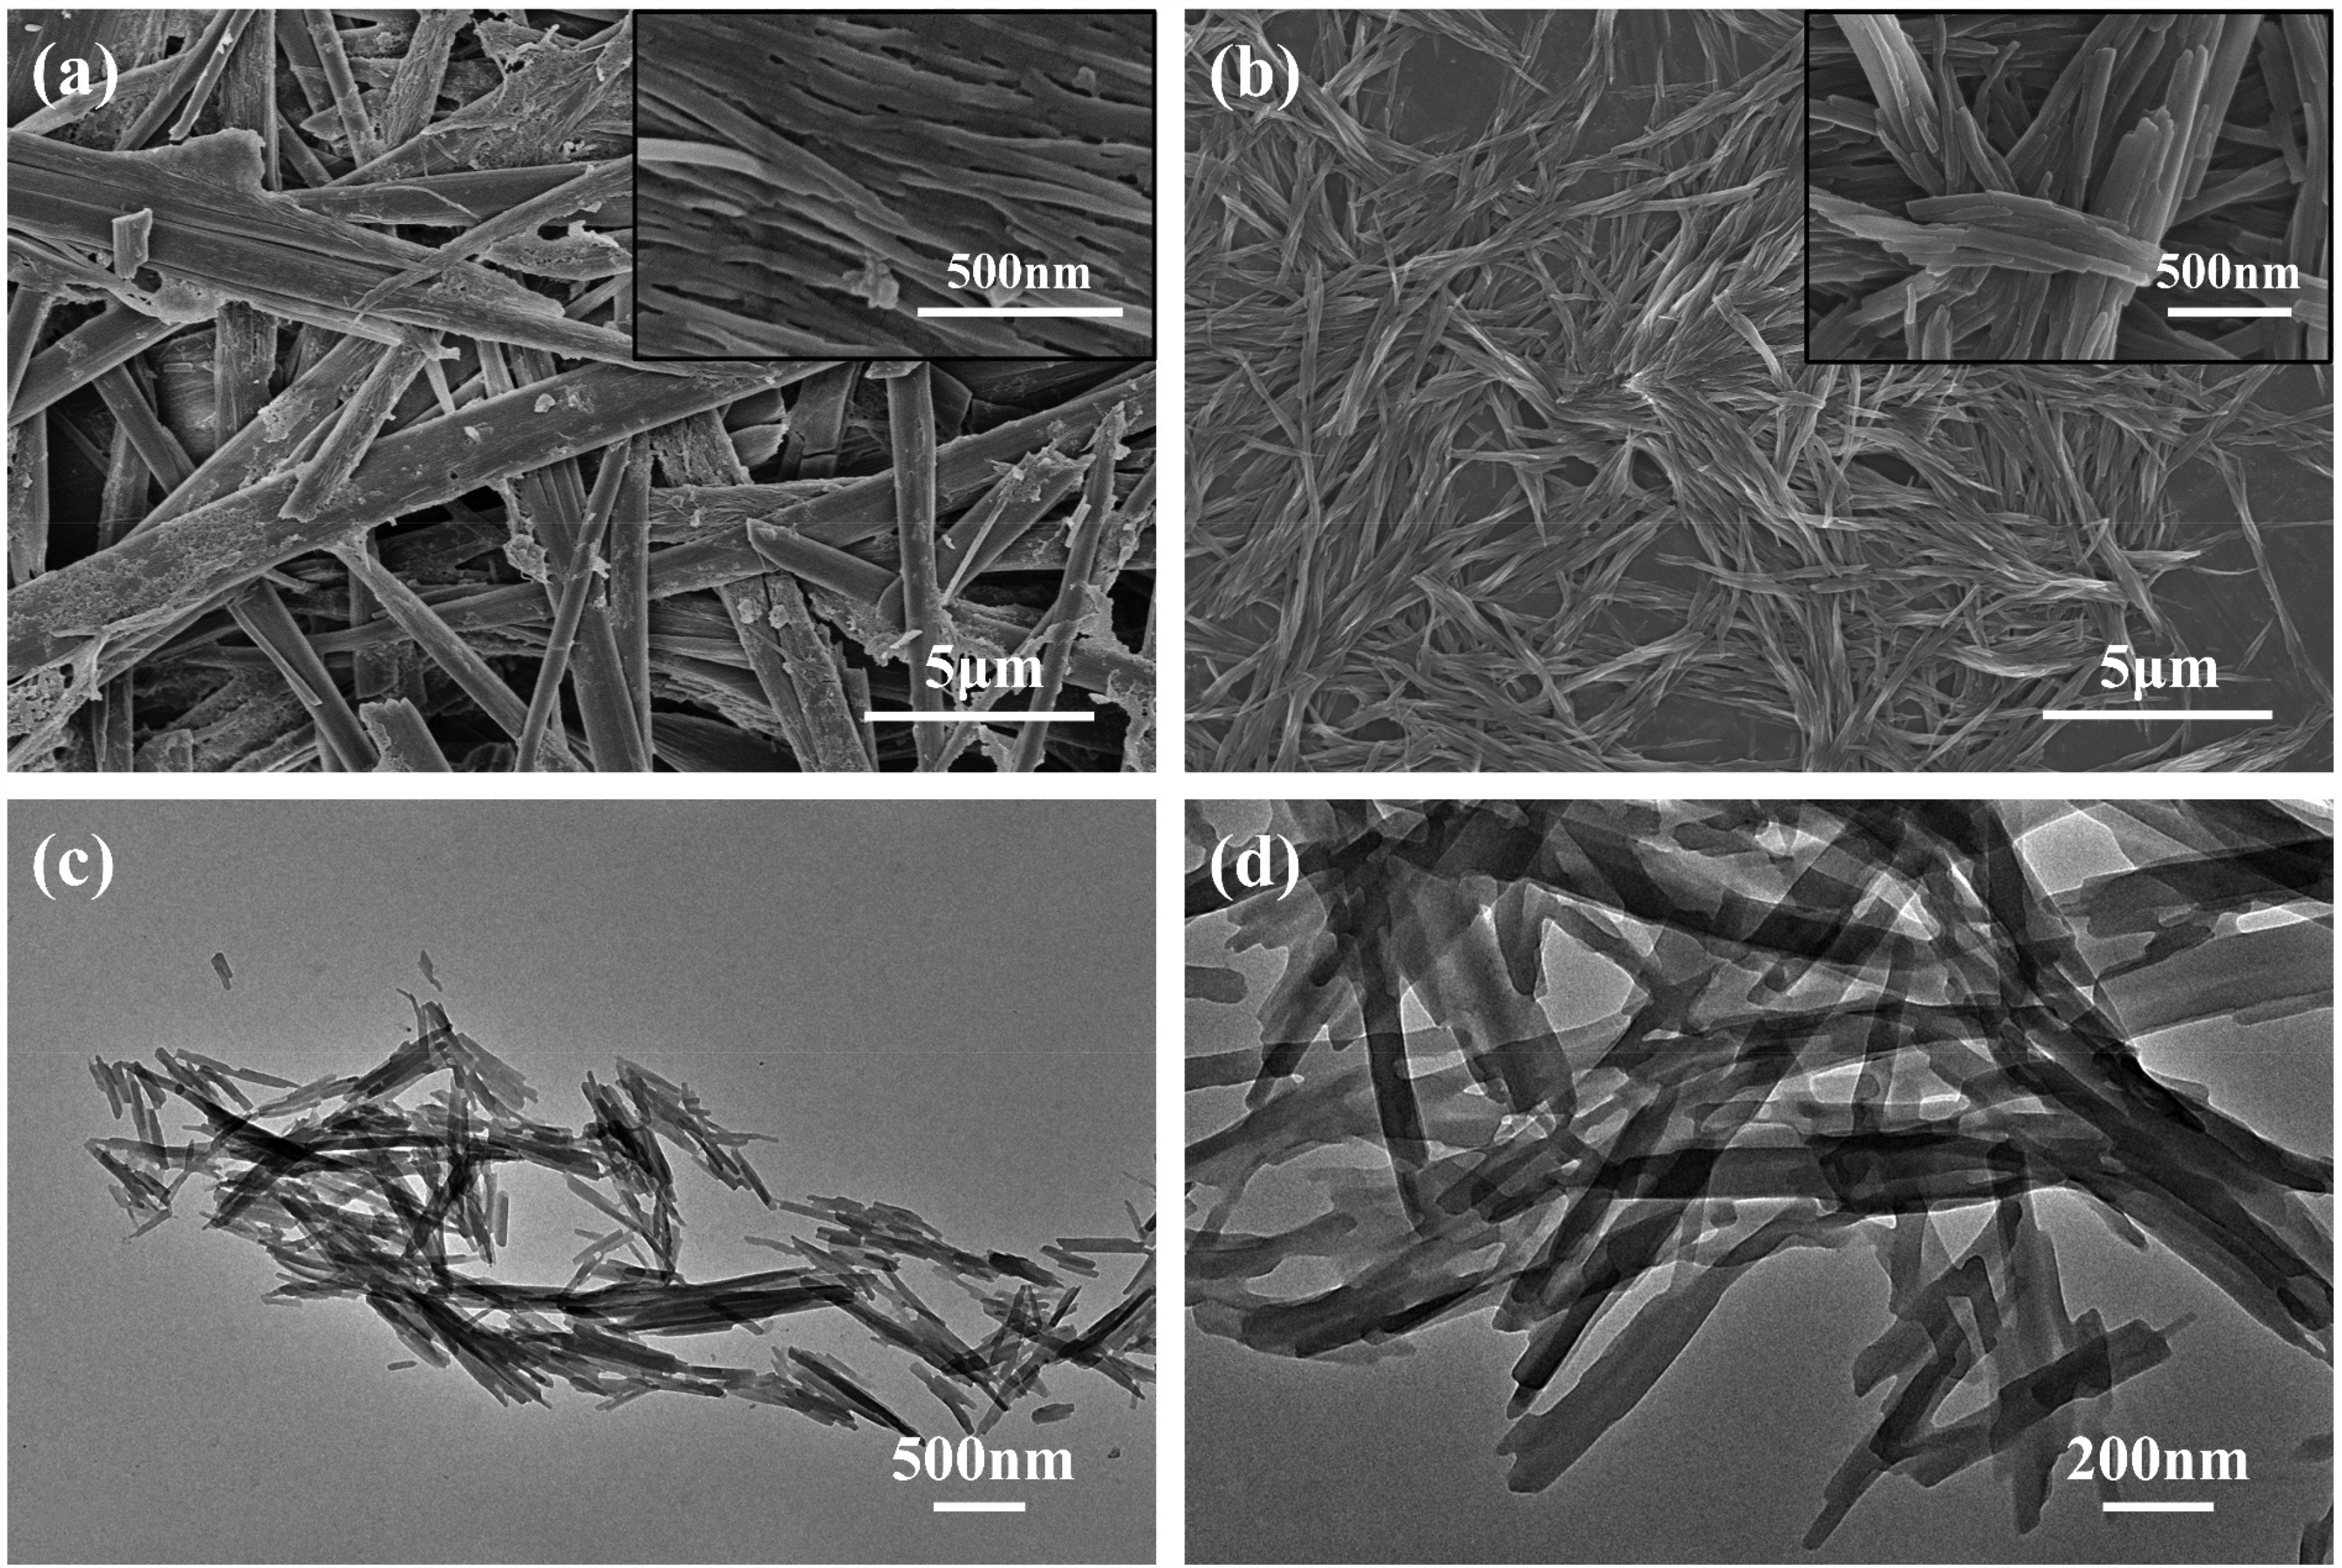
In order to show more details of the formation of QUE-NWs, QUE crystals with different aging times were taken for observation. The precipitate obtained at 90 s showed the morphology of QUE-NWs at the initial stage of growth (Figure 1b), and the lateral faces of QUE-NWs were close to each other and aggregated into a bundle-like structure, with an aspect ratio of about 28. After shortening the aging time, monodispersed QUE-NWs were observed in the precipitate obtained at 30 s (Figure 1c), with an average width of about 50 nm and an aspect ratio of about 13, with a tendency for QUE-NWs toward oriented attachment (Figure 1d). The QUE-NRs were further directed to grow into QUE-NWs with high aspect ratios.
The QUE crystals obtained at different time intervals showed that, in the Gen-assisted antisolvent precipitation process, QUE first nucleated in the supersaturated solution and formed QUE-NRs, which were oriented attached, and the lateral faces were close to each other, forming bundles. The QUE-NRs were oriented and close to each other in the lateral faces, forming a bundle structure, and with the increase of aging time, the QUE-NRs grew into QUE-NWs with high aspect ratios. Ultimately, the tightly arranged QUE-NWs constitute the QUE needle-like microcrystals.
Effect of Gen on the Morphology of QUE Crystals
During the experiment, it was found that the concentration of Gen aqueous solution affected the precipitation time of QUE crystals. Different concentrations of aqueous solutions of Gen were prepared, and the crystallisation of QUE crystals was observed under the conditions of 0, 3:1, 2:1, 1:1, 1:2, 1:3 and 2 h of mixing (Figure S2), and the time of precipitation of QUE crystals was 2, 9, 14, 19, 22, and 120 min, respectively. Compared to the control group in which only water was added, Gen was able to delay the precipitation of QUE crystals, and the more the amount of Gen was used, the slower the precipitation of QUE crystals, which indicated that Gen is able to influence the precipitation time of QUE crystals.
The modulation of QUE crystals by Gen was further observed by optical microscopy, and the QUE crystals prepared with the assistance of Gen are shown in Figure 2. During the experiment it was found that the mass ratio of Gen to QUE is an important factor affecting the average length of QUE crystals. When the mass ratio of QUE to Gen was 1:1, the average length of the prepared QUE crystals was about 5 μm (Figure 2a); when the mass ratio was 1:10, the average length of the prepared QUE crystals was about 40 μm (Figure 2b). Therefore, the addition amount of Gen not only affects the crystallization rate of QUE crystals but also affects the length of QUE crystals. Since the average length of the crystals prepared under the condition of 1:1 mass ratio of QUE to Gen was small, and the particle size was homogeneous, the QUE crystals prepared under this mass ratio were chosen for subsequent characterization.

Optical Microscope Diagram of the Prepared QUE Crystals.
The alcohol/water ratio also affected the morphology of QUE crystals. At the alcohol/water ratio of 1:4, curved QUE microcrystals (Figure 2c) could be observed, with their lateral faces close to each other to form bundles, and centrifugation after aging for 2 h resulted in further growth into sea urchin-like aggregates (Figure 2d). However, the crystals easily aggregated and the particle size distribution was not homogeneous. Therefore, a 1:1 volume ratio of ethanol to water was chosen to prepare needle-like QUE crystals.
XRD and FTIR
Based on the results of the XRD (Figure 3a), it was observed that the QUE had diffraction peaks at 6.16°, 10.72°, 12.36°, 15.72°, 16.02°, 23.82°, and 27.30° at 2θ, with sharp peak shapes and strong diffraction peaks, which indicated that the crystalline type of QUE was crystalline.30,31 The diffraction peaks of the QUE-NWs prepared under Gen-assistance were at 6.18°, 10.72°, 12.40°, 15.80°, 16.10°, 23.82°, 27.32°, and no diffraction peaks other than QUE were detected. Compared with the XRD pattern of QUE, there was no change in the position of the diffraction peaks of the prepared QUE crystals, confirming that the composition of the prepared crystals was still QUE and there was no Gen residue. Also, the sharp diffraction peaks indicated that the product had a high degree of crystallinity.

Next, the functional groups of the prepared QUE crystals were compared with those of the QUE by FTIR spectroscopy (Figure 3b). According to the existing literature, 3000–3400 cm−1 is the stretching vibration of O-H; 1659 and 1605 cm−1 are the stretching vibration of C = O group; the stretching vibration at 1312 and 1162 cm−1 corresponds to the stretching vibration of C-O-C bond; and 1558 and 1519 cm−1 are attributed to benzene ring. 30 The above peaks are basically the same as those of QUE, and no new peaks appeared, thus showing that after interacting with Gen, no new reactants were produced. By comparing the relative intensities of the infrared peaks of the QUE and QUE-NWs, the relative intensities of the hydroxyl peaks at 3000–3400 cm−1 of the QUE-NWs were increased, indicating greater hydroxyl exposure.
The 1H NMR spectra of QUE-NWs (Figure S3) were also consistent with those of QUE. The XRD patterns, IR spectra, and 1H NMR spectra confirmed that the composition of the prepared QUE crystals was still the QUE molecule, and Gen did not exist in its structure. This proved that the interaction between the two only affected the crystal structure and did not change the crystal composition.
Spectral Analysis
Both QUE and Gen have good alcohol solubility, and in order to determine the mechanism of interaction between QUE and Gen, UV spectroscopy was carried out in the ethanol solution. The UV spectrum of QUE (Figure 4a) showed two major absorption bands, commonly referred to as band I (300-400 nm) and band II (240-280 nm). Band I is associated with the light absorption of the cinnamoyl system, and band II is associated with the light absorption of the benzoyl system. 32 The UV absorption peak of Gen appeared at 239 nm. Comparison of the UV spectra of QUE, Gen, and the mixture of the two in ethanol solution showed that a new peak appeared at 230 nm and the intensity of the peak at 256 nm increased, while the original peak at 375 nm for QUE remained unchanged, suggesting that the site of interaction between the two may be in the benzoyl portion of QUE.

QUE has unique optical properties with both aggregation-induced luminescence phenomenon (AIE) and intramolecular proton transfer (ESIPT). 33 Unlike conventional organic dyes, AIE fluorescent materials fluoresce weakly in dilute solution and emit fluorescence intensely in an aggregated state. 34 Therefore, the interaction between QUE and Gen can be further illustrated by measuring the fluorescence spectra of the mixed solution. When the excitation wavelength was 375 nm, QUE had the strongest fluorescence emission in the mixed solution, and the emission peak of Gen at 375 nm did not interfere with QUE. Two emission peaks at 432 nm (enol emission) and 536 nm (keto emission) existed in the emission spectrum of QUE at an excitation wavelength of 375 nm (Figure 4b).
It has been shown that the keto emission of QUE is attributed to AIE and that crystallization leads to enhanced AIE emission. The keto emission of QUE was weakened compared to the control without Gen addition, confirming that the above five mass ratios of Gen inhibited the aggregation of QUE. However, the keto emission was gradually enhanced with the increase in the dosage of Gen, which was in agreement with the experimental phenomenon of the increase in the average length of QUE crystals with the increase in the dosage of Gen, as described earlier (Figure 2a, b). Fluorescence profiles indicated that Gen favored the dispersion of QUE molecules, but this effect weakened with increasing Gen dosage.
The results of the spectroscopic study on the mechanism of action between Gen and QUE indicated that the action site may be located in the benzoyl part of the QUE molecular structure. In addition, Gen affected the nucleation rate of QUE and influenced the aggregation of QUE molecules in a specific concentration range.
Mechanism of Action
Molecular Docking
In order to investigate the interaction between QUE and Gen, molecular docking was carried out by the Autodock program to simulate the possible interaction modes of the two (Figure 5a). Gen and QUE were stacked in an “X” shape, and the carbon atoms on the aromatic ring of QUE at the intersection revealed hydrophobic interactions with the saturated carbon atoms of Gen below. The molecular docking results are shown on the left as the hydrogen bond between QUE C5-OH and the Gen carbonyl group and on the right as the hydrogen bond between the QUE ether-bonded oxygen and the C2-OH in the Gen glucose group. One hydrogen bond had a bond length of 2.5 Å and a bond angle of 122.4°; the other had a bond length of 2.4 Å and a bond angle of 159.7°. Both parameters are consistent with the conditions for hydrogen bond formation, especially since the bond lengths are shorter, implying that the two sets of hydrogen bonds are more strongly acting. In addition, the two molecules are more stretched conformationally, indicating that this cross-interaction is easy to form.

Raman spectra (Figure 5b) can provide information related to the sample molecules and help explain the molecular structure and intermolecular interactions of flavonoids. According to the Raman spectroscopy results, the difference in the Raman spectra of the QUE-NWs compared to the QUE have the enhanced relative intensity of the peaks at 1440 cm−1 and 1552 cm−1. According to the existing literature, 1440 cm−1 is attributed to C3,5 -OH with carbonyl; 1552 cm−1 is attributed to C5-OH with carbonyl. 35 This region has a stronger carbonyl stretching component than the other peaks and is the most reliable peak, indicating carbonyl interactions. 36 Therefore, the QUE crystals prepared with Gen assistance had more carbonyls exposed with C3,5 -OH than the QUE. Among them, the C5-OH and carbonyl group belonged to benzoyl system, which is consistent with the UV spectral results. In addition, the relative intensities of the rest of the Raman peaks were weakened. The Raman spectra of QUE-NWs still retained the characteristic peaks of QUE, which is consistent with the results of XRD and IR spectra.
MD Simulations
Parameters Analyze
Root mean square deviation (RMSD) is utilized to quantify the average deviation between the conformation of the complex and its initial conformation at a given time point, thereby evaluating whether the complex system has achieved a stable state. 37 Lower RMSD values suggest relatively stable binding interactions. 38 The RMSD values of QUE and Gen exhibit significant fluctuations within the initial 15 ns, indicating continuous self-assembly into nanoparticles (Figure 6a). During this period, substantial conformational adjustments occur as the molecules seek optimal binding positions, leading to pronounced structural changes. After 15 ns, the RMSD stabilizes at approximately 3.30 nm, signifying the formation of stable nanoparticles.

Changes in
The radius of gyration (Rg) is an index utilized to quantify the compactness of molecular structures during molecular dynamics simulations. 39 A lower Rg value indicates a higher density of particles. 40 The initial high Rg value reflects a dispersed and loose arrangement of QUE and Gen molecules (Figure 6b). With ongoing self-assembly, the Rg decreases and stabilizes around 1.55 nm, indicating the gradual formation of compact and stable nanoparticles.
The solvent-accessible surface area (SASA) can be utilized to assess the density of nanoparticles. As nanoparticles form, the surface area exposed to the solvent environment progressively diminishes, leading to a decrease in the SASA value. 41 SASA continuously decreases and stabilizes at approximately 75.00 nm² (Figure 6c), suggesting that some molecules become buried within the nanoparticles, reducing their exposure to the solvent. This results in the formation of compact and stable nanoparticles.
To further investigate the driving forces behind the system's interactions and aggregation, we conducted a statistical analysis of the total number of hydrogen bonds formed between QUE and Gen (Figure 6d). The continuous self-assembly of QUE and Gen molecules led to enhanced molecular interactions, including the gradual formation of hydrogen bonds (green line). After reaching equilibrium, the number of hydrogen bonds stabilized at approximately 25, indicating that the molecular interactions between QUE and Gen were stable. Similarly, hydrogen bonds between QUE-QUE and Gen-Gen stabilize at approximately 68 and 8, respectively, contributing to nanoparticle stability. Hydrogen bond analysis confirms that stable interactions develop between QUE and Gen during self-assembly.
Figure 6e shows that the self-assembly process is driven by both van der Waals and electrostatic interactions. Numerically, the vdW and Coulomb energies continuously increase and stabilize at approximately −1150 kJ·mol−1 and −700 kJ·mol−1, respectively, indicating energetically favorable self-assembly. Additionally, it was observed that van der Waals interactions played a dominant role in the interactions between these two molecules. The binding free energy also exhibits a similar trend, stabilizing at approximately −115 kcal·mol−1, further supporting the formation of stable nanoparticles (Figure 6f).
Details of the Interaction and the Electrostatic Potential Energy
From the electrostatic potential energy distribution diagram, it is evident that the positive electrostatic potential regions of the two molecules are uniformly distributed around the C-H groups (Figures 7a, 7b). The minimum values are localized near the oxygen atoms in the C = O and O-H groups, while the maximum values are predominantly found around the hydrogen atoms in the O-H groups, with a few maxima also observed around the hydrogen atoms in the C-H groups. The positive electrostatic potential regions between the two molecules are more likely to interact with the negative electrostatic potential regions. In conjunction with Figure 7c and the molecular docking results, it can be observed that hydrogen bonds primarily form between the hydroxyl functional groups of the two molecules and the oxygen atoms of the hydroxyl and C = O groups. This indicates that the electrostatic potential minima of the two molecules attract the electrostatic potential maxima within the molecule, leading to stable interactions (hydrogen bonding and electrostatic attraction).

Electrostatic Potential Energy Distribution of QUE
Additionally, QUE molecules possess aromatic rings, which facilitate π-π stacking interactions between QUE molecules. These aromatic rings can also engage in π-π interactions with the alkyl groups of Gen molecules. Under the influence of these interactions, QUE and Gen molecules gradually aggregate to form stable nanoparticles (Figure S4).
QUE Crystal Growth Process
Among the crystal growth theories, the classical crystal growth theory suggests that new phases appear by adding the monomers one after another to an isolated cluster. 42 In contrast, oriented attachment (OA) belongs to the non-classical crystal growth theory, where the process includes the formation of loose particles from the primary particles first, after which the particles reach the crystalline arrangement by Brownian motion, finally forming continuous crystals. 43 Therefore, based on the analysis of the experimental phenomena, this is in line with the non-classical crystal growth theory.
The (010) face of QUE is hydrophobic and grows through π-π stacking interactions between QUE molecules; the (100) face is hydrophilic and grows through polar hydrogen bonding; and the (001) and (011) faces are the high-energy faces of the QUE crystals, and both polar and apolar interactions contribute to their growth. 18 During the Gen-assisted antisolvent precipitation process, the solubility of the molecular state of QUE in ethanol solution is reduced by the addition of water, and QUE first forms QUE-NRs in the supersaturated solution. QUE-NRs tend to join along the (001) and (011) surfaces, gradually forming nanofibres head-to-tail, and the two high-energy surfaces form the QUE-water hydrogen bonding, the QUE-Gen hydrogen bonding, and the π-π stacking of QUE molecules. The QUE crystal (100) faces formed hydrogen bonds with water and Gen, which hindered the nanofibre (100) faces from approaching each other, forming loose bundled aggregates. However, as the aging time increased, the nanofibres became more closely aligned and eventually formed needle-like QUE crystals (Figure 1a). The anisotropy of the QUE crystal surfaces ultimately determined the formation of QUE crystals with high aspect ratios under the action of Gen (Figure 8c). Stick-like nanoparticles are defined as one-dimensional nanodrugs. 44 Additionally, it has been suggested that such elongated anisotropic nanoparticles remain circulating in the bloodstream for a prolonged period of time and exhibit favorable biodistribution. 45

Natural crystallization is often challenging to control and less reproducible, whereas cavitation bubbles formed by ultrasound can reduce agglomeration between crystals.
46
Ultrasound can significantly enhance the mixing efficiency of QUE with Gen and water, avoiding the agglomeration of nanorods on the one hand and hindering the self-assembly of nanorods to form nanowires, on the other hand, which is conducive to the formation of nanoparticles with uniform and monodisperse particle size (Figure 8a). Therefore, the prescription was optimized by Box-Behnken method (Table S1–5; Figure S5), and QUE-NRs were prepared by combining ultrasound and Gen, QUE-NRs with a particle size of 177.4 nm (
Antioxidant Activity
QUE is a flavonoid with antioxidant capacity and scavenging effect on a wide range of free radicals. The 3′,4′-neighbouring dihydroxyl structure of the B-ring in the structure of QUE, the conjugation of the C2 = C3 double bond to the 4-oxo group in the C-ring, the hydroxyl group in the 3-position of the C-ring, as well as the intramolecular hydrogen bonding, determines the high antioxidant capacity of QUE. 47 The present experiments were carried out to investigate the scavenging rate of DPPH by QUE-NRs and to compare with vitamin C and QUE (Figure 9a). The results showed that the prepared QUE-NRs further improved the DPPH scavenging rate of QUE and exhibited better antioxidant capacity. The reason for this may be that after Gen modulation, the particle size of QUE was reduced, compared to the increased specific surface area of QUE, and the antioxidant regions in the molecular structure of QUE were combined with DPPH to exert stronger antioxidant activity. According to the Raman spectroscopy results, the QUE-NRs had more -OH as well as the carbonyl group exposed, which also led to the enhancement of the antioxidant activity of the crystals. The DPPH scavenging rate of QUE-NRs was higher than that of QUE, and this experimental result can provide some reference for subsequent animal experiments.
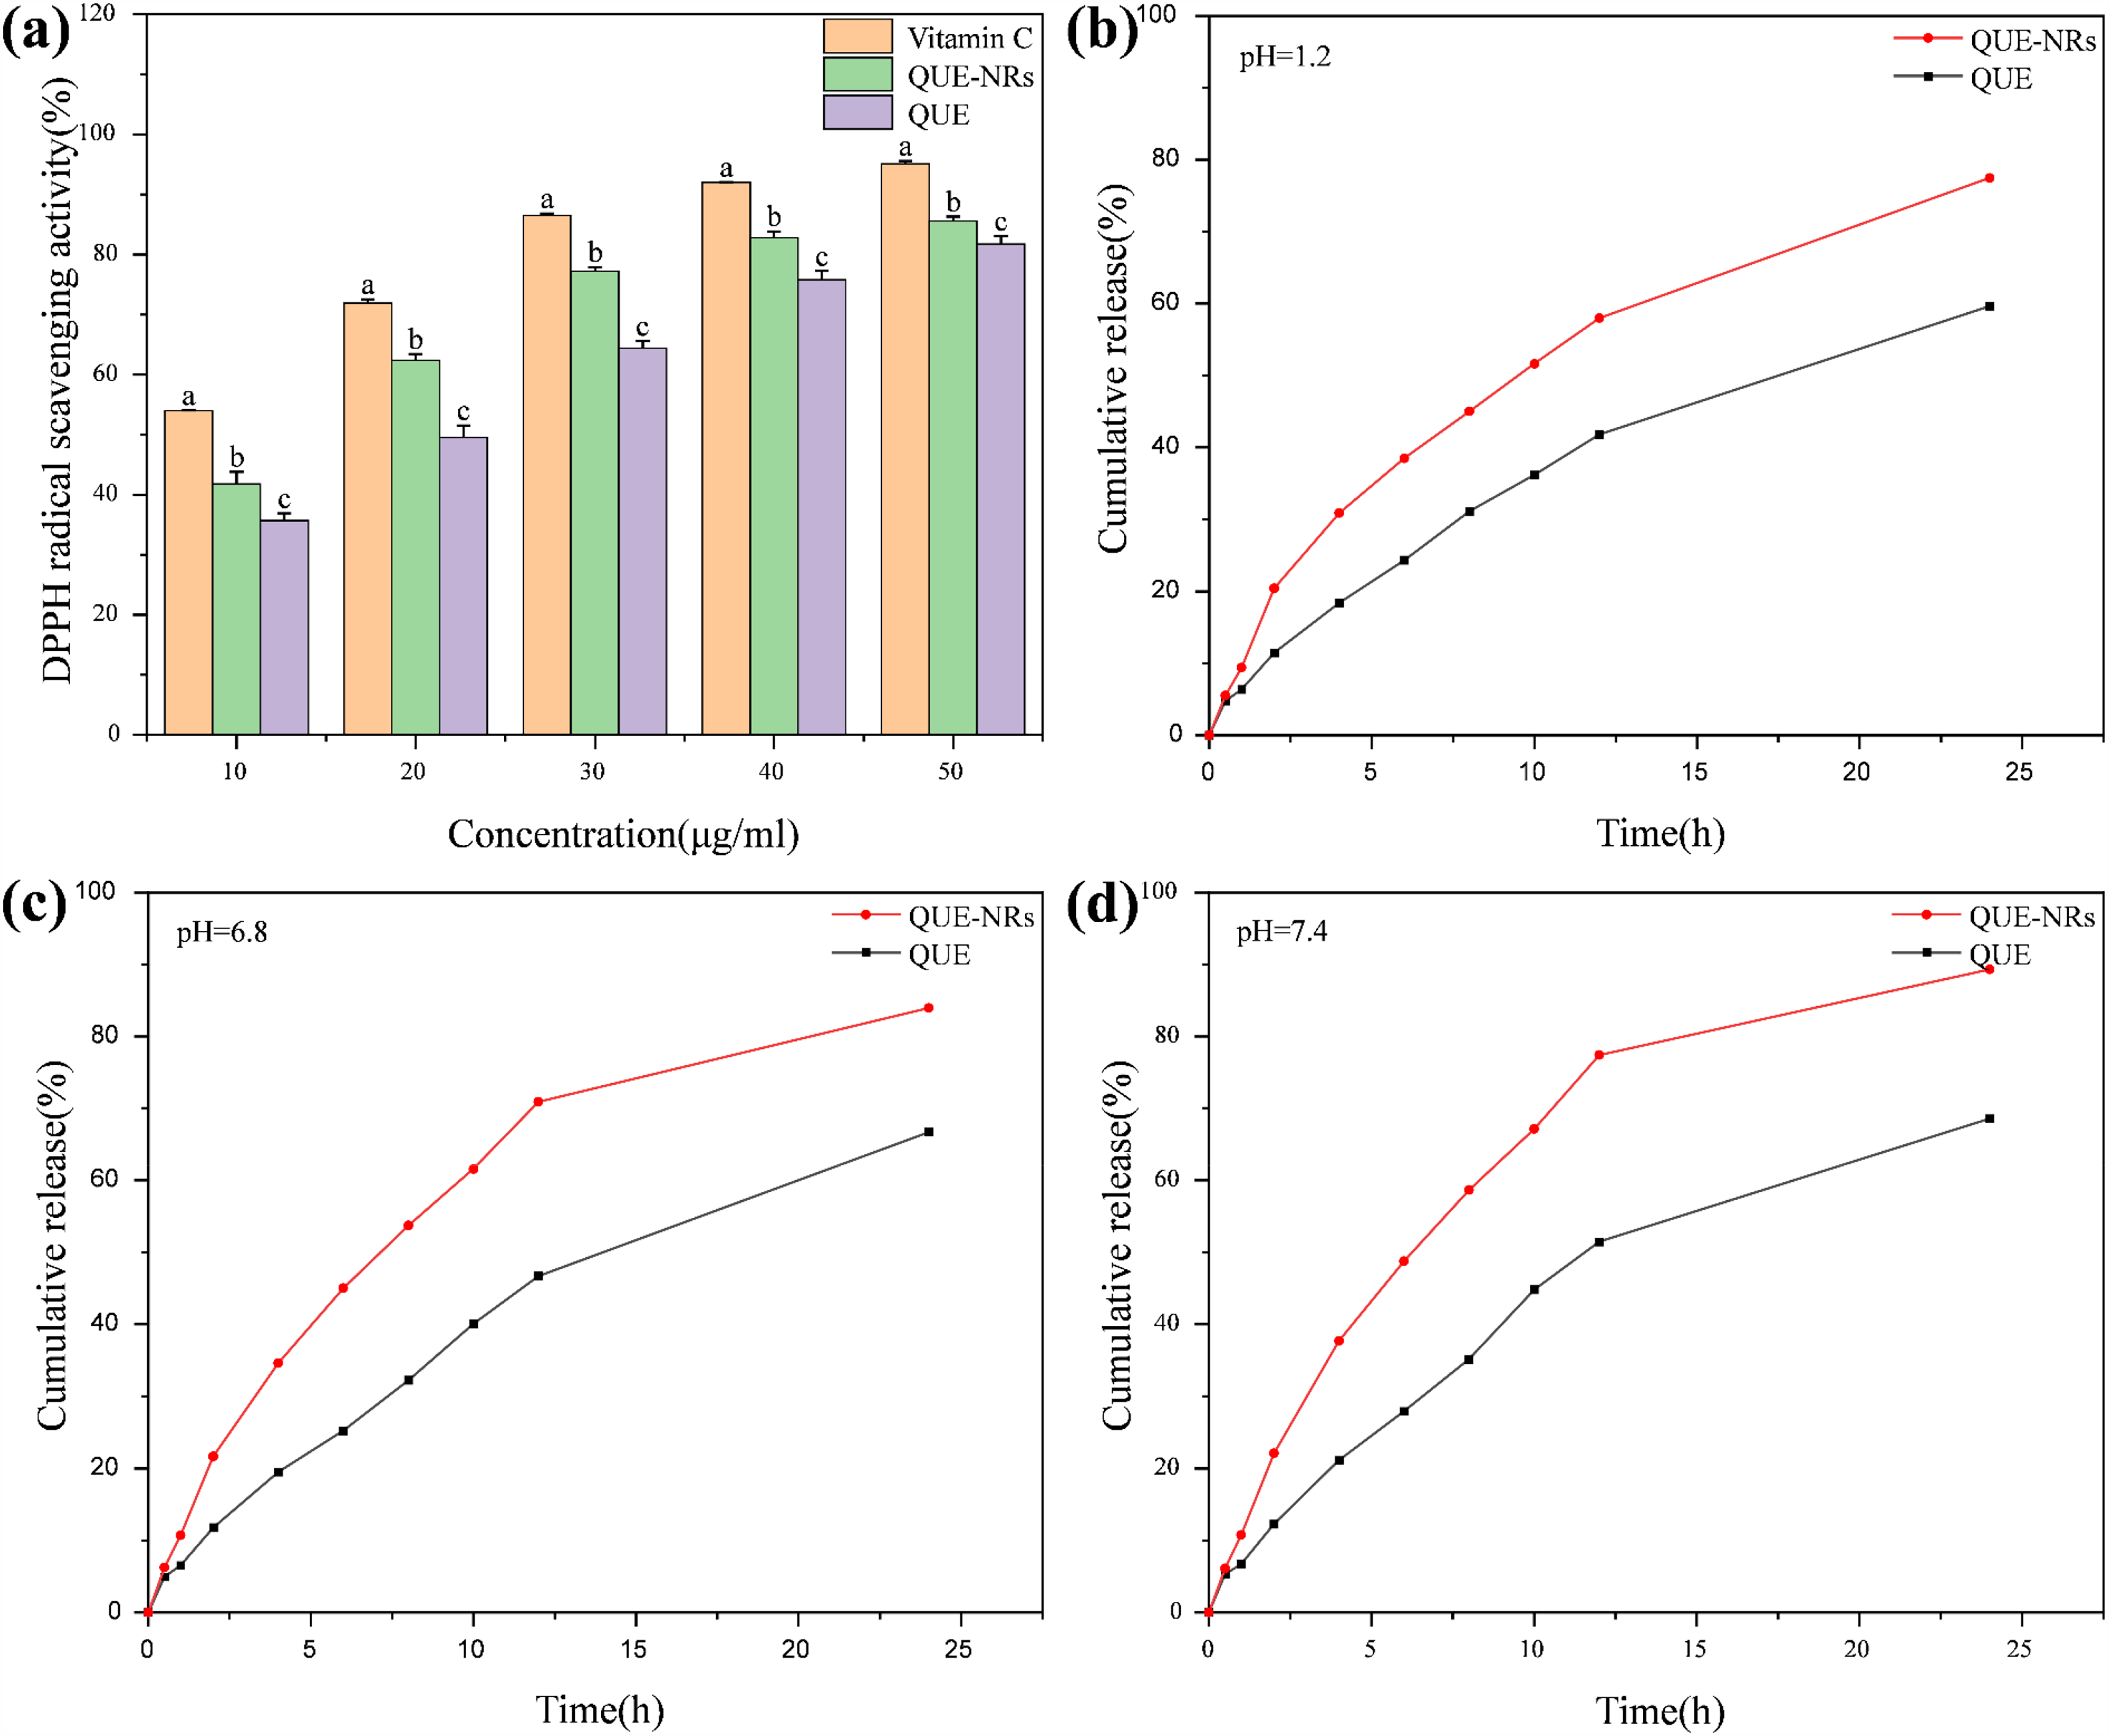
As a BCS IV drug, the solubility of QUE significantly influences its clinical application. The in vitro release profiles of QUE and QUE-NRS were evaluated in simulated gastric fluid (pH 1.2), small intestinal fluid (pH 6.8), and colonic fluid (pH 7.4) (Figure 9b, c, d). The results indicate that the cumulative release of QUE-NRS at 24 h exceeds 80%, whereas the cumulative release of QUE is below 70%. According to the Noyes-Whitney equation, an enhanced dissolution rate is attributed to a reduction in particle size. The specific surface area of QUE-NRS is markedly increased, and the thickness of the diffusion layer surrounding the particles is diminished, 48 thereby facilitating the dissolution of QUE-NRS nanocrystals. QUE-NRS effectively enhances the dissolution of raw QUE, and its favorable dissolution properties contribute to improved bioavailability.
Discussion
QUE-NWs with a high aspect ratio were obtained through antisolvent precipitation in the presence of Gen. Electron microscopy images and optical microscopy images analyses at various aging times elucidated the potential growth process of QUE-NWs: QUE first nucleated in the supersaturated solution and formed QUE-NRs, which were oriented attached, and the lateral faces were close to each other, forming bundles, which subsequently underwent longitudinal growth. The results of spectral analysis and molecular simulations demonstrate that Gen influences the growth process of QUE crystals through hydrogen bonding, electrostatic interactions, and van der Waals forces, without altering the crystal composition. Understanding this interaction mechanism is advantageous for further synthesizing monodisperse QUE-NRs with enhanced performance using ultrasound assistance. Studies have demonstrated that QUE-NRs exhibits superior in vitro dissolution performance and DPPH radical scavenging activity compared to QUE raw materials. This enhanced performance is attributed to the greater specific surface area of QUE-NRs.
One significant limitation of this study should be addressed in future research. Besides the influencing factors discussed in this paper, other elements such as ultrasonic duration, frequency, temperature, UV light exposure, and additional variables may also exert considerable influence on QUE-NWs growth when intervened by Gen.
Conclusions
Starting from the compound of TCM, the present work investigated the effect of Gen on the crystal growth of QUE and the mechanism of the two actions. Our findings showed that Gen directly affects the growth process of QUE, QUE C5-OH formed a hydrogen bond with the carbonyl group of Gen, and the ether bonding oxygen of QUE formed a hydrogen bond with the C2-OH in the glucose group of Gen, the carbonyl group of QUE and the C3-OH might also be the potential sites of action. Additionally, the intermolecular interactions between QUE and Gen, such as van der Waals forces and electrostatic interactions, have been characterized. On the other hand, ultrasound blocks the QUE crystal growth process. Finally, QUE-NRs with higher antioxidant activity and pure crystal structure were prepared using the dual effect of Gen and ultrasound. Investigating the interactions between active ingredients of TCM can provide a theoretical basis for further investigation of the mechanism of drug efficacy.
Supplemental Material
sj-docx-1-npx-10.1177_1934578X251332861 - Supplemental material for The Impact of Quercetin- Geniposide Interaction on the Growth and Properties of Quercetin Nanocrystals
Supplemental material, sj-docx-1-npx-10.1177_1934578X251332861 for The Impact of Quercetin- Geniposide Interaction on the Growth and Properties of Quercetin Nanocrystals by Wei Lv, Huiwen Zhang, Na Sai, Rongli Li, Jian Li, Ruming Liang, Chunlei Miao, Rui Huangfu, Zhigang Zhang, Jie Wang, Yujun Yao, Guoliang Xing and Shikui Wu in Natural Product Communications
Footnotes
Acknowledgments
This work was financially supported by the National Natural Science Foundation of China (81503351, 81760750, 82360824); Development Plan for Innovation Teams in Higher Education Institutions in Inner Mongolia Autonomous Region (NMGIRT2421); Inner Mongolia Autonomous Region Science and Technology Plan (2023YFHH0018); The ‘Grassland Talent Project of Inner Mongolia Autonomous Region’(CYYC10058); the ‘Youth Science and Technology Talents Support Plan’ of colleges and universities in Inner Mongolia Autonomous Region (NJYT-18-A09); the Zhiyuan Talent Team of Inner Mongolia Medical University (ZY0120019); Central guidance for local scientific and technological development funds(2022ZY0176).
Statement of Human and Animal Rights
This article does not contain any studies with human or animal subjects.
Statement of Informed Consent
There are no human subjects in this article and informed consent is not applicable.
Ethical Considerations
This article does not contain any studies with human or animal participants.
Author Contributions/CRediT
Conflicting Interests
The author(s) declared no potential conflicts of interest with respect to the research, authorship, and/or publication of this article.
Funding
The author(s) disclosed receipt of the following financial support for the research, authorship, and/or publication of this article:This work was financially supported by the National Natural Science Foundation of China (81503351, 81760750, 82360824); Development Plan for Innovation Teams in Higher Education Institutions in Inner Mongolia Autonomous Region (NMGIRT2421); Inner Mongolia Autonomous Region Science and Technology Plan (2023YFHH0018); The ‘Grassland Talent Project of Inner Mongolia Autonomous Region’(CYYC10058); the ‘Youth Science and Technology Talents Support Plan’ of colleges and universities in Inner Mongolia Autonomous Region (NJYT-18-A09); the Zhiyuan Talent Team of Inner Mongolia Medical University (ZY0120019); Central guidance for local scientific and technological development funds(2022ZY0176).
Supplemental Material
Supplemental material for this article is available online.
References
Supplementary Material
Please find the following supplemental material available below.
For Open Access articles published under a Creative Commons License, all supplemental material carries the same license as the article it is associated with.
For non-Open Access articles published, all supplemental material carries a non-exclusive license, and permission requests for re-use of supplemental material or any part of supplemental material shall be sent directly to the copyright owner as specified in the copyright notice associated with the article.