
Abstract
This is a visual representation of the abstract.
Introduction
A variety of natural products are regarded as the primary source of bioactive compounds utilized to prevent and treat certain diseases. Furthermore, food and food-derived products frequently offer health benefits, and there is a growing interest in their use as nutraceuticals or dietary supplements. In this context, a significant area of research today is focused on reactive oxygen species (ROS), which may trigger unfavorable reactions that cause damage to numerous molecules, including proteins, lipids, RNA, and DNA. 1 These oxidative damages may have a significant impact on human health contributing to a number of diseases such as cancer, diabetes, rheumatoid arthritis, cardiovascular complications, Parkinson's and Alzheimer's disease.2,3 Consequently, there is a growing interest in antioxidants derived from plants that can be employed to prevent the adverse effects of aberrant oxidative stress, which is largely attributed to phenolic compounds.3,4 Grape (Vitis vinifera L., Vitaceae) is the most widely cultivated and economically important fruit crop in the world, highly appreciated for its distinctive flavor and the greatest use in wine production. 5 It is well known that fruit exocarp and seeds, as well as waste products generated during wine and/or juice processing, are rich sources of polyphenols. 6 In this context, a solid by-product of the winemaking process, known as grape pomace, has attracted increasing interest in recent years as an eco-friendly source of bioactive compounds that can be used in nutraceutical, cosmetic and pharmaceutical products. 7 Wine, as a fermented grape product, is primarly composed of water (up to about 86%) and ethanol (up to about 14%), but it is valued for its phenolic content which accounts for only 0.1%. However, these compounds play a crucial role in its quality represented by organoleptic characteristics.8910–11 Most importantly, these compounds are associated with wine properties beneficial to human health, and the most active are flavonoids; this group includes red (anthocyanidins) and yellow (flavonols) pigments, both usually present in glycosidic forms, 12 as well as flavanols (flavan-3-ols), which contribute to color and sensory characteristics. 11 The non-flavonoid polyphenolic fraction includes phenolic acids and stilbenes. 12 Resveratrol is a stilbene found mainly in red wines, accompanied by its glycoside (called piceid), or it can also be coupled, leading to the formation of more complex forms (dimeric or trimeric).13,14 Although its concentration is much lower than that of other polyphenols, resveratrol has received particular attention for its biological properties and potential therapeutic effects, and it is often considered to be the main functional compound in red wine.13,15,16 The so-called French paradox concept suggests a correlation between wine consumption and protection against cardiovascular diseases 17 and numerous studies181920–21 have reported various biological activities of wine, such as anti-inflammatory, anti-aging, anticancer and antimicrobial. These activities are mainly based on the radical scavenging activity of their phenolic constituents, which allows them to prevent the oxidative damage caused by ROS. 7 Nevertheless, no single compound defines the total antioxidant capacity and a potential synergistic effect is suggested. 22
Polyphenols can be successfully extracted using conventional (maceration) or innovative methods (high-intensity ultrasound-assisted, microwave-assisted or supercritical extractions), as reported in many studies carried out on grapes or their different parts (exocarp or seed), as well as on lees or pomace, as by-products of wine production.23242526–27 However, there are no such data on extracts from wine itself. This is particularly interesting given that the enormous polyphenolic variability of a wine is caused not only by the ripening stage, genetic and/or environmental factors, but also by the winemaking process and wine aging and maturation, with or without contact with wood, all of which provoke indeterminable reactions leading to their complex transformations, such as oxidation, co-pigmentation, polymerization or cycloaddition. 14 All this could result in different chemical profiles and associated bioactivities. For this purpose, a liquid-liquid extraction was performed on wine samples according to the Kutscher-Steudel procedure. The contents of phenolics, flavonoids, tannins and anthocyanins were determined, followed by the evaluation of antioxidant activity. The results presented here are the first contribution to this aspect of the use of wine, forming a possible basis for further research aimed at exploitation in the fields of pharmacy, cosmeceuticals and agriculture.
Materials and Methods
Chemicals and Instruments
All standards of phenolic compounds and other chemicals/reagents were purchased from Cayman Chemical (Michigan, United States), Acros Organics (Antwerp, Belgium), Sigma-Aldrich Chem (Steinheim, Germany), VWR International (Pennsylvania, United States), MP Biomedicals (California, United States), Alfa Aesar (Massachusetts, United States), Carl Roth (Karlsruhe, Germany), and Centrohem (Stara Pazova, Serbia). All reagents used in this study were of analytical grade. The instruments used in this work were: UV-Vis spectrophotometer (Cecil Aurius Series CE 2021, United Kingdom), digit pH meter (Jenway 3505, England), incubator (LSW-33, Vims Elektrik, Serbia), and analytical balance (Kern ABS 220-4, Philippines).
Wine Samples
A total of five wine samples from both commercial and private production were selected for this study, all from the Montenegrin wine region of Skadar Lake. Two of the most renowned local commercial wines were purchased from the winery (‘’13. jul Plantaže’’): Vranac and Krstač, both from the Podgorica sub-region and from the 2016 vintage. In addition, homemade wines from the 2020 vintage were included: Kratošija and Chardonnay from a producer in Doljani (Podgorica sub-region) and Kratošija from a producer in Stijena (Piperi sub-region). Krstač (white), Vranac and Kratošija (red) are well-known autochthonous grape varieties that make Montenegro recognizable in the wine world. Although not autochthonous, the Chardonnay grape is used locally for white wine production and was therefore included in this study.
Liquid-Liquid Extraction
This method is a very gentle liquid-liquid extraction because it requires low temperatures, usually around the boiling point of the solvent used. It is recommended for temperature sensitive analytes such as volatile. 28 The extraction process itself is very time-consuming, requiring a period of more than 20 h, which may be a reason why only a few studies have used this technique.29,30
The apparatus was developed for the extraction of aqueous solutions with solvents lighter than water, originally diethyl ether, but pentane, hexane or ethyl acetate could also be used. 31 The principle of the extraction process is shown in Figure 1. An appropriate amount of sample (red) is placed in the extracting flask and a solvent (green) in a separate flask is gently heated above its boiling point. The resulting vapor condenses in a reflux condenser and flows through a funnel to the bottom of the extraction flask, where it reaches the sample. Taking advantage of the difference in densities, the solvent passes through the sample, absorbing its bioactive compounds. The compound enriched solvent returns to the flask where the cycle begins again. 28

Kutscher-Steudel apparatus for liquid-liquid extraction.
In this study, 70 mL of wine was transferred into the extracting flask (100 mL total volume). The wine sample was covered with the required amount of diethyl ether or ethyl acetate (used as solvents) to reach the outlet of the flask. An additional 150 mL of the solvent was added to the 250 mL receiving flask (resulting in a final wine-to-solvent ratio of 1:2.5), which was then heated to its boiling point. The solvents were enriched with wine components over a period of 24 h. Finally, the extracts were obtained by evaporating the solvents. A total of ten final extracts were obtained, as shown in Table 1, and stored at 4°C in an airtight container until further use. Prior to analysis, stock solutions (1 mg/mL) were prepared by dissolving the extracts in methanol.
A Total of ten Wine Extracts Obtained with Liquid-Liquid Extraction Process; Solvent for Extraction, Sample, Origin and Extract Name are Listed.

Five wine samples from commercial and private production were used, as reported in the Wine Samples subsection; red (Vranac and Kratošija) and white varieties (Krstač and Chardonnay).
E–extract.
Determination of Total Phenol Content
Total Phenol Content (TPC) was determined according to the Folin-Ciocalteu colorimetric method with some modifications.32,33 Reaction mixtures were prepared with 1 mL of stock solutions of each extract, 0.5 mL Folin-Ciocalteu reagent (previously diluted 10-fold with distilled water) and 2.5 mL 7.5% sodium carbonate. After 120 min in the dark, absorbance was measured at λmax = 740 nm. Gallic acid (10-75 µg/mL) was used to construct a calibration curve. The TPC values were calculated from the regression equation of the calibration curve and expressed as mg gallic acid equivalent (GAE) per g wine extract dry weight. All experiments were performed in triplicate and data were expressed as mean ± standard deviation (SD).
Determination of Total Flavonoid Content
Total Flavonoid Content (TFC) was determined using the aluminum chloride (AlCl3) colorimetric method with minimal modifications.33,34 Briefly, 1.2 mL of each stock solution was mixed with 1.2 mL 2% AlCl3 solution. The prepared mixtures were incubated for 60 min at room temperature. Absorbance was measured at λmax = 420 nm. Quercetin (5-200 µg/mL) was used as a standard. The TFC values of the extracts were calculated from the calibration curve and expressed as mg quercetin equivalent (QE) per g wine extract dry weight. The results are the mean ± SD of three determinations.
Determination of Total Tannins Content
Total Tannins Content (TTC) was estimated using the modified Prussian blue method.35,36 Reaction mixtures were prepared by mixing 500 µL of each stock solution, 8 mL distilled water, 0.5 mL 0.1 M ferric chloride, and 0.5 mL 0.008 M potassium ferricyanide. The reaction was carried out for 10 min at room temperature in daylight. The absorbance of each mixture was measured at λmax = 720 nm. Tannic acid (10-100 µg/mL) was used as a standard and the results were expressed as mg tannic acid equivalent (TAE) per g of wine extract dry weight. The estimation of TTC values was performed in triplicate.
Determination of Total Anthocyanin Content
Total Anthocyanin Content (TAC) was determined by the pH differential method37,38 which is based on the structural transformation of anthocyanin as a function of pH in two buffer solutions: 0.025 M potassium chloride at pH 1.0 and 0.4 M sodium acetate at pH 4.5. Monomeric anthocyanins have little or no absorbance at pH 4.5, whereas polymeric or degraded forms absorb at this pH.
39
Two test tubes were prepared for each extract and 0.5 mL of stock solution was added to each. Then, 2 mL of pH 1.0 buffer was added to one tube and 2 mL of pH 4.5 buffer was added to the other tube. The reaction was performed for up to 50 min at room temperature in daylight, and the absorbance of each solution was measured at both λmax = 520 nm and 700 nm. The difference in absorbance between the pH 1.0 and pH 4.5 solutions was directly proportional to the concentration of TAC, expressed as mg malvidin-3-glucoside equivalents (M3GE) per g of wine extract dry weight and calculated using the following equation:
Determination of Antioxidant Activity
A number of different assays have been used to evaluate the antioxidant activity of plant extracts or products derived from plants. In this study, two tests were performed on the obtained wine extracts: the 2,2-diphenyl-1-picrylhydrazyl radical scavenging (DPPH) activity assay and the ferric-reducing antioxidant power (FRAP) assay.
DPPH Assay
The free radical scavenging activity of ethyl acetate and diethyl ether extracts of five red and white wine samples from Montenegro was measured by the DPPH method.
40
Briefly, a 0.1 mM solution of DPPH in methanol was prepared. 3 mL of the extract of the appropriate dilution and 1 mL of the DPPH solution were mixed in a test tube. The mixture was shaken vigorously and left in the dark at room temperature for 30 min. Then the absorbance was measured at λmax = 517 nm. Ascorbic acid was used as a reference standard. The experiment was performed in triplicate. The percentage of DPPH scavenging or inhibition (percentage of antioxidant activity, %AA) was calculated according to the equation:
FRAP Assay
The FRAP assay was used to determine the reducing capacity of the wine extracts. 41 First, the FRAP reagent was prepared by mixing 300 mM sodium acetate buffer solution at pH 3.6, 10 mM 2,4,6-tripyridyl-s-triazine (TPZT) diluted in 40 mM hydrochloric acid, and 20 mM ferric chloride in a ratio of 10:1:1. The reaction mixture was then prepared with 3 mL FRAP reagent, 1 mL distilled water, and 100 µL of each stock solution. Tubes were incubated at 37°C for 15 min. The tubes were then allowed to stand at room temperature for another 5 min and the absorbance was read at λmax = 595 nm. From the calibration curve of ferrous sulfate heptahydrate, used as a standard (0-1000 µmol/L), antioxidant capacity values were read and expressed as mmol Fe2+ equivalents per g of extract dry weight. The higher the concentration of Fe2+, the higher the iron-reducing antioxidant capacity.
Statistical Analysis
The obtained results were analyzed using the statistical software package Statistica 10.0. The relationship between the TPC, TFC, TTC and TAC in different wine extracts and the antioxidant potential (DPPH, FRAP) was evaluated using the Pearson correlation coefficient (p < 0.05). The obtained correlation coefficients (r) were evaluated as follows: −1-0.3 (no correlation); 0.3-0.5 (low correlation); 0.5-0.7 (medium correlation); 0.7-0.9 (high correlation); 0.9-1 (very high correlation).
Results
Extraction Yields
The liquid-liquid extraction procedure applied to five wine samples, both red and white varieties, yielded 0.43-1.91 g of extract per 100 mL of wine (Table 2). When comparing the solvents used, a higher yield was observed with ethyl acetate than with diethyl ether, the difference being more than three times in some cases (eg, E1 and E6). When ethyl acetate was used, the highest amount of extract was obtained from the homemade wine samples of red grape variety Kratošija (1.91 and 1.51 g/100 mL for extracts E1 and E2, respectively). However, in the case of diethyl ether, no significant difference was observed among the extracted wines (0.43-0.48 g/100 mL).
Wine Extracts Yields.

Extract names as reported in Table 1.
Expressed as g per 100 mL of wine sample (g/100 mL).
Phenolic Compounds Content in Wine Extracts
The determined contents of total phenolics (TPC), flavonoids (TFC), tannins (TTC) and anthocyanins (TAC) are shown in Table 3. The overall results suggest that ethyl acetate is more effective than diethyl ether in extracting phenolic compounds from wine. With a few exceptions in the case of TTC analysis, this pattern was particularly evident in the case of TAC.
Total Phenolic (TPC), Flavonoid (TFC), Tannin (TTC) and Anthocyanin Contents (TAC) in Different Wine Extracts; Values Represent Mean + SD of Three Measurements (n = 3).

GAE–gallic acid equivalent.
QE–quercetin equivalent.
TAE–tannic acid equivalent.
M3GE–malvidin-3-glucoside equivalent.
n.d.–not detected with the standard concentration range.
Regarding the content of total phenolics, similar values were recorded in all the extracts (40.38-63.11 mg GAE/g). Interestingly, no particular difference was observed when comparing red and white wines, nor between industrial and private production. The content of flavonoids ranged from 4.27 (E10) to 38.73 mg QE/g (E1), and none were not detected in the Krstač sample (E3 and E8). The analysis of tannin content showed variations in the values among the extracts. The highest amount was recorded in extracts E3 and E4 (20.53 and 19.67 mg TAE/g, respectively), while the extract E5 contained the least TTC (7.03 mg TAE/g), the value of which was almost 3 times lower. Regarding the anthocyanin content, red wine extracts contained up to 10.91 mg M3GE/g (E1), whereas the maximum TAC value in the white wine extracts was only 1.65 M3GE/g (E5).
Antioxidant Capacity of Wine Extracts
The antioxidant potential determined by the DPPH test was expressed in terms of IC50 (µg/mL) (Table 4). The values for red wine samples ranged from 31.15 to 105.1 µg/mL, while in the case of white wine samples, the activity was much lower, with IC50 ranging from 93.76 to 424.91 µg/mL. FRAP values were expressed in mmol Fe2+ per g extract (Table 4). All the extracts showed a significant antioxidant capacity, especially those from red wines, whose reducing power ranged from 17.29 to 43.52 mmol Fe2+/g.
Antioxidant Capacities of the Wine Extracts Examined; Values Represent Mean + SD of Three Measurements (n = 3).
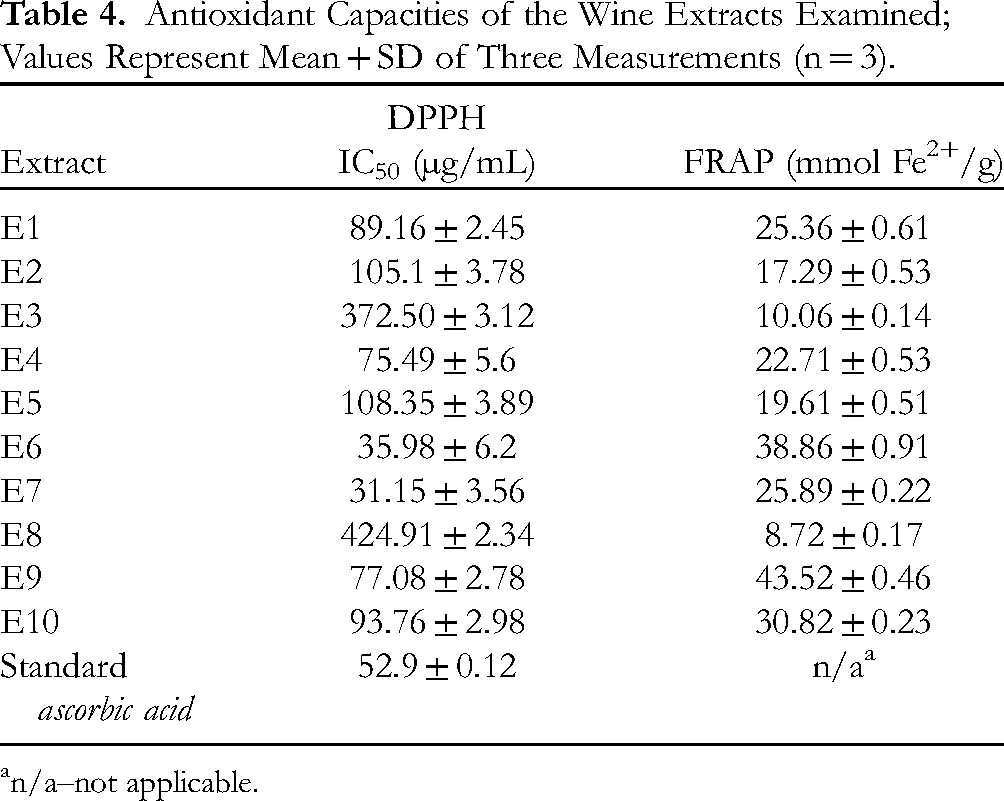
n/a–not applicable.
Based on the results presented herein, the extracts obtained with diethyl ether showed better antioxidant activity than those obtained with ethyl acetate, with a few exceptions (E3 and E8, E4 and E9). This is particularly evident in the case of the samples from Kratošija, where the difference in IC50 values was up to 3-fold (E2 and E7). Surprisingly, this contrasts with the phenolic content, which shows an inverse abundance with respect to the solvent used.
Discussion
Phenolic Compounds Content
The content of bioactive compounds in wines depends on several factors including the type/sort and origin of grape and wine, the environmental conditions in which the source plant was grown, but also winemaking procedure and conditions of maturation and storage; in addition, when considering extracts, the solvent and method used for extraction are of great importance.42,43 Grapes are rich in polyphenolic compounds, 75% of which are found in the exocarp and seeds. 44 Although they originate mainly from the pulp of grape, these compounds are still considered to be the basic constituents of wine, in which more than 200 have been identified. 43 The concentration of phenolics rarely exceeds 2500 mg/L in commercial red wines, but is much lower in white wines (200-500 mg/L) due to differences in winemaking processes. 12 The literature is replete with data on wine as the most consumed grape product, with red wine usually tested diluted and white wine undiluted. 45 In addition, various waste products obtained during the winemaking process represent a cheap and significant source of bioactive molecules; their further use as food supplements or in pharmaceutical production is often emphasized. 46 Solid-liquid extractions are usually applied to these so-called oenological by-products and different extracts are obtained. Moreover, wines are concentrated and after the removal of the contained ethanol, lyophilized residues are often considered as extracts. 3 There are also few reports on the fractionation of wine resulting in aqueous and organic fractions containing different classes of polyphenolic compounds.16,47 However, to the best of the authors’ knowledge, there are no data on extracts obtained directly from wine using a liquid-liquid extraction procedure as performed and presented in this study. For this reason, the comparison of the results obtained and presented here with the data published in the literature is difficult and, in some cases, impossible. This is further complicated by the fact that different methods and/or methodological approaches were used, making the available data insufficient or often contradictory.
The results obtained in the present study showed the highest amounts of phenols in extracts E1 and E4 (63.11 and 63.02 mg GAE/g, respectively), while the extract E8 was characterized by the lowest TPC (40.38 mg GAE/g). With regard to other types of extracts found in the literature, similar values were observed. For example, the methanolic extracts from Brazilian Cabernet Sauvignon and Merlot pomace (both red varieties) contained 74.75 and 46.23 mg GAE/g, respectively. 48 However, much higher content (168.4 mg GAE/g) was reported for the hydroalcoholic pomace extract from Brazilian Merlot grapes. 49 The TPC values of 15.43 and 23.83 mg GAE/g (depending on pretreatment) were reported for the ethanolic extracts from the exocarp of the red grape Carignano from Italy. 7 Another study analyzed phenolics in the acetone extracts from the exocarp (from 22.73 to 43.75 mg GAE/g) of Cabernet Sauvignon, Kalecik Karası (red) and Narince (white) grape varieties from Turkey; however, the same study reported much higher TPC in the seed extracts (from 522.49 to 546.50 mg GAE/g). 4 The study was performed on the Greek red (Agiorgitiko and Xinomavro) and white (Assyrtico and Malagouzia) grape varieties; the TPC values reported for the dealcoholized and evaporated wines recovered with isopropanol were 265.4-267.1 and 81.1-155.7 mg GAE/g for red and white grape varieties, respectively. 3 Through the process of wine fractionation with ethyl acetate on the Italian red wine Montepulciano d'Abruzzo, several extracts were obtained with TPC values ranging from 60.78 to 199.31 mg GAE/g. 20 The same study also included extracts obtained from exocarp (TPC value from 27.04 to 31.56 mg GAE/g) and seeds (12.03 mg GAE/g).
Flavonoids, as a large family of polyphenolic compounds, typically account for about 85% of TPC in red wine, much less in white wine (about 16%).11,50,51 This complex group originates from different parts of the grape: flavonols, including quercetin as the most common one, and anthocyanins come from the exocarp, 52 while bunchstems (consisting of rachis with peduncles and pedicels) and seeds are the source of flavanols, mainly catechin and epicatechin, and their polymerized forms (proanthocyanidins or condensed tannins).53,54 Considering that up to 60% of the TPC in grapes is transferred to wine, 44 it seems inappropriate to compare the obtained TFC values in wine extracts with those in exocarp or seed extracts frequently found in the literature. Alternatively, the TFC value of wine can be used as a reference; 1 L of red wine contains on average 880 mg of flavonoids, mainly composed of anthocyanins (280 mg), flavanols (470 mg) and flavonols (69 mg), while white wine contains significantly less flavonoids (35 mg/L). 55 The result obtained in this study confirmed a significantly higher TFC in the tested red wine samples than in white wines (up to six times); moreover, flavonoids were not detected in the Krstač sample by the range of quercetin concentrations used as a standard. When comparing red wines, the lowest TFC was recorded in the sample of Kratošija from Piperi (E2 and E7). A wide range of TFC values has been reported in the literature; eg, white wines from Romania contained 16.74-63.65 and 93.85-122.7 mg QE/L (for Chardonnay and Royal Maidan, respectively), while TFC of 78.49-242.46 mg QE/L was reported for Pinot Noir (red variety). 56 Red Mandilaria, rose Aidani mavro and white Monemvassia wines from Greece contained 127, 17.5 and 22.7 mg QE/L, respectively. 57 However, the flavonoid contents were much lower in red wines from Serbia: 36.65 (Merlot), 39.4 (Portugieser) and 42.4 mg QE/L (Pinot Noir). 58
Tannins play an important role in oxidation processes and wine aging. 59 However, only the condensed forms are derived from grapes (mainly in the exocarp and seed)60,61 and these are polymerized flavanol units catechin and epicatechin (hence the name catechin tannins). These tannins are responsible for the organoleptic properties of wine, especially astringency. Hydrolyzable tannins, on the other hand, come from wood (the oak barrels in which the wine is fermented and/or aged, and are therefore often proposed as a marker of maturity) or are added to the wine during the production process as commercial tannin mixtures. The latter could explain their highest amount in the commercially produced wines, both Krstač (E3) and Vranac (E4). Moreover, the lower amount of these tannins in the homemade wines may also be related to the fact that the vast majority of homemade wines are less mature and/or unaged (the samples in this study were produced in the same year as the extraction), as well as storage and bottling factors. The final content of hydrolyzable tannins in aged wines can vary widely, from 0.4 to 50 mg/L. 12 However, the comparison of the TTC values presented here with literature data seems rather futile; as esters, these compounds are not particularly stable and can be easily hydrolyzed enzymatically or under acidic or alkaline conditions. 59
As important components of wine, both as pigments and as bioactive molecules, monomeric anthocyanins have been well studied. 62 Only 38% of these compounds can be transferred from grapes to wine, 44 where they are present at a concentration of 90 to 400 mg/L in red wine, with malvidin-3-glucoside and its derivatives usually being the most abundant and the main source of red color; anthocyanins are essentially absent in white wines.15,63 Based on the anthocyanin content analysis and the data obtained, the TAC values were significantly lower in the extracts obtained with diethyl ether. As expected, the difference between red and white wines was evident, with the latter not containing significant amounts of anthocyanins. Comparing the analyzed red wines and their extracts obtained with ethyl acetate, a slightly higher TAC value was reported for the Kratošija samples (10.91 and 10.31 mg M3GE/g for extracts E1 and E2, respectively) than for the Vranac sample (9.26 mg M3GE/g in extract E4). This trend was also observed for the diethyl ether extracts, but the values were too low to be relevant. Although some studies have reported similar TAC values for extracts (eg, 1.67 mg M3GE/g in the ethanolic extract of Cabernet Sauvignon pomace from Mexico), 64 it is not appropriate to compare wine extracts with those obtained from pomace, seeds or exocarp, the latter being the main source of monomeric anthocyanins. Moreover, as glycosides, these compounds are very unstable and susceptible to enzymatic hydrolysis, but also thermally sensitive. 65 These degradations are followed by a color change due to the formation of anthocyanidins, destabilized aglycons that spontaneously transform into colorless chalcones by opening their heterocycles. 62 All this may explain the lower content of these compounds in wine extracts and should be considered when performing the liquid-liquid extraction presented in this study. On the other hand, monomeric anthocyanins are known to tend to form more complex derivatives during winemaking or/and aging processes, not only with other compounds but also with each other (self-association), leading to changes in both color and structural balance. 66 These interactions usually involve flavanols, such as catechin, through the processes of co-pigmentation or polymerization, and some studies reported self-association that was particularly thermodynamically favored in the case of malvidin-3-glucoside. 67 In addition, pyranoanthocyanins are produced by cycloaddition of certain substances from wine (eg, acetaldehyde, pyruvic acid, vinylphenol) with the flavylium cation, forming a new pyran ring. 62 All these complexes are more stable to color and pH changes and less susceptible to degradation by light. 44 Since they are not present in the grape, but are eventually formed, their extraction from wine represents a particular enhancement of the total polyphenol content, thus offering a potentially higher bioactive potential.
Antioxidant Activity
The antioxidant potential can be measured by different assays with specific mechanisms of action; therefore, it is recommended to perform more than one type of antioxidant measurement to consider the different modes of action. In this context, the antioxidant activity of wine extracts was evaluated by two in vitro tests: the DPPH assay, which measures proton radical scavenging activity, and the FRAP method, which estimates the ability of an antioxidant to reduce ferric (Fe3+) to ferrous (Fe2+) ions. However, no significant differences in antioxidant capacity were observed. Nevertheless, it is quite difficult to compare the values obtained with those found in the literature, because different methods were used (such as the ability to neutralize the hydroxyl radical or the 2,2′-azino-bis(3-ethylbenzothiazoline-6-sulfonic acid) radical cation, the cupric reducing capacity or the inhibition of lipid peroxidation), but also different compounds were used as standards (eg, Trolox, butylated hydroxyanisole, butylated hydroxytoluene).
Remarkably strong antioxidant activity was observed in the diethyl ether extracts of both red wine samples from Kratošija: IC50 35.98 and 31.15 µg/mL for extracts E6 and E7, respectively (Table 4). The IC50 values of these extracts were even lower than those reported for ascorbic acid, which was used as a reference standard. The lowest activity was reported in the Krstač white wine sample: IC50 372.50 and 424.91 µg/mL for extracts E3 and E8, respectively. Interestingly, the extracts of the other white wine, Chardonnay, showed moderate antioxidant capacity (IC50 108.35 and 93.76 µg/mL for extracts E5 and E10, respectively). A review of the literature revealed promising antioxidant activity of various extracts. For example, the pomace extracts obtained from Brazilian Cabernet Sauvignon showed the highest antioxidant potential of the ethyl acetate extract with an IC50 of 13 µg/mL. 68 However, a hydroalcoholic pomace extract of Merlot, also from Brazil, had a much higher IC50 value of 160.40 µg/mL. 49 Strong activity was reported for the extract obtained from wine lees of Merlot, Syrah and Cabernet grapes of Greek origin, the IC50 value of which was 13.3 µg/mL. 69 Wine extracts obtained from the evaporated red (Agiorgitiko and Xinomavro) and white (Assyrtico and Malagouzia) wines of Greek origin were also tested; the extracts showed strong antioxidant activity with IC50 values ranging from 13.4 to 89.4 µg/mL. 3
The FRAP values obtained in this study (from 8.72 to 43.52 mmol Fe2+/g) are significantly higher than those reported in the literature for extracts from wine waste products of several red grape varieties originating in France (Grenache, Syrah, Alicante Bouchet, Mourvèdre, Carignan Noir and Counoise); FRAP ranged 0.105-0.266 and 0.176-0.267 mmol Fe2+/g for the exocarp and seed extracts, respectively. 70 Similar activity was found for extracts from Greek white (Monemvassia) and red (Mandilaria and Aidani mavro) grapes, with the FRAP values ranging from 0.03 to 0.12, from 0.21 to 0.32, and from 0.18 to 1.4 mmol Fe2+/g for the grape, pomace, and bunchstems extracts, respectively. 57
Correlation between Antioxidant Capacity and Phenolic Compounds Content
A large number of studies reported a very high degree of correlation between phenolic content, especially flavonoids, and antioxidant activity.7172–73 However, some studies indicated that anthocyanins may be less significantly correlated with antioxidant properties, making these reports still controversial.56,74 On the other hand, considering that the types and proportions of polyphenols in the pulp, exocarp and seeds of grape berries are quite different, 12 comparing the antioxidant properties of different types of extracts, or even confronting them with those reported for wines, may be misleading.
The correlation analysis results (Table 5) revealed a very strong statistically significant positive correlation between the TPC (r = 0.92, p˂0.05; r = 0.90, p˂0.05; for extracts obtained with both solvents) and the antioxidant potential values measured by the FRAP method. Additionally, high statistically significant positive correlations were found between the TFC (r = 0.82, p˂0.05; r = 0.83, p˂0.05; for extracts obtained with both solvents), TTC (r = 0.73, p˂0.05, for extracts obtained with diethyl ether), and the antioxidant potential values determined through the FRAP method. Statistically significant negative correlations were also noted between the content of all the tested compound groups in all extracts and the antioxidant potential values determined by the DPPH method.
Pearson's Correlation Coefficient (p < 0.05) for TPC, TFC, TTC, TAC and Antioxidant Capacity in Different Wine Extracts.

Abbreviations for bioactive compound groups and antioxidant activity assays as mentioned in the main text; ET – ethyl acetate, DE – diethyl ether.
Bold values represent strong correlations (p < 0.05).
Limitations of the Study
The extraction process is time-consuming which can be considered as a main limitation. Thermal degradation of anthocyanins might also be pointed out, taking into account the importance of this wine ingredients group, especially from an oenological point of view. Assessment of antioxidant activity is always preferable to be carried out with several tests.
Conclusion
This study presents an alternative method for the extraction of phenolic compounds from wine by a type of liquid-liquid extraction procedure carried out for the first time. The extracts obtained were characterized by high phenolic content and associated antioxidant potential.
It is known that the composition of wine polyphenols depends not only on the initial profile in the grapes but also on various chemical reactions that occur during and/or after vinification. 62 As a result, new molecules are formed, often with higher stability and, according to some studies, even better antioxidant activity. 75–77 As very unstable and easily oxidized forms, monomeric anthocyanins are particularly affected by these transformations, which gradually lead to the prevalence of derived forms, including co-pigments and polymeric/condensed products. 78 In addition, combined hydrolytic and autoxidative reactions are likely involved, as well as thermal degradations that occur prominently during the extraction process. All this can lead to the formation of aldehydes and phenolic acids as final derivatives, 79 thus significantly altering the chemical composition of the extracts obtained. Considering this from the point of view of synergism of co-occurring bioactive compounds, which often results in superior biological activities, the extraction of these compounds from wine can be a challenging approach that allows to set the basis for many further researches. On the other hand, alcohol-related restrictions on wine consumption should also be considered, as well as the use of sulfur dioxide as a common exogenous additive that is often associated (in more than 15% of consumers) with an allergic reaction. 43
Footnotes
Acknowledgments
The authors are thankful to Mr Boško Božović and Mr Borislav Ivanović for providing the wine samples.
Authors’ Contribution
Conceptualization: MB; Methodology: MB, DP, DC, MM, RR; Writing – original draft preparation: MB, DP; Writing – review and editing: MB, DP, DC, MM, RR; All authors approved the final version of the manuscript.
Data AvailabilityInterests
The authors confirm that the data supporting of this study are available within the article.
Declaration of Conflicting Interests
The authors declared no potential conflicts of interest with respect to the research, authorship, and/or publication of this article.
Funding
The authors received no financial support for the research, authorship, and/or publication of this article.
Ethical Approval
Ethical Approval is not applicable for this article.
Statement of Human and Animal Rights
This article does not contain any studies with human or animal subjects.
Statement of Informed Consent
There are no human subjects in this article and informed consent is not applicable.