
Abstract
Objective/Background
Curcumin is a phenolic molecule found in turmeric, it has a wide range of pharmacological actions and is being studied in clinical investigations for the treatment of many illnesses. The durability of turmeric as a natural coloring agent in various media is not well understood. Numerous variables including additives can change the stability of turmeric. Therefore, it is interesting to investigate the stability of turmeric in different additive combinations.
Methods
To examine the following three main areas: (1) the impact of different additives (green and black tea) on the kinetic analysis and chemical stability of commercial turmeric as a natural mixture of curcuminoids. (2) Study the adsorption of Cr (III) by raw turmeric powder hangover and (3) the anticancer activity of both turmeric raw material and black tea.
Results
Investigations of the extract on human cancer cells as breast, colon and liver using Sulphorhodamine B (SRB) assay method shwoed a good anticancer activity of black tea and the extracted turmeric raw material.
Conclusion
Raw turmeric powder hangover has effect on adsorption of heavy metal, also curcumin and black tea extract have anticancer activity against the tested cancer cells, IC50 value ranged from 0.25 to 2.5 μg/ml.
Introduction
The hydrophobic polyphenol curcumin is obtained from the rhizome of the Curcuma longa herb. 1 The phytochemical curcumin gives turmeric its yellow color and is mostly responsible for the herb's medicinal properties.The physiochemical and antioxidant characteristics are determined by its keto enol-enolate equilibrium. 2
Numerous biological activities of curcumin(the primary yellow bioactive component of turmeric) have been demonstrated, it has anti-inflammatory, antioxidant, antimutagenic, anticarcinogenic, anticoagulant, antifertility, antidiabetic, antibacterial, antifungal, antiprotozoal, antiviral, antifibrotic, antivenom, antiulcer, hypotensive and hypocholesteremic properties. 3 Its anti-inflammatory, anticancer and antioxidant properties can be used in therapeutic settings to manage the pathophysiology of oxidative stress, carcinogenesis and rheumatism. 4 Numerous chronic maladies, including cancer, lung disorders, neurological, hepatic, metabolic, autoimmune and cardiovascular diseases have been demonstrated to get benefits from the therapeutic or preventive effects of curcumin. The presence of OH groups in the phenolic ring is necessary for curcumnoids to have anticancer effects as the free radicals receive their electrons from these groups. 5
Curcumin has been described as a good molecule for the treatment and prevention of a wide range of human disorders, particularly for cancer therapies. Even when taken at very large doses, it has showed to be safe. 6 The chemical underpinning of curcumin's binding behavior was presented due to its unique chemical characteristics, curcumin may interact with a wide range of molecules and consequently negatively impact several critical pathways in cancer cells, ultimately leading to their mortality. Actually, at least in vitro, curcumin can have fatal consequences in almost every kind of cancer. 7
Invasive ductal carcinoma is the most prevalent subtype in breast cancer. Invasive lobular carcinoma (ILC) has a prevalence of 10% and (IDS NOS) which accounts for 75% of the cases. 8 Globally, chronic liver disorders represent a significant medical issue, although there are medications that target certain etiologies of liver illnesses, there is currently no medicine or prescription that can reverse the progression of cirrhosis and hepatic fibrosis. 9 Turmeric contains a naturally occurring chemical called curcumin. Its function in the control of biological systems implicated in liver damage has been revealed by several investigations. As demonstrated in both in vitro and in vivo models of chronic liver damage. 10 Numerous investigations have demonstrated that curcuminoid compounds can reduce lipid peroxidation caused by free radicals, therefore acting as free-radical scavengers. 11
A malignant tumor with a high rate of morbidity and death is colon cancer. It is the third most common cause of cancer-related mortality globally and the fourth most prevalent kind of cancer. Adenomatous polyposis coli (APC), the tumor suppressor gene that generates the APC protein is the most frequently altered gene in colon cancer. This protein acts as the catenin protein's brake. If there is no APC catenin goes into raw turmeric powder hangover as adsorbent additional proteins are activated by the nucleus, which binds to DNA. 12
To make raw turmeric powder hangover an effective treatment for toxic metal effects, other elements must be considered. Chromium is a heavy metal that occurs naturally and is often found in the forms of trivalent Cr(III) and hexavalent Cr(VI) in the environment. Because chromium cannot be broken down by the body, it accumulates in living things and can create a number of health issues when it is present in lakes and streams. For instance, the tanning process produces two forms of chrome trivalent and hexavalent, with the hexavalent form being hazardous. 13 Chromium alum and chromium (III) sulfate are employed to manufacture both forms of chrome. This section aims to evaluate the overall efficacy of using raw turmeric powder as an inexpensive adsorbent for the removal of Cr(III) ions from aqueous solutions.
In the US, one of the most widely used and well-liked dietary supplements is green tea. Green tea has become a trendy ingredient in the expanding market for functional foods and nutraceuticals due to a variety of health claims. While there are various polyphenolic components in green tea extract that have antioxidant qualities, the most potent antioxidants are the flavanol monomers called catechins, of which epicatechin-3-gallate and epigallocatechin-3-gallate are the most common. Other catechins including epicatechin and epigallocatechin are also active ingredients in green tea extract. The unique flavor, color and scent of green tea are also attributed to its polyphenols. 14
The majority of research on green tea's antioxidant properties focus exclusively on the extracts’ total phenolic content, ignoring the contributions of distinct compounds, although a number of catechins, including EGCg, ECg and EGC, have been connected to potent antioxidant activity in extracts from green tea. 15 The presence of high quantities of flavonoids is thought to be substantially responsible for the health benefits. Green tea may help lower the risk of cardiovascular disease and various types of cancer, as well as improving the dental health, according to recent human research. Furthermore, green tea has strong antibacterial, anti-inflammatory, antioxidant and thermogenic qualities. 16 The aim of the present work is to examine the impact of different additives (green and black tea) on the kinetic analysis and chemical stability of commercial turmeric as a natural mixture of curcuminoids. In addition to assesment of the anticancer activity of both turmeric raw material and black tea.
Materials and Methods
All the materials used throughout this study were of analytical-grade reagents and the degradation, stability experiments were carried out at room temperature (25 ± 2 °C).
Turmeric Solution
After grinding the raw material, 20 grams of turmeric powder were dissolved in 1000 milliliters (900 milliliters of bidistilled water and 100 milliliters of ethanol) to create a stock solution.These solutions fared really well in the opaque bottle stopper.Through using the formula C = A/ε, different concentrations of turmeric were calculated and generated by diluting the stock solution. 17
Green and Black Tea
By dissolving 20 grams of green tea and black tea powder in 500 milliliters of bidistilled water, a stock solution of green and black tea was created and the concentration of green tea was determined using the formula C = A/ε. 18 These solutions fared really well in the opaque bottle stopper. Dilution was used to create further concentrations (0.1 M, 0.15 M, and 0.2 M) from the stock solution.
Preparation of Stock Chromium (III) Chloride Solution
53.29 g of chromium (III) chloride were dissolved in 200 ml of bi-distilled water to create a stock solution. These solutions fared really well in the opaque bottle stopper. Dilution was used to create additional concentrations from the stock solution.
The Preparation of raw Turmeric Powder Hangover
After being thoroughly cleaned with distilled water and repeatedly boiling to eliminate the yellow hue, the raw turmeric powder is allowed to dry fully before being stored in a plastic container until it is needed.
Preparation of Ethyl Acetate Extract of Turmeric Raw Material and Black Tea
The turmeric raw material and black tea leaves were dried in an oven at 40 °C until a constant Weight was measured and recorded. After being dried and broken into small bits, the leaves were processed into a powder using a mill grinder. The following was done when using ethyl acetate (Friedemann Schmidt, Parkwood, WA, USA) as an organic solvent to extract the plant constituents: In order to obtain crude ethyl acetate extracts, the following steps were taken: a) 500 ml of 70% aqueous ethanol was combined with 250 g of powdered leaves in a sterile flask and placed in a water bath at 40 °C for one hour; b) the mixture was stirred for seven days at 18–24 °C in the dark to ensure thorough maceration; c) the suspension was filtered using Whatman paper (Thermo Fisher Scientific, Inc., Waltham, MA, USA), and then evaporated using a rota d) the extract was allowed to fully evaporate for five days at room temperature (20-26 °C), after the solvent was separated. Finally, e) 10 mg of the crude extract was diluted with 100 μl of dimethyl sulfoxide (DMSO) as a stock solution for bioactivity tests. The crude extract weighed 3.723 g and the extraction yield was 30% of the ethyl acetate yield. 19
Cancer Cell Lines
The American Type Culture Collection (ATCC) in Manassas, Virginia, USA provided the liver cancer cell (HEPG2), breast camcer cell (MCF-7) and colone cancer cell (HCT-116). The RPMI-1640 medium that used to cultivate cell lines contained fetal bovine serum (FBS; 10%), streptomycin (100 μg/ml) and penicillin (100 U/ml). The cells were cultured in a humidified culture incubator at 37 °C with 5% (v/v) CO2.
Cytotoxicity Assay
Sulforhoda-mine-B (SRB) assay, was applyed to detect the cytotoxicity of the ethyl acetate extract of raw turmeric material and black tea was evaluated in MCF-7, HepG2 and (HCT-116) cells. Using 0.25% Trypsin-EDTA, the exponentially developing cells were collected and planted at a density of 2000 cells per well in 96-well plates. Following a 72-h treatment with the plant extract, the cells were fixed for one hour at 4 °C using 10% trichloroacetic acid (TCA). The cells were subjected to 0.4% SRB for 10 min at room temperature in a dark environment after multiple washings with distilled water. They were then cleaned with 1% glacial acetic acid. The SRB-stained cells were dissolved in Tris-HCl once the plates had dried for the whole night. At 540 nm, color intensity was measured using a Microplate reader, Spectra-Max® ELISA (Molecular Devices LLC, San Jose, CA, USA). Ultimately, each cell line's half maximum inhibitory concentration (IC50) for the plant extract was determined. 20
UV-Visible Absorption Spectroscopy
Various readings will be obtained if the reading is done in cells with various pathlengths. More light will be absorbed since it must travel through more compound and solution as the pathlength lengthens. Thus, solutions containing different quantities of turmeric were made and subjected to a defined wavelength of analysis. Maximum wavelength solutions were used to measure the absorbance-concentration curves (Figure 1), which showed a concentration range of 2 × 10⁻⁵–6 × 10⁻⁵ M. At high concentrations, wide peaks with a red shift have been noticed, as turmeric have various binding affinities for the aggregates.

UV-Vis spectrophotometric of turmeric (Curcuma longa) at different concentration.
Statistical Analysis
The statistical package for social sciences Sigmaplot computer program (version 10) was used for statistical analysis of the results. The data were expressed as mean ± S.E. Differences were considered statistically significant at (P < 0.05).
Results and Discussion
Stability and Kinetic Analysis of Turmeric
Curcumin, a phenolic molecule found in turmeric, has a wide range of pharmacological actions and is being studied in clinical settings for the treatment of many illnesses. It is always sautéed with other aromatic compounds at the start of the cooking process. 3 The major impact of different additions on the kinetic analysis and chemical stability of commercial turmeric as a natural curcuminoid combination was the main focus of this investigation. Research was done on its antioxidant treatments (green and black tea). The turmeric's UV-visible absorption spectra was obtained at various time intervals under diverse settings. By comparing the reaction mixture's initial absorbance with those at various test periods, the stability percentage was computed, with the findings reported as a percentage of absorbance reduction. Stability percentage was computed as the product of the absorbance values after storage divided by the initial reading at constant λmax 448 nm. The kinetic results obtained from the experiments were analyzed using different kinetic models, pseudo first-order and second-order reaction kinetic model. The model parameter k as well as the correlation coefficient (R2) was evaluated.
UV Analysis for Effect of Green and Black Tea
One of the most popular drinks in the world is tea. Food additives containing green tea polyphenols have been utilized to enhance the antioxidant qualities and shelf life of several foods.Strong antioxidants, the catechin polyphenol chemicals are present in many plants and play a significant role in tea leaves. Green tea is one of the main sources of catechin. 21
In the range of (0.1, 0.15, and 0.2 M), the impact of the starting concentrations of both black and green tea on the stability of turmeric was investigated by bleaching colored material. The antioxidant of turmeric stability in the presence of green and black tea was assessed in terms of hydrogen-donating or radical scavenging activity. Absorbance was measured at λmax 448 nm every hour up to the seventh hour.
According to the findings from the UV-Vis spectra, at lower concentrations of tea, there was no change in the absorbance intensity values (Figures 2, 3). However, as the concentration of tea increased, there was a minor shift in the absorbance intensity of turmeric, with green tea having considerably greater intensity values than black tea. The beginning of each green and its stability have a significant impact on the proportion of turmeric. found the initial levels of both black and green tea declined as the stability of turmeric rose. The pH may have dropped to (about 3.6). Turmeric's keto form predominates in acidic environments making it an incredibly powerful H-atom donor. After six hours, the percentages of turmeric stability in the presence of 0.1 M black and green tea were 80.27% and 78.35%, respectively.According to these findings, turmeric that was combined with black and green tea showed more stability than turmeric that was taken alone. It was discovered that the degradation pattern depended on the antioxidant media. Based on their capacity to donate hydrogen, the majority of phenolic compounds have antioxidant activity. 22 Particularly, hydrogen donation ability of turmeric may be due to the presence of bulky alkyl group at ortho position with respect to phenolic hydroxyl group. 23 Three sites one active methylene group and two phenolic -OH groups ortho to the electron-releasing OCH3 group are where turmeric donates hydrogen.Catechins are important ingredients from leaves of tea. They belong to the class of chemicals known as polyphenols. The compounds with established antioxidant properties are called catechins. Turmeric can form a potent antioxidant when added with catechins. 20 Since it contains less phenolic-OH group than turmeric in combination with green and black tea, pure turmeric solution has less potential for proton donation than turmeric in these combinations. Considering that phenolic OH is mostly responsible for turmeric's action. Based on the following reaction, we have studied the interaction between turmeric and the hydroxyl radical (OH•):

UV-Vis spectrophotometric of turmeric (Curcuma longa) in presence of different green tea concentration at zero h.

UV-Vis spectrophotometric of turmeric (Curcuma longa) in presence of different black tea concentration at zero h.
OH• + turmeric -OH → H2O + turmeric -O•
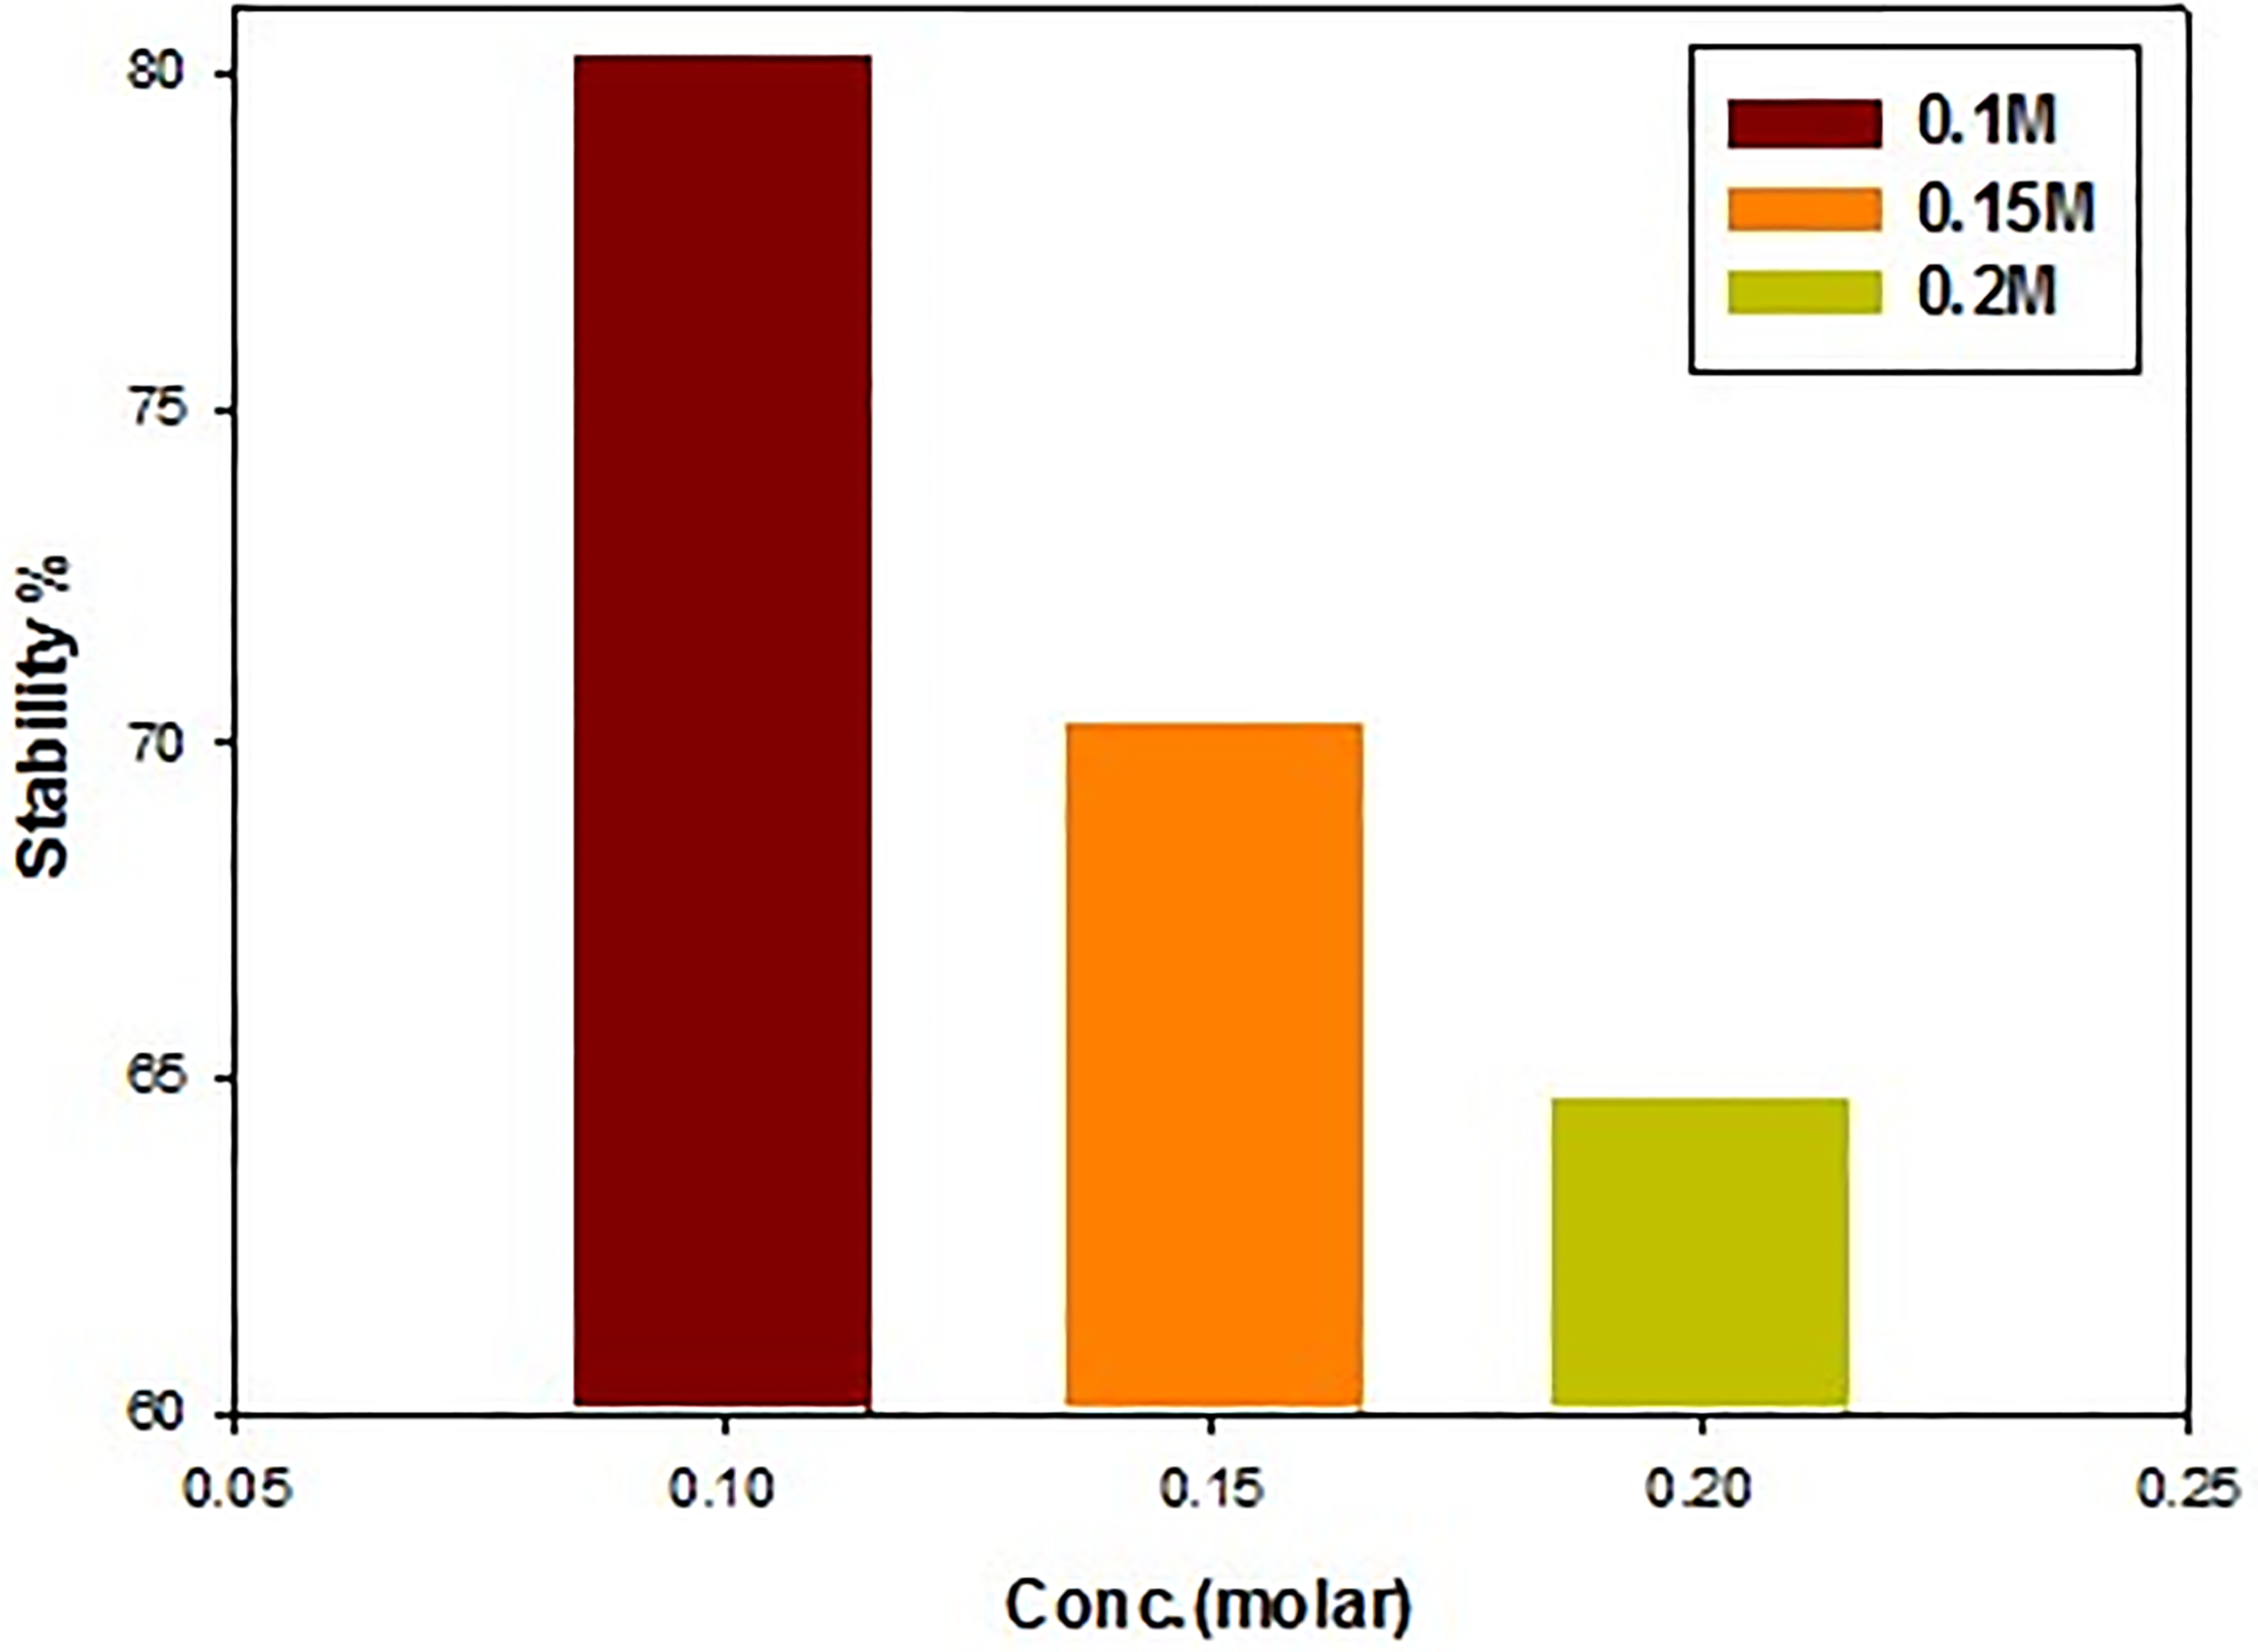
The percentage of turmeric stability increased from 64.71% to 78.34% and from 67.00% to 80.26% after added black and green tea respectively when tea solution was increased from 0.1 to 0.2 M, (Figures 4–6) Indicating that the hydrogen ions and hydroxyl ions play an important role in antioxidant stability.

Stability of turmeric (Curcuma longa) in presence of different green tea concentration after 6 h.
Stability of turmeric (Curcuma longa) in presence of different black tea concentration after 6 h.

Stability of turmeric (Curcuma longa) in presence of different green and black tea concentration after 6 h.
Degradation Kinetic Analysis of Turmeric Dye Under various Additives
Chemical reaction kinetics is defined as the measurement of reaction velocity and the examination of experimental data to identify variables that impact the reaction, including reaction rate, reaction order and equations that provide information about the reaction's speed dependence on product concentration. We looked at the kinetic study of turmeric as a natural mixture of curcuminoid compounds with different additions. Pseudo first-order and second-order reaction kinetic models were utilized to examine the experimental kinetic data.A quartz cuvette was filled with the necessary quantity of each reactant in the previously mentioned order, and the absorbance of turmeric decreased with time for each reaction combination. To determine the decolorization rate, the absorbency of turmeric dye solutions with varying decolorization times was examined until the absorbency remained constant.A logarithmic concentration versus time plot was created and the half-life (t1/2), correlation coefficient (R2) and degradation constant (K) were computed from this data. It was obsreved that the absorbance at time 0 h was 100%.
Effect of Antioxidants on the Reaction Rate
A solution of turmeric dye with a concentration of (3 × 10⁻⁵M) prepared in 10% ethanol/distilled water. Different antioxidants concentrations (0.1, 0.15 and 0.2 M) were added to a constant turmeric concentration at 25 °C. For analysis, the spectrophotometer switched on and the wavelength adjusted to 448 nm. Samples were taken at time interval and the device absorbance reading was recorded. (Figures 7, 8) illustrate that the absorbance of turmeric in presence of green tea and black tea at different concentration performs a slight decrease with time.

UV-Vis spectrophotometric of turmeric in presence of (0.2 M) green tea at different times.

UV-Vis spectrophotometric of turmeric in presence of (0.2 M) black tea at different times.
The absorbance-time data plot of the above reaction orders was carried out to determine the rate constant, kobs and best order for the reaction process. The degradation kinetics rate of turmeric after adding black tea and green tea at different concentrations were studied. Kinetics models for a pseudo first-order at different antioxidants concentrations (Figures 9, 10) demonstrated a good fitting with a perfectly straight line and having a R2 values more than 0.9, for all experimental conditions (Table 1). This will demonstrate that a pseudo first order kinetics model is being followed by the degrading process. To validate this suggestion, a second order kinetic model is still required. The kinetic test for a second order process is presented in Table 1. These graphs show that the fitting is off from the second order model and that the degradation kinetics cannot be represented by a second order kinetic model. This is due to the fact that the R2 values in the preceding Table 1 are greater than those of the second order kinetic model when compared to first order kinetics. R2 values are > 0.8 for the second order kinetic model.This suggests that the disintegration of turmeric dye in the presence of black tea and green tea at different concentration is best fitted with first order reaction model.
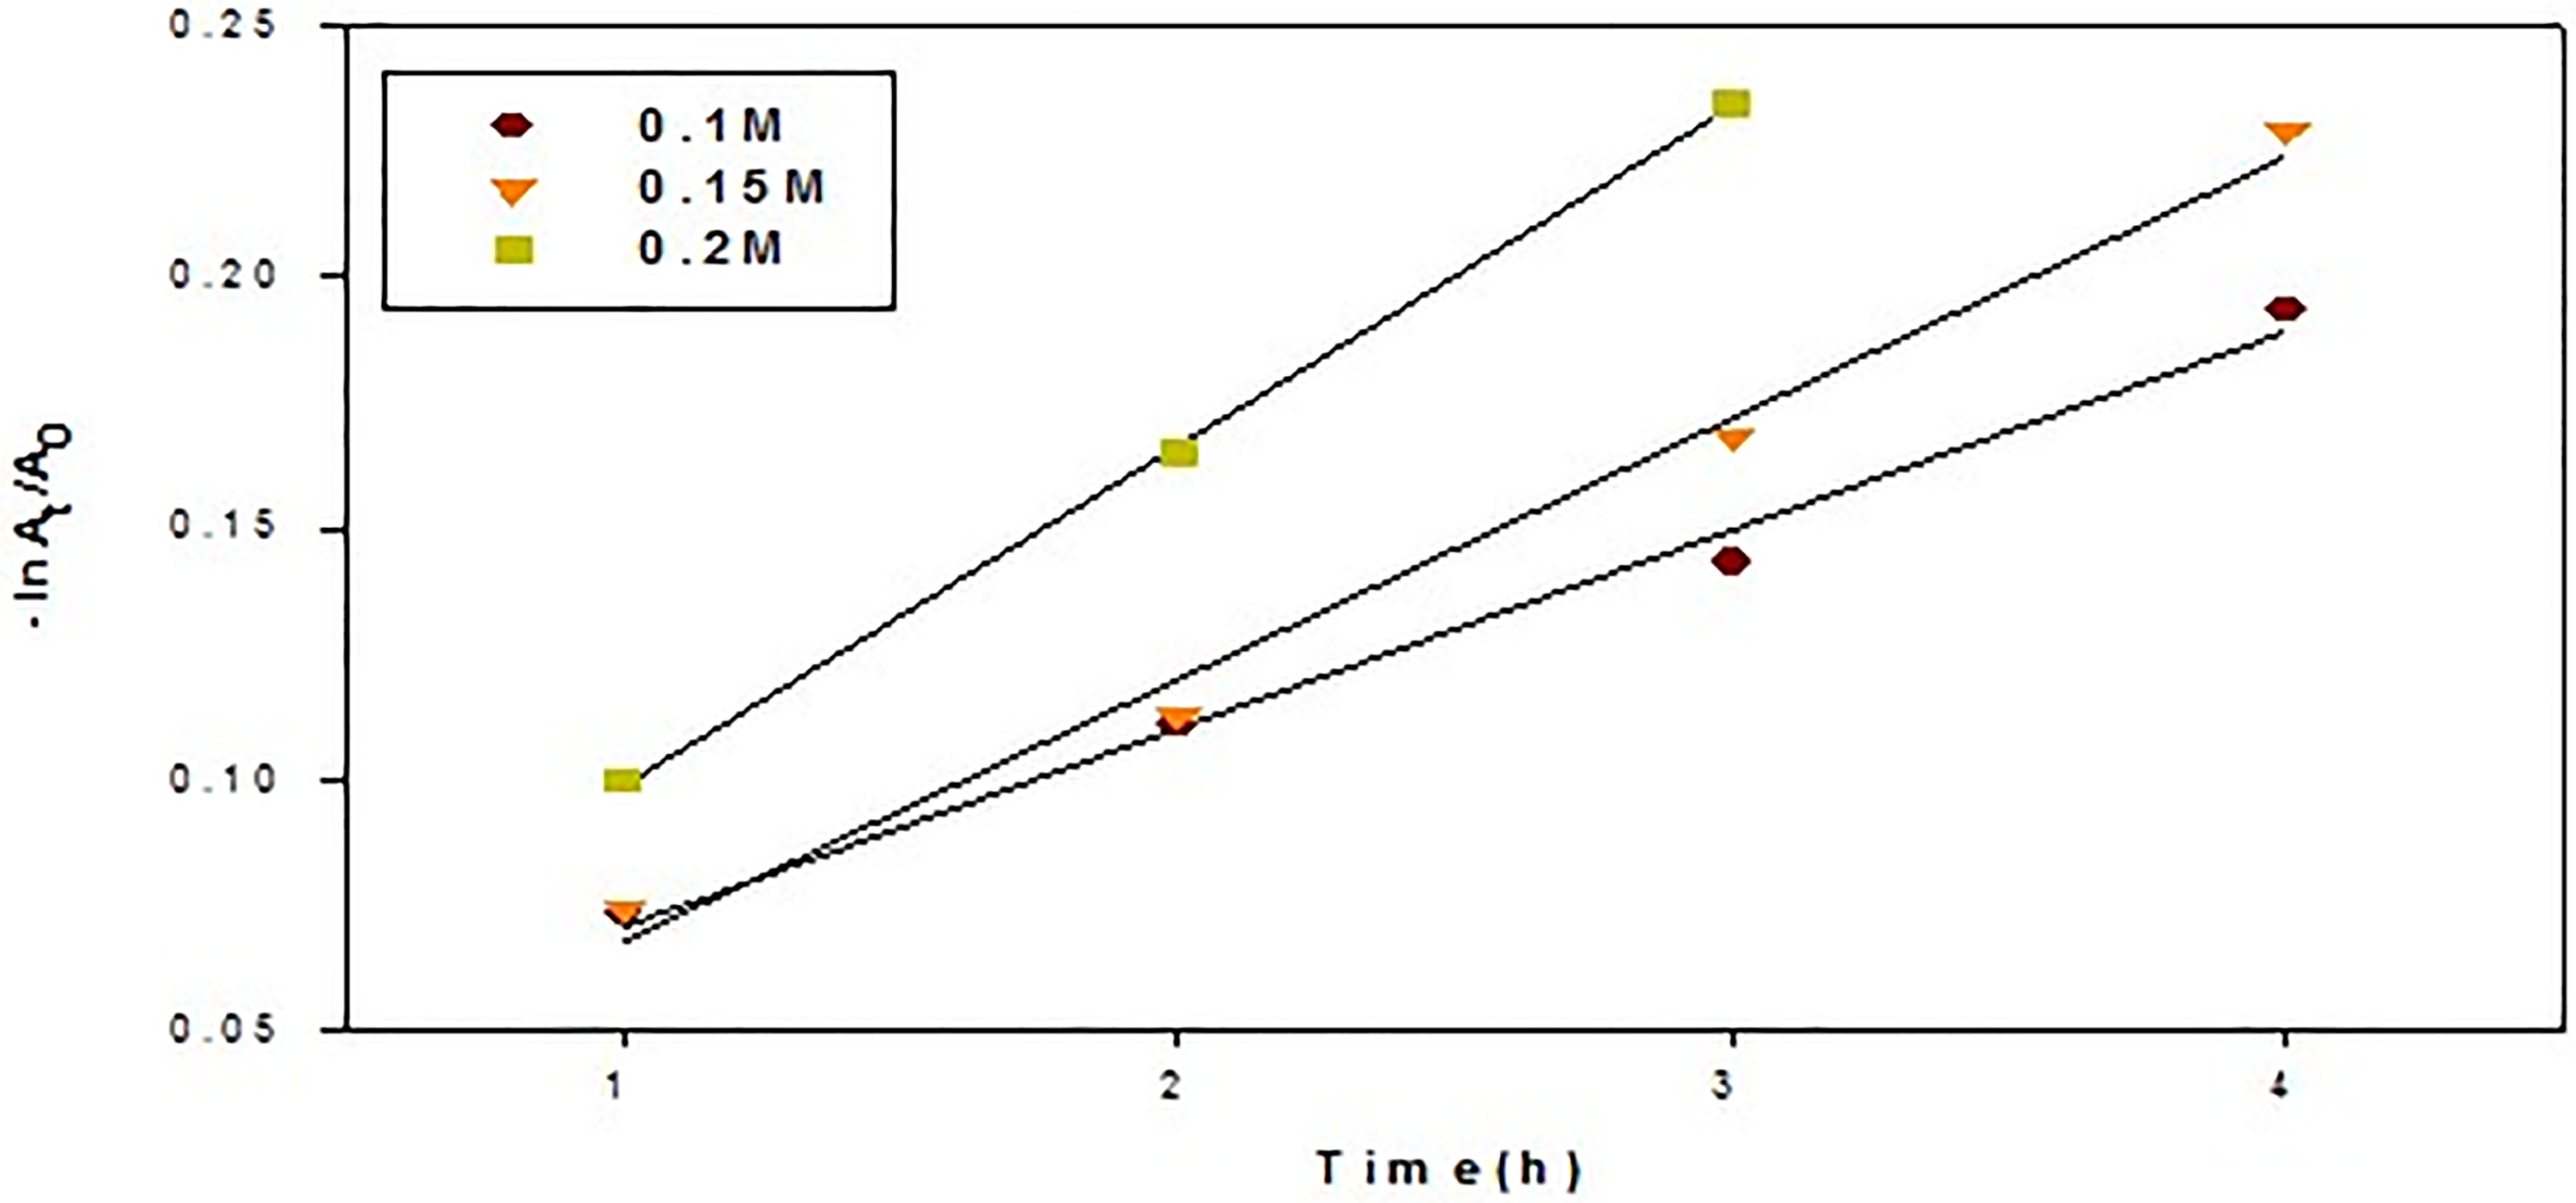
The pseudo first-order kinetic plots of turmeric after mixing with green tea at different concentration.

The pseudo first-order kinetic plots of turmeric after mixing with black tea at different concentration.
Pseudo First Order Constant (K1), Correlation Coefficient (R2), Half-Life (t1/2) and Pseudo Second Order Constant (K2) of Turmeric After Mixing with Green tea and Black tea at Different Concentrations.
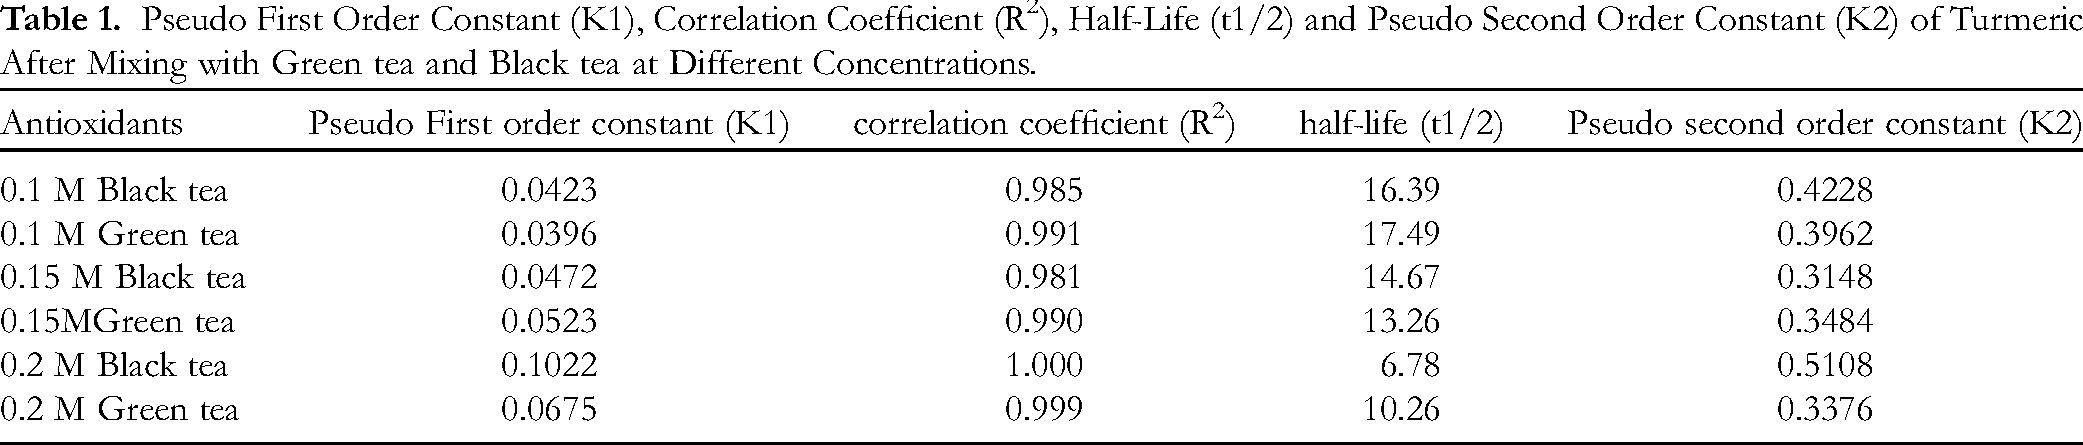
We have checked the pseudo first order and second order kinetics using our data on turmeric degradation in the presence of various concentrations of black and green tea. The rate constants (K1, K2) were found using the plots’ computed slopes and intercepts. The regression coefficient, K1, K2 values are given in (Table 1). The degradation rate showeda significant rise with an increase in antioxidant concentration from 0.1 to 0.2 M, with concentration 0.2 M showing the maximum degradation rate. Additionally, the shorter half life degradation time (t1/2) at the same concentration value is shown in (Table 1).
Turmeric as Adsorbent Agent
In addition to being a common culinary spice, turmeric is also utilized extensively in a variety of industrial processes, including textile manufacturing, leather tanning, electroplating, and nuclear power plants. 24 Turmeric is a potent treatment against the effects of heavy metals, but further considerations need to be investigated.
Characterization of Raw Turmeric Powder Hangover
Solid state analytical techniques including Fourier Transform Infrared Spectroscopy (FTIR) and scanning electron microscopy (SEM) were used to analyze the adsorbent.
Fourier Transform Infrared (FT-IR) Spectroscopy
Fourier Change Figure 11 displays the infrared spectroscopy results for both raw turmeric powder (RTP) and turmeric powder treated with Cr (III). The surface of (RTP) is mostly made up of polymeric OH, CH2, COO groups and OH groups, according to IR spectra. These groups are all well-known for their propensity for chelating heavy metals.

FT-IR spectrum of raw turmeric powder (RTP) before (A) and after (B) Cr (III) binding.
Transform of Fourier The RTP's infrared spectra revealed that the most noticeable peaks came from the hydroxyl group, which was likely caused by adsorbed water (3303.90 cm−1) and the asymmetric and symmetric stretching vibrations of CH2 and CH3 (2920.66 cm−1). Additionally, the spectrum showed a number of peaks that indicated the existence of several functional groups: Stretching of the many C-OH and C-O-C bonds (1000.80 cm−1), C = O stretching (1628.70 cm−1), CO chelate stretching (1515.03 cm−1), C-O stretching (1364.83 cm−1), and C-O anti symmetric stretching (1148.64 cm−1).
Certain spectral shifts suggested that certain functional groups on the raw turmeric powder's surface may be involved in the adsorption process.The spectrum after Cr (III) binding exhibited small shift in some bands and some bands were disappeared (1515.03cm−1). As seen in (Figure 11), the peak intensities were either reduced or slightly moved. certain spectral shifts suggested that certain functional groups on the raw turmeric powder's surface may be involved in the adsorption process.
The primary adsorption bands, which were centered at around (3274.73 cm−1), were found to have significantly decreased. As the peak's strength decreased, the carbonyl (C = 0) group's adsorption band moved to higher frequencies. Metal ions that formed bonds with carboxylate groups confirmed these results.In the 1629.76–524.91 cm−1 spectral range, several additional absorbances were found, which were attributed to the contributions of the different vibration modes of C coming from carbohydrates and lignin. 25 FTIR analyses showed that the number of functional groups which can bind with metal ions are present in (RTP). It is likely that the carboxyl and hydroxyl groups presented in (RTP) might be participating in the Cr (III) adsorption.
Scanning Electron Microscopy (SEM)
Figure 12 displays a SEM of raw turmeric powder (RTP) both before and after Cr (III) loading. It is evident that (RTP) contains a sizable number of pores that allow metal ions to be adsorbed and trapped. Following the binding of Cr (III), a noticeable alteration in the surface morphology of (RTP) was seen. 26

Scanning electron micrographs before (a) and after (b) Cr (III) loaded into raw turmeric powder (RTP). a- before adsorption. b-After adsorption.
Operating Conditions for Adsorption Capacity
Chemical, physical, and electrostatic forces may all be involved in the interactions between the adsorbate and the adsorbent surface. This kind of nonselective interaction is dependent on a number of variables, including the doses of the adsorbent, the pH of the solution, the starting ion concentration and the length of the contact. Several parametric parameters were profiled using batch experiment protocols. Kinetic equations were utilized to simulate the equilibrium data.
Effect of Adsorbent Dosages
One of the most important factors in the adsorption of any metal ions that formed bonds is the dosage of the adsorbent. It is the parameter that determines an adsorbent's capacity to design and process optimization of any large-scale adsorption column. The major economic motivations for researching how adsorbent dose affects adsorption dynamics are to determine an adsorbent's efficacy and a solute's capacity for minimal dosage adsorption. The number of adsorbents used was changed while maintaining other parameters constant at 25 °C in order to investigate the dependence of Cr (III) sorption on dosage.
Different concentrations of Cr (III) solutions were utilized, with different quantities of raw turmeric powder (RTP) adsorbent (2.5 g/L, 5 g/L, 7.5 g/L, 10 g/L, 12.5 g/L, 15 g/L, and 17.5 g/L) being used.Using a spectrophotometer set at the λmax, the concentration of Cr (III) solutions was measured before and after adsorption, and the percentage of adsorption was computed. The outcomes demonstrated that, in general, the adsorbent's adsorption efficiency increased with dosage. Based on the experimental findings, increasing the amount of raw turmeric powder (RTP) adsorbent from 2.5 g/l to 17.5 g/l while maintaining the other parameters resulted in an increase in Cr (III) adsorption from 18.81% to 46.10% (Figure 13). This is expected since the higher dose of increased availability of ion-exchangeable sites due to the adsorbents in the solution. With an RTP dosage of 12.5 g/L, the maximum adsorption of Cr (III) was attained. This implies that the quantity of ions bound to the adsorbent and the amount of free ions stay constant even with other additions of the adsorbent dosage, as the maximum adsorption occurs at a certain adsorbent dose. A partial aggregation that happens at high adsorbent concentrations and causes a reduction in active sites can be used to explain the results. 27
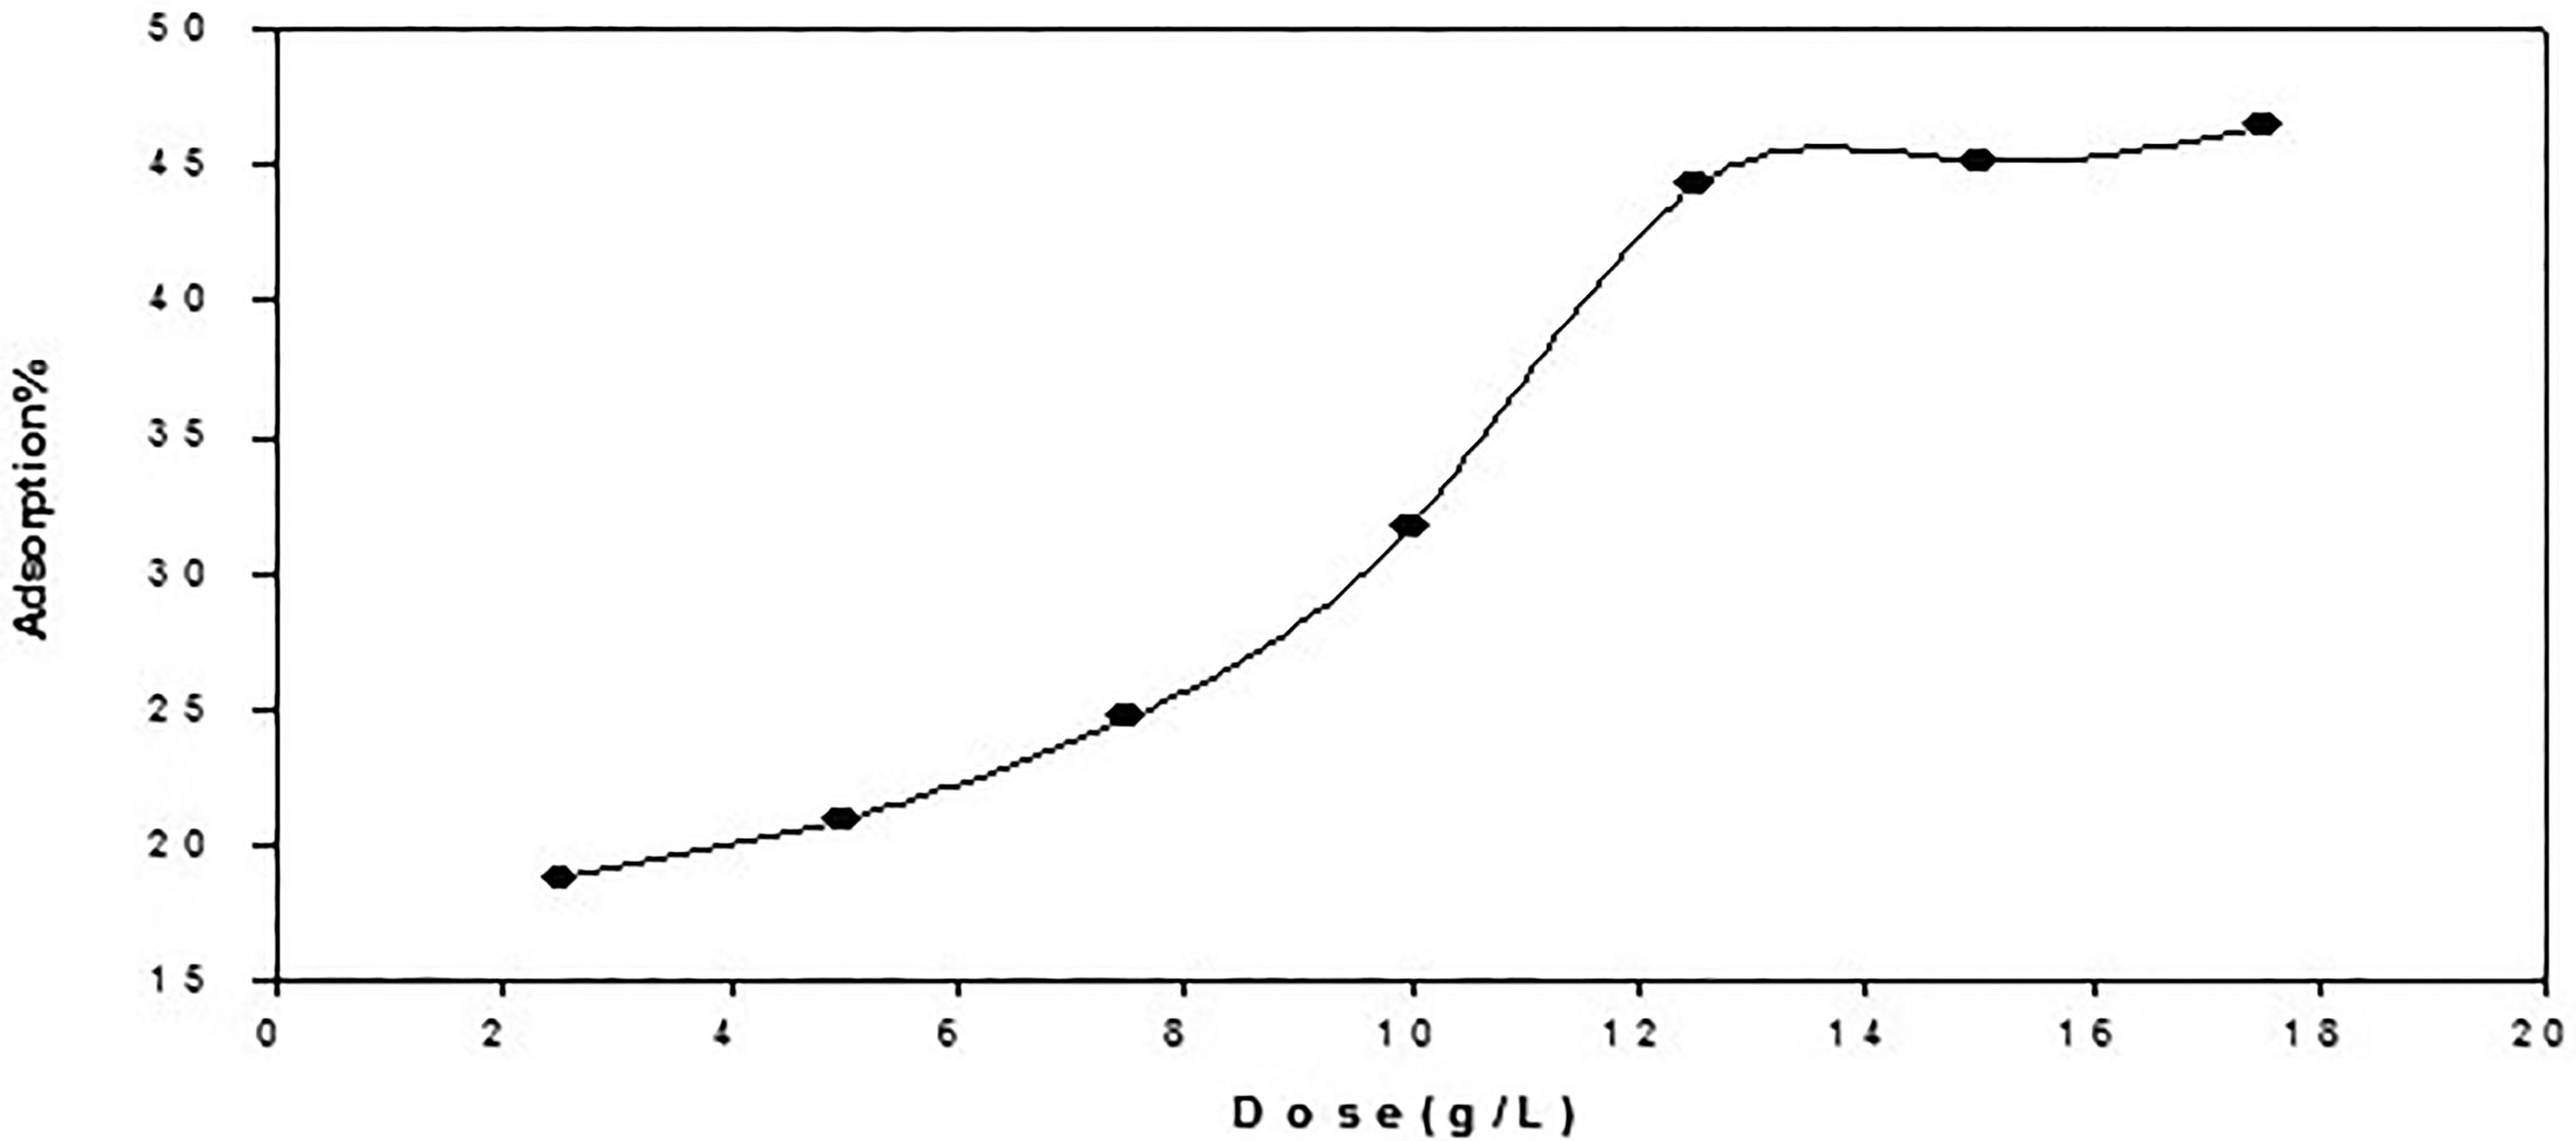
Effect of dose on the adsorption% of chromium (III) by raw turmeric powder, metal concentration 0.08 m mol, agitation time 1 h and 25 °c.
Effect of Initial Metal Ions Concentration
The broad definition of adsorption is the build-up of contaminants at the liquid-solid phase contact. Since the rate of adsorption depends on the initial concentration of metal ions, it is crucial to take this into account for efficient sorption. By creating an adsorbate solution with a fixed adsorbent dosage (12.5 g/l) and various beginning metal ion concentrations (0.05,0.06,0.07,0.08,0.09, and 0.1 m mol), to investigate the influence of initial Cr (III) concentration. The solution is then shaken for one hour until equilibrium is reached at a tempe rature of 25 °C. The direct relationship between the metal ion concentration and the number of binding sites that are accessible on an adsorbent surface determines the impact of the initial metal ion concentration factor. 27 Figure 14 displays the results about the uptake of Cr (III) onto raw turmeric powder (RTP) in relation to the starting concentration of metal ions. Surface saturation was reliant on the initial Cr (III) concentrations, despite the fact that adsorption% reduced as the initial concentration increased (Figure 14). The findings demonstrate that there are surplus Cr (III) ions in relation to accessible active sites on the adsorbent as the concentration of the starting metal ion rises. Consequently, the removal efficiency is inhibited by an increase in the initial concentration of metal ions. The experimental data shows that for an initial Cr (III) 0.05 m mol, adsorption% was almost 50.58% and when the concentration of Cr (III) increases to 0.1 m mol percentage removal was only 34.51%. This may be attributed to an increase in the driving force of the concentration gradient with increase in the initial metal ions concentration. At low concentrations adsorption sites took up the available metal ions more quickly. Where the available sites of adsorption are more hence higher adsorption yield is obtained. 28

Effect of Cr (III) concentration on adsorption % by raw turmeric powder, 12.5 g/l at agitation time 1 h.
Significantly degraded ions will diffuse more slowly at larger concentrations, and metal ions must diffuse to the adsorbent surface via intraparticle diffusion. 29 This is most likely due to the fact that, for a given adsorbent dosage, the total number of adsorption sites that are accessible is constant across all doses that are tested. when a result, when the initial sorbate concentrations have increased, the percentage of adsorption has significantly decreased. 30
Effect of Initial pH on Metal Ions Adsorption
Resolution The degree to which the adsorbate is ionized in the solution, the adsorbent's surface charge, and the dissociation of different functional groups on its active sites are all influenced by pH. 31
A change in pH has an impact on the sorption capacity by influencing the surface charge and level of ionization of the adsorbent surface. In order to determine the variation in adsorption potential of these adsorbents as a function of pH, the effect of pH on adsorption of Cr (III) ion was studied in the pH range (1.5-5) with constant optimum initial concentration (0.06 m.mol) of Cr (III), agitation time (1 h), and optimum dose of adsorbents (12.5 g/L). The temperature used for the experiment was 25 °C. By adding the necessary volume of 0.1N HCl or NaOH solutions, the pH of the solutions was changed. pH was determined in each instance following the addition of acid or base. After using adsorbents to shake the solution for one hour, the equilibrium concentration of metal ions was determined.
Many functional groups present on a surface, with a distinct site concentration. These surface-bound binding sites has the ability to take in or release protons into or out of the solution. These binding sites may be basic, acidic, or amphoteric, depending on the processes involved in protonation and deprotonation. Acidic sites undergo a pH shift from neutral to negatively charged when the pH rises, while basic sites become positively charged when the pH falls and remain neutral when the pH rises. 32
Surfaces of raw turmeric powder have negatively ionizing groups like carboxyl and phosphoryl groups. carboxyl groups are often the active sites in the acidic pH range. It was discovered that the pH of the solution and the surface speciation of the raw turmeric powder had a significant impact on the adsorption of Cr (III). The functional groups on the surface of turmeric are completely protonated at low pH levels (2.0). Polar functional groups like -COOH, -OH, etc, become more prevalent when the pH value of the solution rises. Therefore, negative charges on the surface of adsorbent also increased, enabling more positively charged metal ions to bond.
33
This mechanism favors the adsorption process until a maximum adsorption is reached, as shown in below.

Where, Mn + is predominant metal species. S denotes the surface of the adsorbent. Above pH values 4.5 since OH- ions increased the hindrance of diffusion as well as some of the cations may react with OH- metal ions precipitate and hinder the adsorption process. 34 It was observed from (Figure 15) that the adsorption efficiency of Cr (III) in the aqueous solution decreases at low pH values and increases with increasing pH of the solution. The maximum bio sorption of Cr (III) was observed at pH 4.5 with raw turmeric powder.

Effect of pH on adsorption % of Cr (III) by raw turmeric powder with adsorbent dose (12.5 g/l), initial dye concentration 0.06 m.mol and agitation time 1 h.
Effect of Contact Time on Cr (III) Adsorption
To provide understanding of a sorption process, the necessary contact time for sorption to be finished is crucial. Additionally, this offers details on the minimal amount of time needed for significant adsorption to occur as well as a potential mechanism for controlling the diffusion of the adsorbate as it goes from the bulk solution to the adsorbent surface. By creating an adsorbent–adsorbate solution with a constant adsorbent dosage (12.5 g/l) and starting metal ions concentration (0.06 m mol) at varying time intervals, one may investigate the impact of contact time on Cr (III) adsorption. It was investigated how long the contact time was for raw turmeric powder (RTP) to adsorb Cr (III) at 25 °C.
The findings shown in Figure 16 demonstrate that an increase in contact time prior to reaching equilibrium led to an increase in adsorption efficiency. This outcome is significant since equilibrium time is one of the key elements of a cost-effective wastewater treatment system. It is evident that increasing the contact period from one hour to two and a half boosted the efficacy of Cr (III) adsorption.

Effect of contact time on adsorption % of Cr (III) by raw turmeric powder, adsorbent dose (12.5 g/l),metal concentration 0.06 m mol.
Two phases make up the Cr (III) adsorption percentage: a first, fast-paced phase of sorption followed by a second, slower phase of equilibrium absorption. Adsorption happens instantly on the active sites of the adsorbent surface during the first phase, which is associated with external surface adsorption. This might be because the adsorbent's initial exposed surface area was available, given adsorption kinetics depends on the nature of active sites and the surface area of the adsorbent which has been attributed to chemisorptions. 34
The period of progressive adsorption that occurs prior to the equilibrium of Cr (III) absorption is known as the second phase. The kind and quantity of the surface groups, or “active sites,” that interact with the ions may have an impact on the variance in the amount of ions adsorbed by the adsorbent. The single, smooth, and continuous Cr (III) uptakes versus time curves that approach saturation point to a potential monolayer ion coverage on the adsorbent's surface. 35
Later phases of adsorption slowed slower because, while there may have been a lot of empty surface sites available for adsorption at first, forces between the solute molecules in the solid and bulk phase may have made it more difficult to occupy the remaining empty surface sites over time. 36 After one hour of contact, the adsorption percentage was 44.28%; as three hours passed, it rose to 65.25%. One possible explanation for the decreasing elimination with time mightbe the dominance of the intraparticle diffusion mechanism over adsorption. 37
Kinetic Studies
One of the key elements defining an adsorbent's efficiency is its adsorption kinetics, which controls the pace of reaction and, in turn, the habitation time. Conclusions regarding the adsorption rate and mechanism may be made with the use of kinetic constants. 38 By calculating the regression coefficients, the applicability of kinetic models, such as Elovich and intraparticle diffusion kinetics, was examined.
Elovich Model
The Elovich equation has previously been successfully used to describe the chemisorption of gas molecules onto the sorbent. The general explanation for this form of kinetic law involves a variation of the energy of chemisorption with the extent of surface coverage. Another plausible explanation could be that the active sites are heterogeneous in nature and therefore, exhibit different activation energies for chemisorptions. 34 Using equation Q = 1/σ(ϴσ) + 1/σln(t).
A plot of Q versus ln (t) should yield a linear relationship with a slope of (1/σ) and an intercept of 1/ σ ln(σ θ). The correlation coefficients of the plots of Q versus ln (t) (Figure 17) were 0.988 which indicates this model is not valid for this system. The constants of the Elovich equation σ, the initial adsorption rate and θ the desorption capacity that were obtained from the slope and intercept of the Elovich plot were 0.0389 and 5.53 respectively as shwon in Table 2.

The elovich model for the adsorption of Cr (III) by raw turmeric powder 12.5 g/l, initial metal concentration 0.06 m mol.
The Elovich Model for the Cr (III) Adsorption by raw Turmeric powder12.5 g/l, Initial Metal Concentration 0.06 m mol.

Intraparticle Diffusion Model
Adsorption is a multi-step process involving transport of the adsorbate molecules from the aqueous phase to the surface of the solid particles then followed by diffusion of the solute molecules into the pore interiors. If the experiment is a batch system with rapid stirring, there is a possibility that the transport of sorbate from solution into pores of the adsorbent is the rate-controlling step. 39 The intra-particle diffusion is commonly expressed by equation Q = kintt1/2. 35 The plot of the amount of Cr (III) ions adsorbed (Q mg/g) by raw turmeric powder at 25 °C versus t1/2 (Figure 18).The intraparticle diffusion rate constant kdif can be determined from the slope of the plot. The correlation coefficients of the straight-line the plots of Q versus ln (t) (Figure 18) Was 0.996 which indicates this model is valid for this system. This indicated that the molecular diffusion of water molecules on the surface of adsorbents played an important role in water removal capability of the adsorbents. The data fitted well to the pore diffusion model and the value for rate parameters, Kid was 41.17 mg/g min1/2 as shown in Table 3
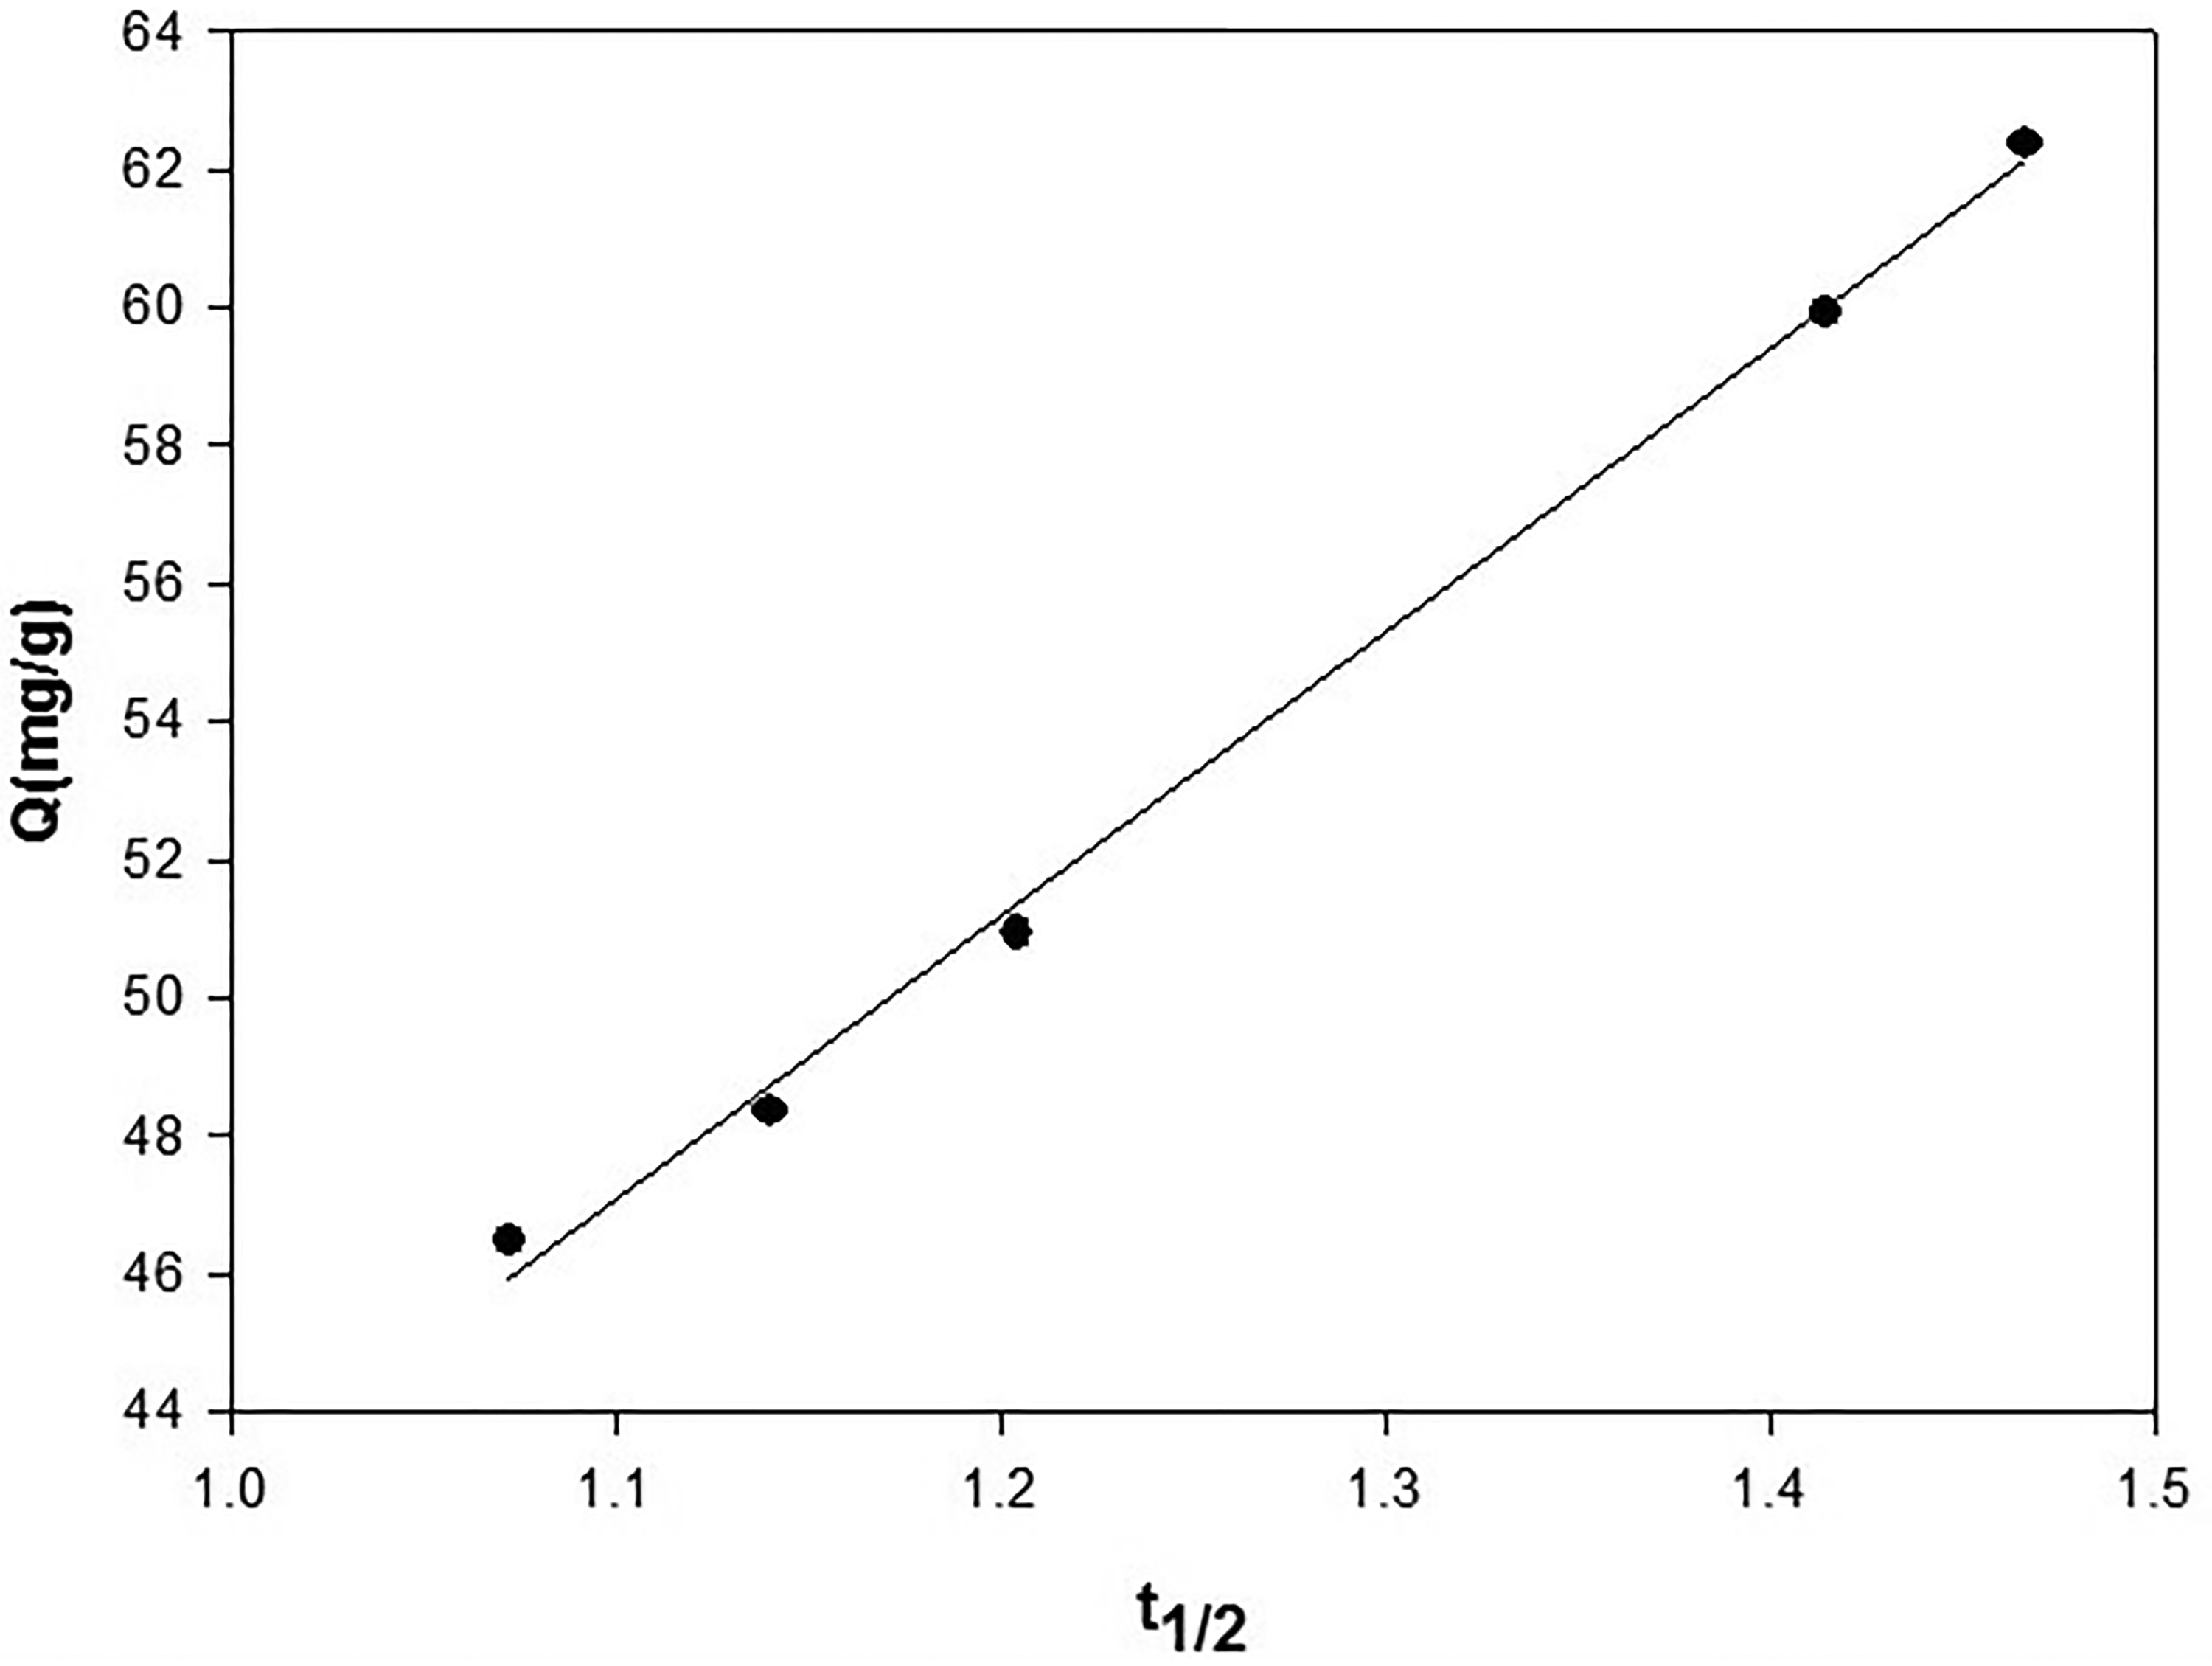
The intraparticle diffusion model for the adsorption of Cr (III) by raw turmeric powder dose 12.5 g/l at initial concentration 0.08 m mol.
The Intraparticle Diffusion Model for the Adsorption of Cr (III) by raw Turmeric Powder Dose 12.5 g/l at Initial Concentration 0.06 m mol.

Effect of Turmeric Raw Material and Black Tea EXTRACTS on MCF-7, HePG2, and HCT-116 Cancer Cells
Using human breast cancer cell line (MCF-7), human hepatocellular carcinoma cell line (HepG2), and human colorectal cancer cell line (HCT-116), the in vitro cytotoxic activities of extracts of turmeric and black tea, as well as their combination, were assessed using the SRB assay over a concentration range of 0.001 to 1000 μg. The cytotoxic activity of the tested extracts was not constant. When compared to the effects of curcumin and red tea extract following treatment alone, the combination of extracts demonstrated the most effective cytotoxic profile against MCF-7, HepG2, and HCT-116, with IC50 s of 29.01, 15.1, and 19.9 µg, respectively.
In addition to the turmeric extract, showed promising effective cell killing against MCF-7 and HepG2 with IC50 s of 56.4 and 77.7 µg respectively compared to the effect of black Tea extract against the same cancer cells with IC50 s of 73.7 and 84.5 µg respectively. While the cell killing-effect of black Tea extract towards HCT-116 cells more than with IC50 61.1 µg/ml. (Figure 19 and Table 4).
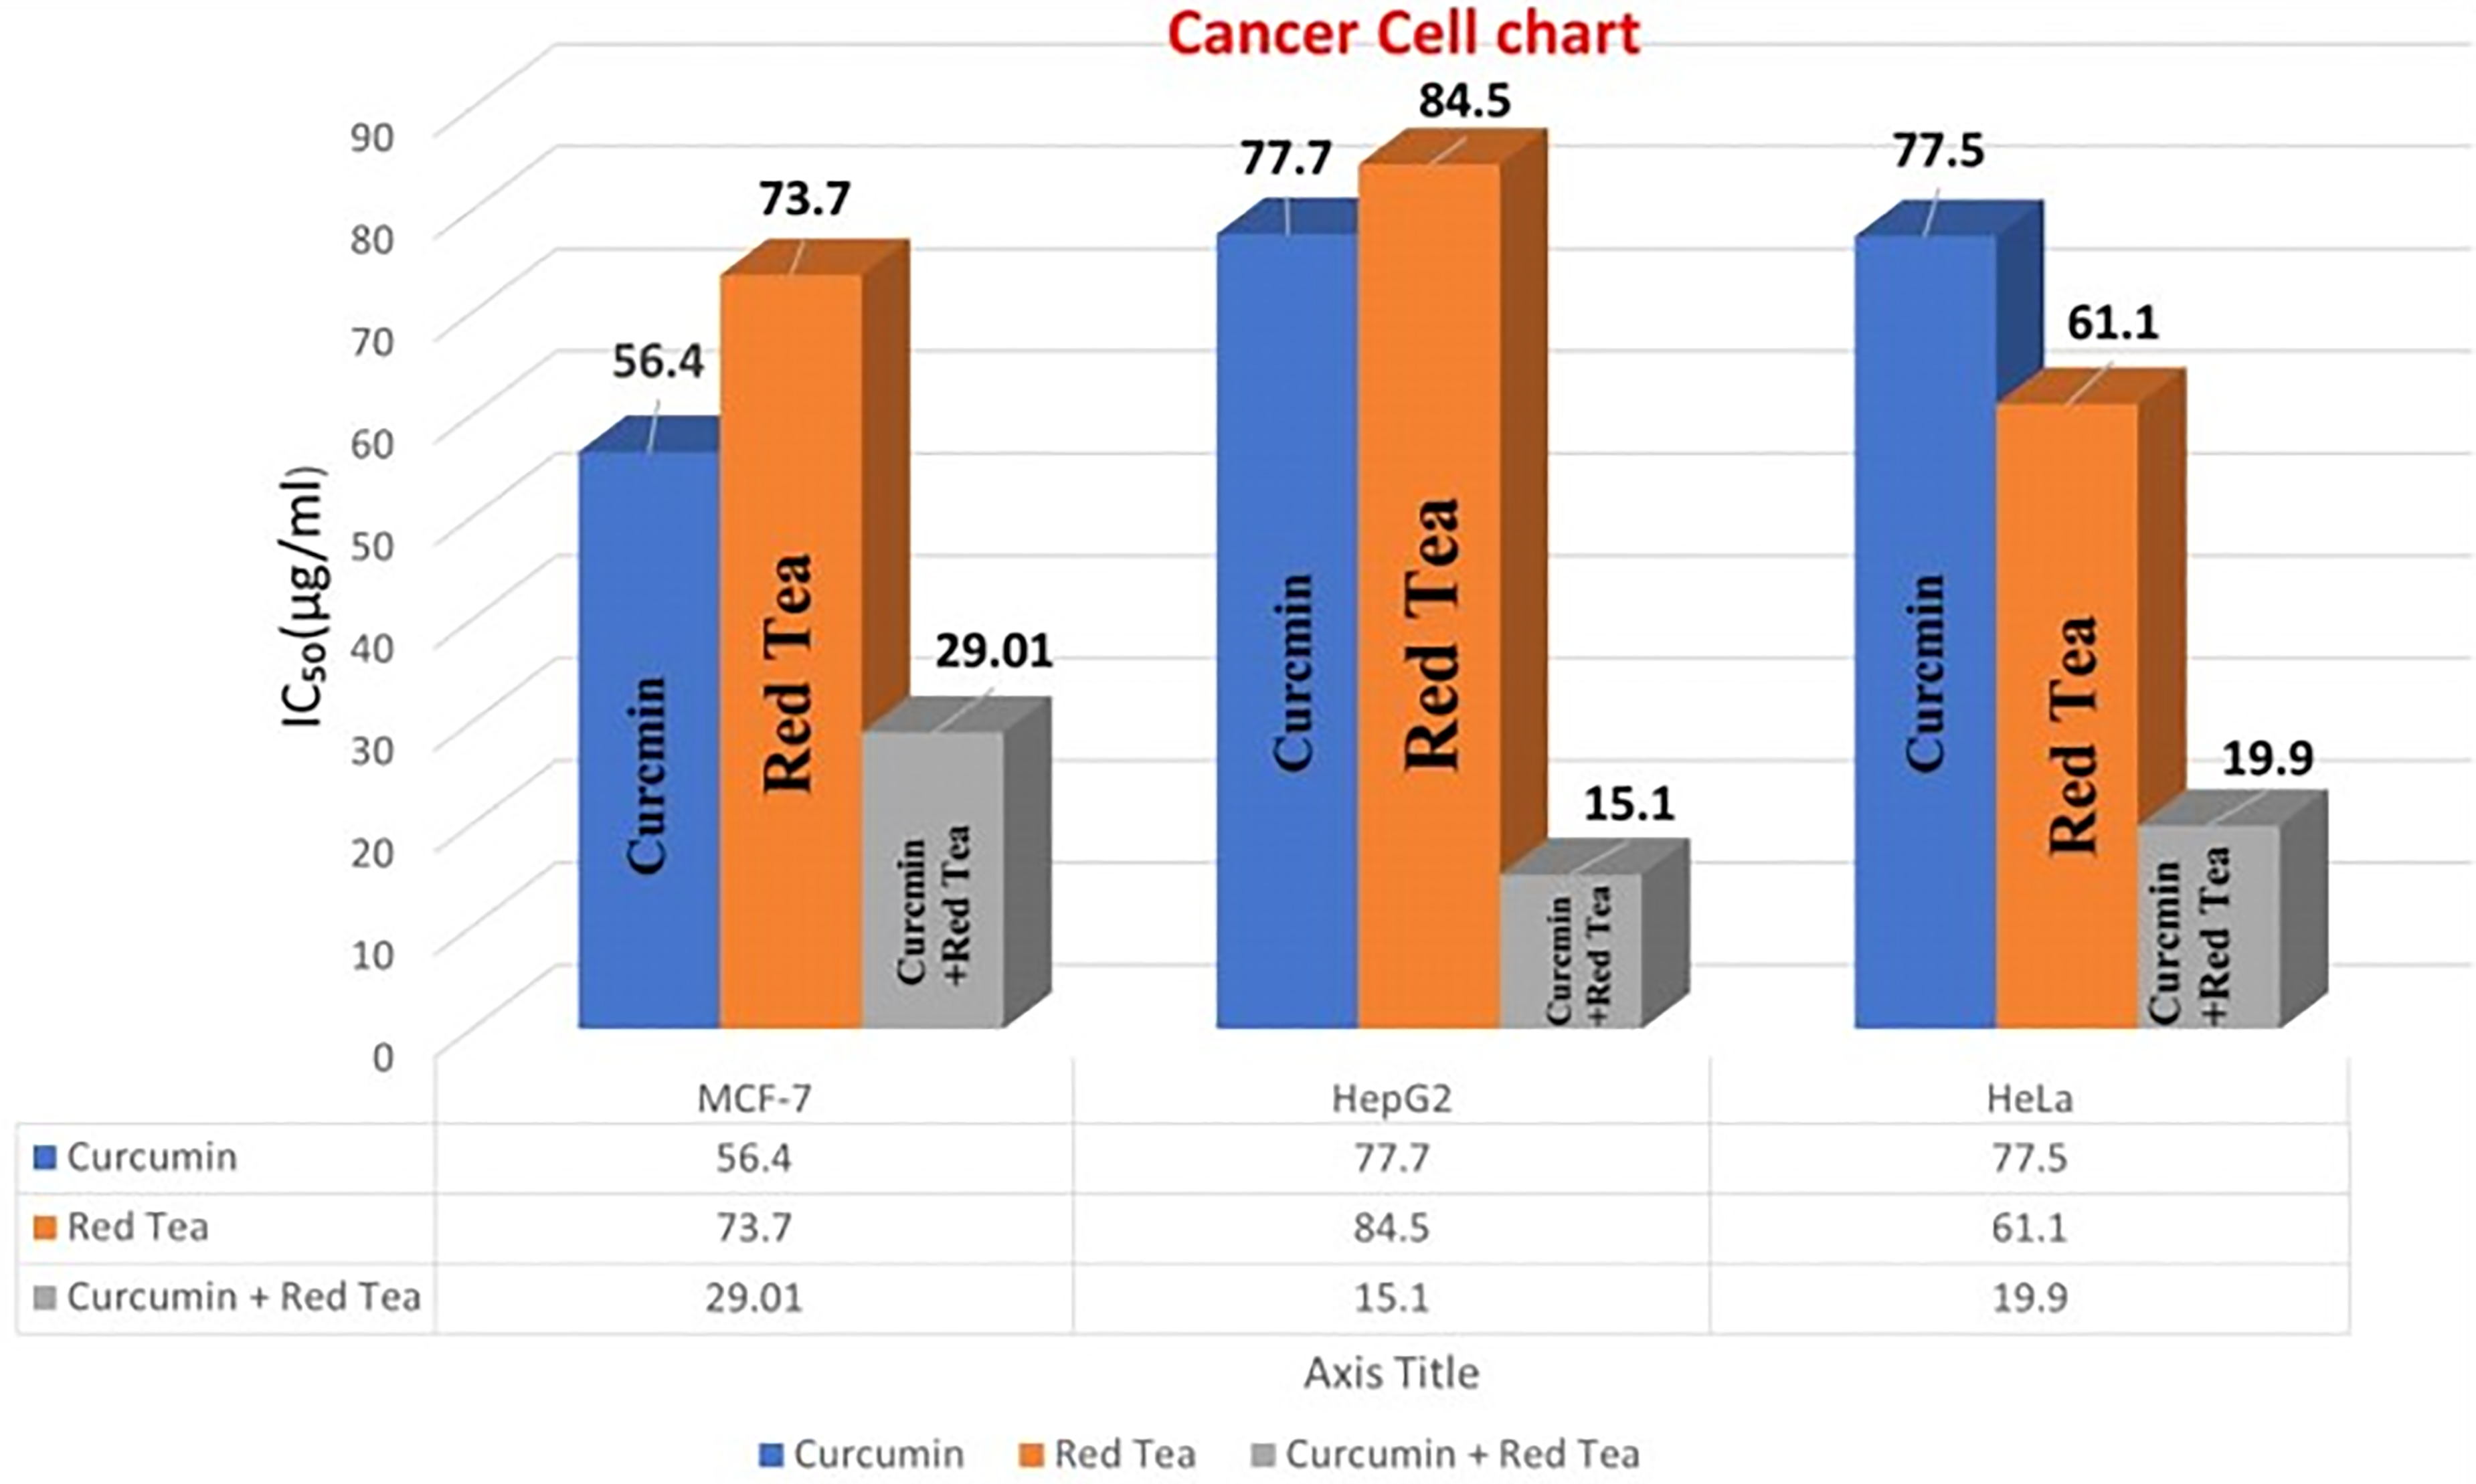
The IC50 (µg) of the turmeric, black tea and their combination against different tumor cell lines.
The IC50 (µg) of the Turmeric, Black Tea and Their Combination Against Different Tumor Cell Lines.

The Limitations of the Study
The turmeric's stability may be raised by the antioxidants found in black and green teaand therefore will lead to good anticancer activity, however, further studies to investigate the difference between individuals responses are needed in the future to generalize the results on different individuals.
Conclusion
The current study's findings demonstrated that after six hours, the stability percentages for 0.1 M green and black tea were determined to be 80.26% and 78.34%, respectively. The pseudo first-order kinetic model produced higher R2 values than the second-order kinetic models, indicating that it suited the experimental data better, according to the correlation coefficient values of reactions including green and black tea. It is possible for raw turmeric powder hangover to absorb Cr(III) ion from aqueous solutions. Adsorption percentage rises as concentration decreases and duration, dosage and pH increase. At a constant adsorbent dosage (12.5 g/L) and agitation rate (100 rpm), a maximum Cr(III) adsorption of 44.28% was reported. Using human breast cancer cell line (MCF-7), human hepatocellular carcinoma cell line (HepG2), and human colorectal cancer cell line (HCT-116), the in vitro cytotoxic activities of extracts of turmeric and black tea, as well as their combination, were assessed using the SRB assay over a concentration range of 0.001 to 1000 μg.When compared to the effects of curcumin and red tea extract following treatment alone, the combination of extracts demonstrated the most effective cytotoxic profile against MCF-7, HepG2, and HCT-116, with IC50 s of 29.01, 15.1, and 19.9 µg, respectively.
Footnotes
Acknowledgments
The authors extend their appreciation to Taif University, Saudi Arabia for supporting this work through the project number (TU-DSPP-2024-64).
Declaration of Conflicting Interests
The authors declared no potential conflicts of interest with respect to the research, authorship, and/or publication of this article.
Funding
The author(s) disclosed receipt of the following financial support for the research, authorship, and/or publication of this article: Taif University, Saudi Arabia has supported this research work through the project number (TU-DSPP-2024-64).
Statement of Human and Animal Rights
N.A.
Statement of Informed Consent
N.A.