
Abstract
Introduction
Tetrastigma hemsleyanum Diels et Gilg, which is commonly known as Jin-xian-diao-hu-lu, She-fu-zi, and Shi-lao-shu, is a plant whose main effective components include flavonoids, polysaccharides, triterpenoids, sterols, phenolic acids, and fatty acids. It is widely cultivated in southern provinces of China, particularly in Jiangxi, Zhejiang, Fujian, and other southern provinces, and boasts a rich germplasm resource. T. hemsleyanum is a folklore herb with well-known curative effects, and local records show that the entire plant can be used for medicinal purposes. Clinical studies demonstrate the plant's efficacy in detoxification, promoting blood circulation, removing blood stasis, and resolving phlegm. It is a medicinal plant that can be used for the treatment of pneumonia and hepatitis,1,2 and is especially effective for children with high fever. 3 However, there is not enough research on the effectiveness of using the fibrous roots and leaves of T. hemsleyanum for therapeutic purposes, which leads to unnecessary waste. It is very important to clarify the composition of fibrous roots and leaves, which can provide a scientific basis for further expanding the utilization of T. hemsleyanum resources. In addition to assessing the total flavonoid, total polyphenol, and total polysaccharide content, it is imperative to identify small molecule compounds in order to recognize common and distinct components among different parts. This approach aims to minimize resource wastage.
Ultra-performance liquid chromatography-tandem quadrupole-time-of-flight mass spectrometry (UPLC-Q-TOF-MSE) is a useful method for this purpose due to its high sensitivity, selectivity, and ability to provide complete and high-quality mass spectrometry data.4,5 This method is simple and efficient6,7 and has been successfully applied in many fields, 8 including Chinese herbal medicine,9–12 natural product research and development,13,14 microorganisms, 15 and the food industry. It serves as a highly effective tool for elucidating the chemical composition profile of substances.16–18 By analyzing the chemical composition of various parts, such as leaves, tubers, or fibrous roots, researchers can identify and quantify specific chemical constituents unique to each part. This knowledge can contribute to the rational development and utilization of various parts of T. hemsleyanum.
In this study, the contents of total flavonoids, total phenols, and total polysaccharides in the tubers, fibrous roots, and leaves of T. hemsleyanum from Hangzhou, Zhejiang, were determined. The tubers, fibrous roots, and leaves of T. hemsleyanum were analyzed separately using UPLC-Q-TOF-MSE. By comparing the total ion flow diagrams of different parts of T. hemsleyanum, the results indicated that there was no significant difference in chemical composition between tubers and fibrous roots. However, a significant disparity was observed in the content of the leaves compared to the other two tissues. The MasslynxV4.1 software was employed to process the mass spectrometry data, enabling the identification of active components present in the methanolic extract of T. hemsleyanum. The cleavage mode of these components was analyzed in conjunction with a database and relevant literature on the identification of components in T. hemsleyanum. This process aimed to investigate the underlying chemical composition of different parts of T. hemsleyanum and assess the potential medicinal value of the entire plant, with a particular focus on samples originating from Zhejiang province in China.
Results and Discussion
According to the report, the main components of T. hemsleyanum extract are flavonoids, polysaccharides, and phenolic acids. Modern pharmacological studies have confirmed that the effective pharmacodynamic components of antitumor effect in T. hemsleyanum are mainly flavonoids,19,20 flavonoids have a variety of pharmacological activities.21–23 Studies have shown that flavonoids constitute a significant proportion of the active ingredients in T. hemsleyanum, and they have been a focal point in the investigation of the plant's chemical constituents in recent years. Additionally, research has demonstrated that the chemical constituents of phenolic acids possess strong antioxidant capacity.24,25 It exhibits antioxidant, antiinflammatory, antitumor, and other pharmacological effects, which may be linked to the content and type of phenolic acids present in T. hemsleyanum. Polysaccharide is also a crucial active compound in T. hemsleyanum and is one of its saccharides. Studies on the antioxidant activity of polysaccharides have revealed that the antioxidant capacity of T. hemsleyanum is second only to vitamin C but higher than that of Astragalus and Lycium barbarum. 26 The polysaccharide compounds of T. hemsleyanum have various applications, including antioxidant properties, heat-clearing and detoxifying effects, antiviral activity, and the enhancement of immune function. 27 To clarify the content of total flavonoids, phenolic acids, and polysaccharides in methanol extracts of different parts of T. hemsleyanum. This study conducted the content determination of the flavonoid, total phenol, and polysaccharide of different parts in T. hemsleyanum from Zhejiang Province. The results indicated that the highest content of flavonoids, total phenols, and polysaccharides was found in the fibrous roots, followed by the leaves, and was the lowest in the tubers. Currently, the content of flavonoids, 28 phenolic acids, 29 and polysaccharides 28 is commonly used as a quality evaluation index of T. hemsleyanum, 30 providing a theoretical basis for subsequent selection and breeding. In this article, the names of different types of compounds and the cracking process are mainly clarified, but the quality markers of T. hemsleyanum are not reflected in this article.
Studies have been conducted to identify the active constituents in the tubers of T. hemsleyanum.31,32 However, most of the research has predominantly focused on the tubers, with less emphasis on the fibrous roots and leaves of T. hemsleyanum. In this study, the content of T. hemsleyanum was determined using a spectrophotometer in Zhejiang. Subsequently, the constituents of the extracts from different parts of T. hemsleyanum were identified using UPLC-Q-TOF-MSE. In Figure 1 and Table 1, 13 chemical components were identified in the tubers, 7 active components in the fibrous roots, and 8 components in the leaf extracts.

(A) TIC diagram of negative ion mode in tuber roots of T. hemsleyanum; (B) TIC diagram of negative ion mode in fibrous root of T. hemsleyanum; (C) TIC diagram of negative ion mode in leaves of T. hemsleyanum.
Identification of Chemical Constituents of Methanol Extract From Different Parts of Tetrastigma hemsleyanum.

Note: “–” means not detected; the peak area of “+” was (1 ∼ 9) × 103, the peak area of “ + +” was (1 ∼ 9) × 104, and “ + + + ” represents the peak area in (1 ∼ 9) × 105.
Comparison of Flavonoids, Phenolic Acids, and Polysaccharides Contents in Methanolic Extracts Obtained From Different Parts of T. hemsleyanum
The information in Figure 2(D) reveals that the fibrous roots exhibited the highest concentrations of flavonoids, phenolic acids, and polysaccharides, with respective values of 80.95 μg/mg, 115.38 μg/mg, and 324.99 μg/mg. The leaves contained slightly lower amounts, with flavonoid content at 79.44 μg/mg, phenolic acid content at 96.80 μg/mg, and polysaccharide content at 307.01 μg/mg. The tubers had the lowest concentrations of these compounds, with flavonoid content at 23.19 μg/mg, phenolic acid content at 48.42 μg/mg, and polysaccharide content at 176.53 μg/mg. This result indicates that the fibrous roots and leaves of T. hemsleyanum are rich in abundant flavonoids and phenolic compounds. However, these 2 parts are often discarded or neglected.

(A) Flavone standard curve; (B) total phenol standard curve; (C) polysaccharide standard curve; (D) contents of flavonoids, total phenols, and polysaccharides in different parts of Tetrastigma hemsleyanum.
Identification of Chemical Constituents of T. hemsleyanum Based on Mass Spectrometry Cleavage Regression
Phenolic Acids and Their Derivatives
The mass spectra were in the form of excimer ion peaks of [M-H]− in negative ion mode. In this study, 3 phenolic acids, including Caffeoylquinic acid, 5-p-acylquinic acid, and Glucogallin, have been identified in the methanolic extract of leaves of T. hemsleyanum, and glucogallin also has been identified in the fibrous roots of T. hemsleyanum. In Figure 3, Compound
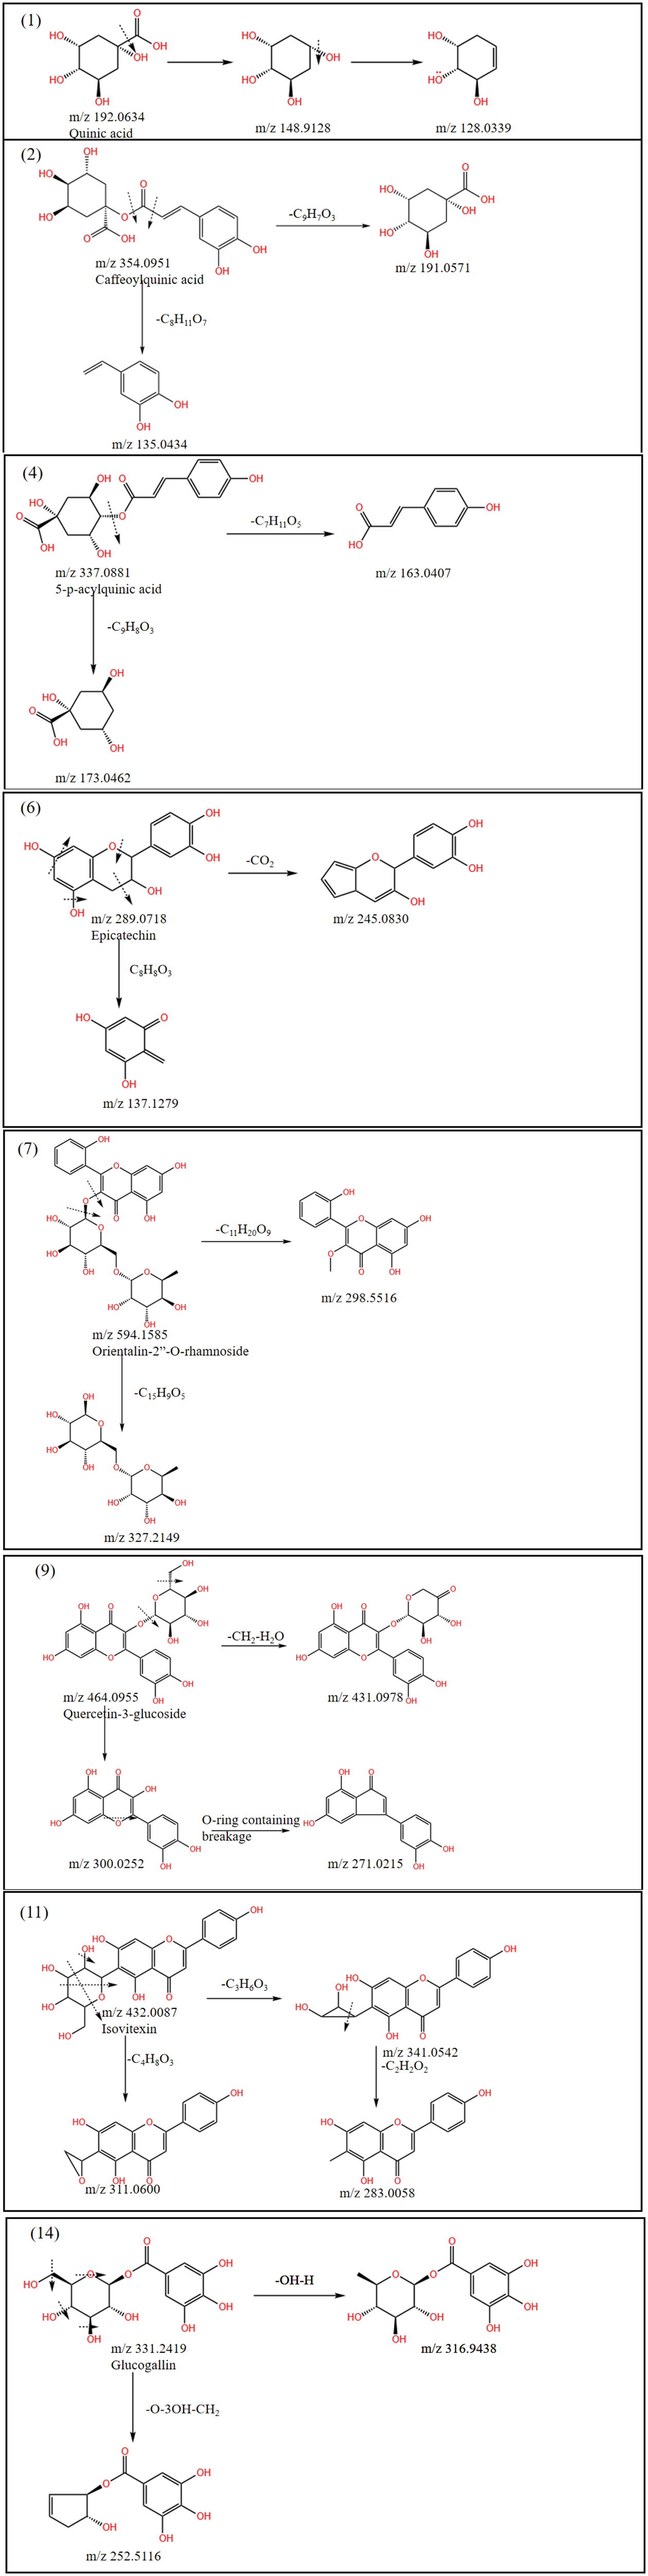
Fragmentation pathway of methanol extract from leaves of Tetrastigma hemsleyanum.
Flavonoids and Their Flavonoid Glycosides
Flavonoids are the main potent components of T. hemsleyanum. In this study, 3 flavonoids, including procyanidin B, catechin, and daidzein, were identified in the methanolic extract of tubers of T. hemsleyanum, 2 in the fibrous roots, kaempferol-3-O-rutinoside and isovitexin, and 4 in the leaves, namely epicatechin, orientalin-2’’-O-rhamnoside, isovitexin, and quercetin-3-glucoside. In the tubers, as shown in Figure 4, compound
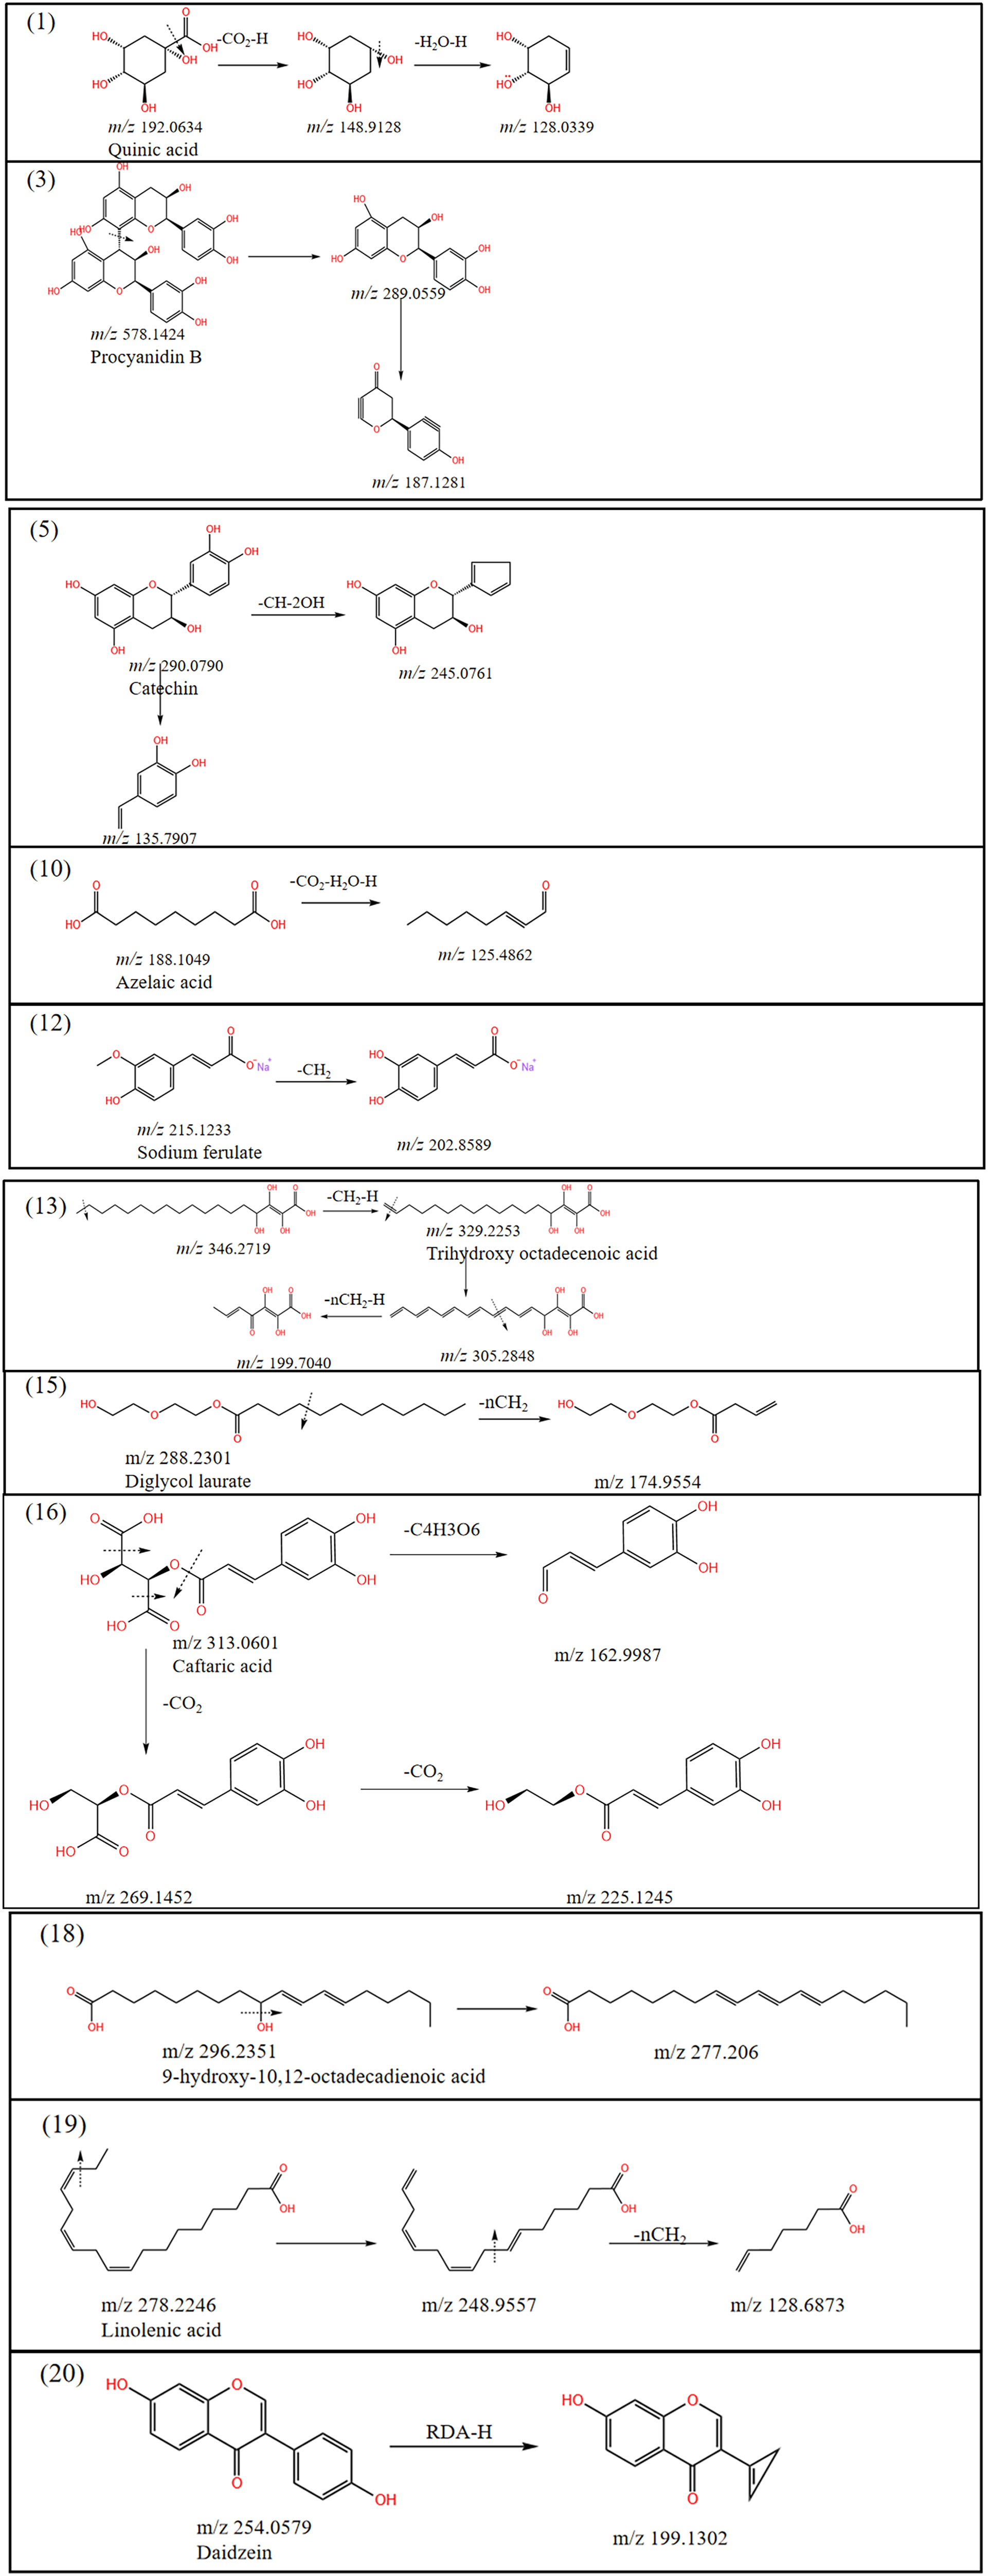
Fragmentation pathway of methanol extract from tuber roots of Tetrastigma hemsleyanum.

Fragmentation pathway of methanol extract from fibrous roots of Tetrastigma hemsleyanum.
Organic Acids
Two organic acids, including quinic acid and azelaic acid, have been identified in the methanolic extract of the tubers of T. hemsleyanum. Quinic acid was identified in the tubers, fibrous roots and leaves of T. hemsleyanum. In the tubers, as shown in Figure 4, compound
Fatty Acids and Their Derivatives
A total of 3 fatty acid analogs were identified in T. hemsleyanum. In the tubers, as shown in Figure 4, compound
Alkaloids and Other Compounds
One alkaloid compound, berbamunine, was identified in the methanolic extract of the fibrous roots of T. hemsleyanum. Two other types of compounds, sodium ferulate and diglycol laurate, were identified in the tuber roots. In the fibrous roots, Figure 5, compound
Caffeic Acid and Derivative
In the tubers, Figure 4, Compound
Conclusion
It was found that, in addition to the tubers, the fibrous roots and leaves also contained a significant amount of flavonoids, phenolic acids, and polysaccharides. Currently, the tuberous parts of T. hemsleyanum are prevalent in the market, and people typically use these tuberous parts for medicinal purposes. The present study not only provides insight into the content of active ingredients in the tubers but also suggests the possibility and theoretical basis for utilizing the whole plant of T. hemsleyanum as a medicinal resource, as evidenced by the determination of total content and identification of active ingredients.
Experimental Procedure
Instruments and Reagents
UPLC-Q-TOF-MS (SYNAPT-G2-S HDMS, Waters, USA); Agilent BEHC18 column (100 mm × 2.1 mm, 1.7 μm) (Waters, USA); with Masslynx 4.1 analysis software (Waters, USA); electric blast dryer (GXZ-9070MBE, Shanghai Boxun Industrial Co. Ltd); UV-visible spectrophotometer (UV-5200, Shanghai Yuananalysis Instruments Co.); ultrasonic cleaner (KQ-500DE, Kunshan Ultrasonic Instruments Co., Ltd); rotary evaporator (R3, BUCHI, Switzerland); water purifier (Heal Force NW15UV, Shanghai Kanglei Analytical Instruments Co. Ltd); electronic balance (DENVER TP-214, Sartorius Scientific Instruments Co., Ltd); ultra-low temperature refrigerator (MDF-382EN, Thermoelectric (Shanghai) Technology Co. Synergy HTX, BIOTEX, USA); rutin, gallic acid, glucose (Chengdu Destructive Biotechnology Co.); ethanol, NaNO2 solution, Al(NO3)3 solution, NaOH solution, all were analytically pure (Zhejiang Teng Yu New Material Technology Co., Ltd); acetonitrile and formic acid were chromatographically pure (Shanghai Maclean Biochemical Technology Co., Ltd). Eleven samples were identified as genuine T. hemsleyanum Diels et Gilg by Professor Liang Zongsuo, College of Life Science and Medicine, Zhejiang University of Technology, according to the identification of T. hemsleyanum Zhejiang Province Chinese Medicine Processing Specification (2015 Edition). 44
Determination of Total Flavonoids, Total Phenols, and Polysaccharides in Different Parts of T. hemsleyanum by Spectrophotometer
Plant Samples and Preparation of Methanolic Extracts of Different Parts of the Plant
The whole herb was harvested from 3-year-old plants of T. hemsleyanum (Puqian Town, Yuhang District, Hangzhou, Zhejiang Province, China) in December 2020. A voucher specimen (No. 20221201001) was deposited at the Key Laboratory of Plant Secondary Metabolism, Zhejiang Sci-Tech University. The tubers, fibrous roots, and leaves of T. hemsleyanum were dried at 60 °C for 12 h, and then ground into powder by a pulverizer. The powder of different parts was accurately weighed 30 g each, and 80% methanol was added according to the ratio of material to liquid of 1: 20, at 60 °C, power 200 W, ultrasonic extraction for 30 min, extraction twice, combined extract, suction filtration, rotary evaporation, and finally freeze-dried, placed in a 4 °C refrigerator for later use. The extraction rate was 12% to 24%.
Preparation of Rutin Standard Curve and Determination of Total Flavonoids in Different Parts of T. hemsleyanum
Figure 2(A), In the colorimetric method of sodium nitrite and aluminum nitrate (Leng et al., 2021) with rutin as the standard for the determination of flavonoids, the standard curve of flavonoids was measured as y = 0.0029x + 0.0588, where: X is the rutin content of the standard solution (mg); Y is the absorbance of rutin measured at 510 nm. The linear range was 2∼80 μg and R2 was 0.9997.
Firstly, 60 μL of 5% NaNO2 solution was added to the solution to be measured, shaken well, and left for 5 min; then 10% Al(NO3)3 solution of the same volume as 5% NaNO2 solution was added, mixed well and left for the same time, then 0.8 mL of 10% NaOH solution was added to the solution to be measured, mixed well and 70% ethanol was added. The value was measured at the absorbance of 510 nm on an enzyme marker. Two hundred microliter was added to each well of a 96-well plate and three replicates were set for each well. The absorbance of each sample was determined according to the above method and the total flavonoid content of each sample was calculated according to the standard curve.
Preparation of Gallic Acid Standard Curve and Determination of Total Phenols in Different Parts of T. hemsleyanum
Figure 2(B), a standard curve was made using gallic acid as the total phenolic standard using the colorimetric method. 45 The standard curve for phenolic acid was measured as y = 0.0122x + 0.5722, where: X is the gallic acid content of the standard solution (mg); Y is the absorbance of gallic acid measured at 740 nm. The linear range was 2∼80 μg and R2 was 0.9951.
0.01 g of T. hemsleyanum extract was added to 1.4 mL of ddH2O and dissolved into the solution to be measured. 0.1 mL of Folin-Cioealte color developer was added first, then 0.3 mL of 20% Na2CO3 solution was added to the solution to be measured, shaken well, and left to stand in the dark for about 25 min, and the value was measured at 740 nm absorbance on an enzyme marker. The absorbance of each sample was determined according to the above method and the total flavonoid content of each sample was calculated according to the standard curve.
Preparation of Glucose Standard Curve and Determination of Polysaccharide Content in Different Parts of T. hemsleyanum
Figure 2(C), The values were measured at 490 nm absorbance on an enzyme marker and the standard curve was plotted using absorbance as the vertical coordinate and glucose mass as the horizontal coordinate. The standard curve for the polysaccharide was made using the phenol-sulphuric acid method. 46 The standard curve for the polysaccharide was y = 0.0052x + 0.0417, where: X is the glucose content of the standard solution (mg); Y is the absorbance of the glucose measured at 740 nm. The linear range was from 10 to 400 μg and R2 was 0.9926.
0.01 g of T. hemsleyanum extract was taken and redissolved in 1 ml of 70% ethanol. 0.2 mL of 5% phenol solution was first added to the solution to be tested, shaken well, followed by 1 mL of concentrated sulfuric acid, mixed well and placed in boiling water for 20 min, then quickly cooled in ice. Five minutes later, the solution to be tested was added to a 96-well plate (200 μL/well) with three replicates per well and six replicates per group of concentrations. Three replicates of 200 μL/well were added to each well of the 96-well plate, with three replicates per well. The absorbance of each sample solution was determined according to the above method and the polysaccharide content of each sample was calculated according to the standard curve.
Chromatography-Mass Spectrometry
Preparation of the Test Solution
Accurately weigh 0.01 g of 70% methanolic extract of different parts of T. hemsleyanum, redissolve it with 70% methanol, fix the volume to 10 mL, take 1 mL of the solution, and filter it through a 0.22 μm hydrophobic PTFE filter tip to obtain the final concentration of 1 mg/mL of T. hemsleyanum to be tested.
Liquid Chromatographic Conditions
An Agilent BEHC18 column (100 mm × 2.1 mm, 1.7 μm); 0.1% formic acid aqueous solution (A)—100% acetonitrile solution (B), gradient elution (0-1 min, 5% B; 1-3 min, 5%-10% B; 3-6 min, 10%-20% B; 6-16 min, 20%-70% B; 16-20 min, 70%-100% B); set flow rate of 0.3 mL/min; instrument column temperature of 30°; detection wavelength of 200 to 600 nm; sample volume of the test solution was 2 μL/min. B; 16 to 20 min, 70%-100% B); the flow rate was set at 0.3 mL/min; the column temperature was 30°; the detection wavelength was 200 to 600 nm; and the injection volume of the test solution was 2 μL.
Electrospray Ionization-MS Conditions
Ionization mode, negative (electrospray ionization negative); dissolvent gas: nitrogen; collision gas: argon; full scan: 50 to 1200 Da, source temperature: 120 °C, dissolvent temperature: 450 °C, cone voltage: 25 V, locked spray standard: 400 ng/mL leucine enkephalin (m/z 554.2615 negative ion spray mode) to 5 μL/min infusion. Collision energy: 30 to 70 V. All data obtained from MassLynx.
UPLC-Q-TOF—MSE Analysis
The retention time and corresponding mass spectrometry information of chemical components in different parts of T. hemsleyanum extract were detected by UPLC-Q-TOF-MSE, and the active components in different parts of T. hemsleyanum were identified by software and literature analysis related to T. hemsleyanum components.
Statistical Analysis
We employed MassLynx V4.2 software (Waters Corporation, Milford, MA, USA) to collect mass spectrometry data for automated processes, including peak identification, matching, alignment, extraction, and normalization. Subsequent to this, secondary mass spectrometry data, Unifi (Waters Corporation, Milford, MA, USA), and online databases (Chemspider, Web of Science, and PubMed) were utilized for the identification of metabolites and their potential cleavage modes. Graphs were generated using Origin 2020 software.
Footnotes
Acknowledgments
The authors would like to express their sincere gratitude to Xinhan Xu in Sanyeqing Agricultural Technology Co., LTD for material collection and experimental assistance. Reviewers are acknowledged for their contribution to the improvement of the manuscript in the revision process.
Authors’ Contributions
Conceptualization: L. P.; methodology: F. Y.; validation: X. L., J. F., and H. L.; writing-original draft preparations: L. P.; writing review and editing: X. Z.; supervision: X. Z., P. X., and Z. L.; project administration: X. Z. All authors have read and agreed to the published version of the manuscript.
Data Availability Statement
The data presented in this study can be obtained by contacting the corresponding author and requesting access to the data.
Declaration of Conflicting Interests
The authors declared no potential conflicts of interest with respect to the research, authorship, and/or publication of this article.
Funding
The authors disclosed receipt of the following financial support for the research, authorship, and/or publication of this article: This work was supported by the Zhejiang Province Basic Public Welfare Research Program Project (grant number LGN22H280004).
Statement of Institutional Review Board
Not applicable.
Statement of Informed Consent
Not applicable.