
Abstract
Shilajit has a longstanding use as an anti-aging and memory enhancing drug. It is known to have excellent anti-bacterial effects and is believed to be effective for cognitive enhancement, but is difficult to standardize because of the lack of quality control standards. This study, for the first time, proposes a quality control standard using a simultaneous analytical method for the drug’s multi-compound content using high-performance liquid chromatography-ultraviolet detection (HPLC-UV) as an aid for the internationalization of Mongolian Shilajit. Phenolic compounds
Shilajit is a natural multi-complex material. 1 For, centuries, it has been obtained as a product mixed with rock minerals through the process of accumulation and decomposition of materials such as plants, fungi, and lichens. 2 Therefore, its components vary depending on various conditions such as the mineral content of the rocks, surrounding plants, humidity, and bacteria. 3 -5 In general, Shilajit contains hippuric acid and benzoic acid. 4 Because the raw material of Shilajit contains lower plants, such as lichen, moss, and liverwort, as well as animal urine and feces, these compounds do not vary. 5,6
Shilajit has been reported to have anti-inflammatory, anti-oxidant, memory enhancement, anti-Alzheimer’s disease (AD), and anti-diabetes activities. 5 Nevertheless, little is known about its constituents and biological activities, which limits its international use. 7 First, quality control standards are difficult because the standard marker compound of Shilajit has not been established. 7 -10 Secondly, there is a lack of scientific research on Shilajit. 5 Thirdly, the focus is on research of Indian Shilajit. Shilajit is found in mountainous areas, such as the Himalayas, Altai, and the Urals, hence the chemical properties of the drug differ from mountain to mountain. 11 Mongolian Shilajit is known for its anti-bacterial effects that are attributable to its rich benzoic acid content. 12,13
Various plants, mosses, lichens, and liverworts are associated with Shilajit. 5 We have collected the lichen, Xanthoparmelia somloensis (Gyel.) Hale around Mongolian Shilajit. Through high-performance liquid chromatography-ultraviolet detection (HPLC-UV) and ultra-high-performance liquid chromatography-electrospray ionization/hybrid linear trap-quadruple-orbitrap-high-resolution mass spectrometry (UHPLC-ESI/LTQ-HRMS), the relationship between Mongolian Shilajit and X. somloensis (Gyel.) Hale was established.
For the first time, this study proposes the standardization of quality of Mongolian Shilajit through isolation of standard marker compounds from Mongolian Shilajit extract, simultaneous analysis through HPLC-UV, validation, cognitive-related anti-Alzheimer’s disease (AD) assay, and identification of origin. The purpose of this study was to establish a quality control standard for Mongolian Shilajit.
Results and Discussion
Identification of Compounds 1‐6 Isolated From Mongolian Shilajit
Compounds
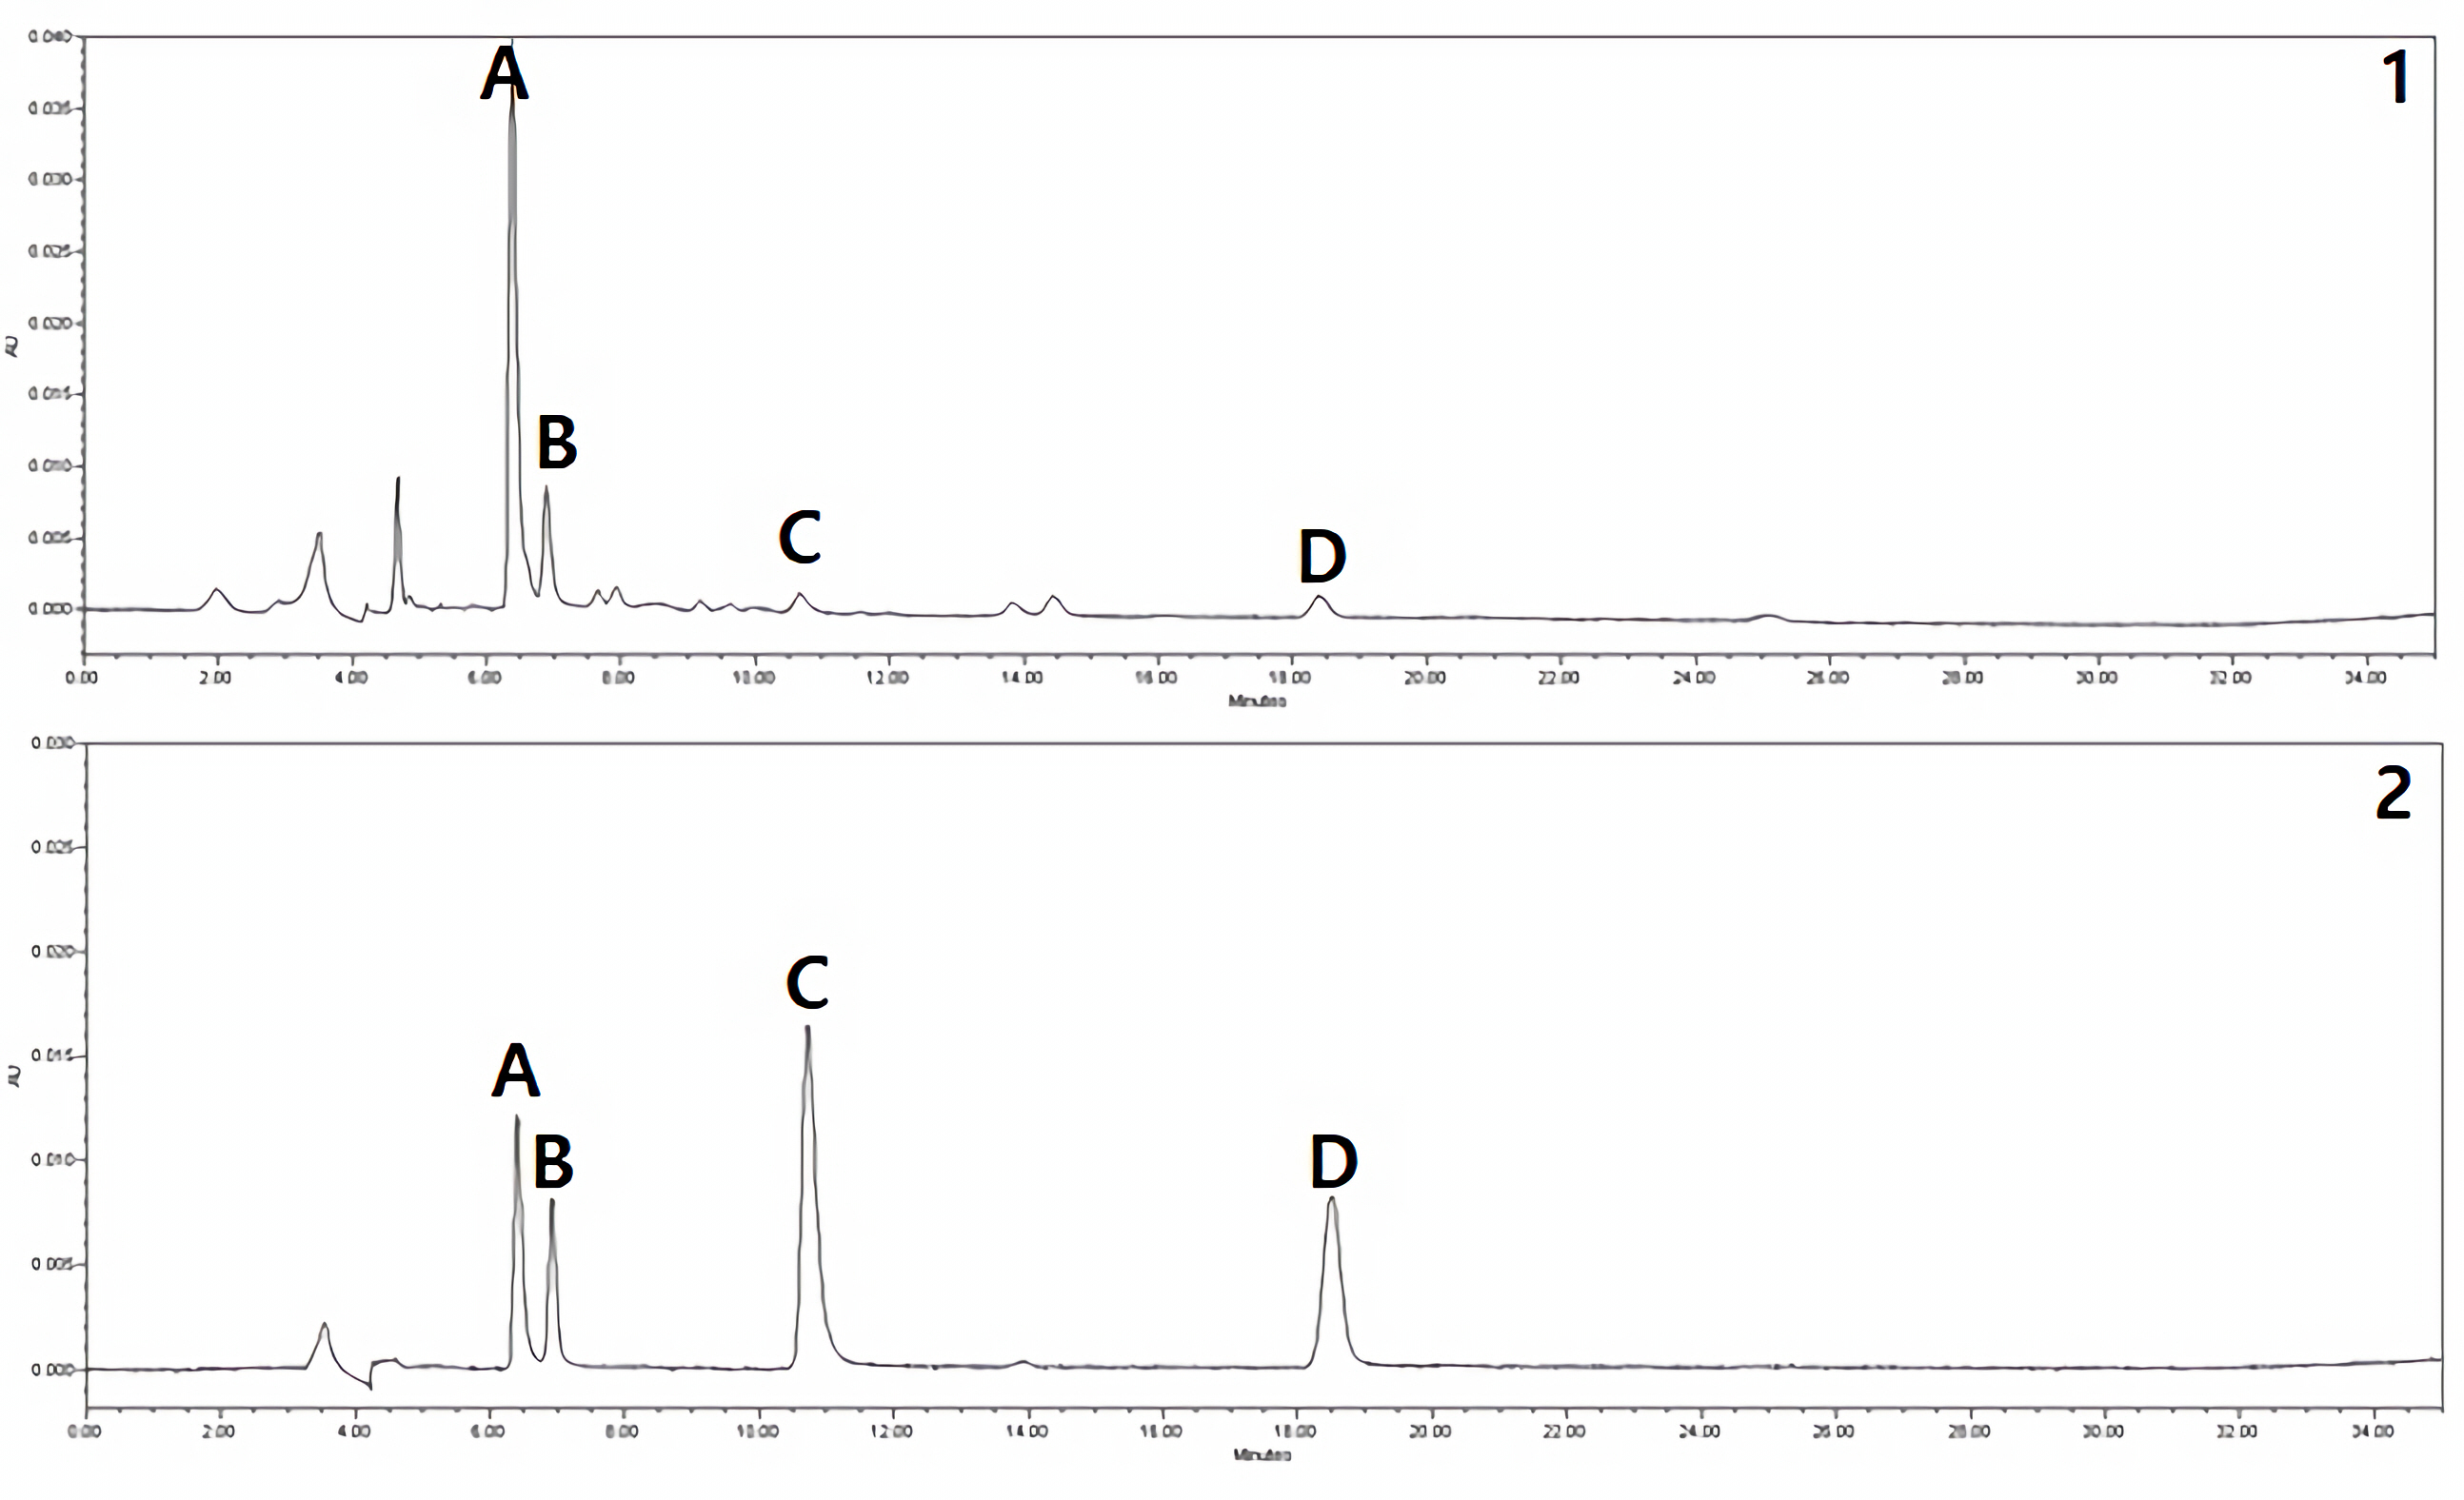
HPLC chromatograms of Mongolian Shilajit extract (1) and standard mixtures (2) (A) compound 4 (hippuric acid); (B) compound 1 (syringaldehyde); (C) compound 3 (phthalic acid); (D) compound 2 (benzoic acid).
Identifying the Origin of Mongolian Shilajit
To standardize Mongolian Shilajit, we first identified the substance from which it originated. Mongolian Shilajit extract, X. somloensis extract, and standard mixtures were analyzed by HPLC-UV. Peaks of compounds
DPPH Free Radical-Scavenging Activity of Mongolian Shilajit Extract and Fractions
The accumulation of active oxygen induces oxidative stress, resulting in cell damage, which could lead to several chronic diseases, including AD, whereas the anti-oxidant defense systems of the body protect against these chronic diseases.
24
Therefore, the potential anti-oxidant activity of the test samples was determined through analysis of DPPH activity, which is widely used to assay free radical-scavenging activity.
25
The extract, fractions, and compounds
DPPH FSC50 of Mongolian Shilajit Extract, Fractions, and Compounds 1

Data are the mean ± S.D (n = 3).
aFSC50 calculated from the least-squares regression line of logarithmic concentrations plotted against residual activity.
bL-ascorbic acid was used as the positive control for DPPH free radical-scavenging; *P < 0.05, **P < 0.01, and *** P < 0.001 compared to the control.
Inhibitory Activity of the Extract, Fractions, and Compounds 1-6 of Mongolian Shilajit on AChE, BChE, and BACE1 Activity and AGE Formation
AD has several causes, including excessive degradation of the neurotransmitters ACh and BCh, resulting in decreased levels as a result of increased levels of the enzymes AChE and BChE, which ultimately lead to the development of neurological diseases.
26
-28
In addition, BACE1 is an enzyme that produces Aβ protein, which constitutes the senile plaques found in the brains of patients with AD.
29
Moreover, AGE plays a role in the loss of neuronal dysfunction in neurodegenerative diseases.
30
Therefore, we assessed the potential involvement of the inhibition of AChE, BChE, and BACE1 activity and AGE formation by the Mongolian Shilajit extract, fractions, and compounds
IC50 of Mongolian Shilajit Extract, Fractions, and Compounds 1
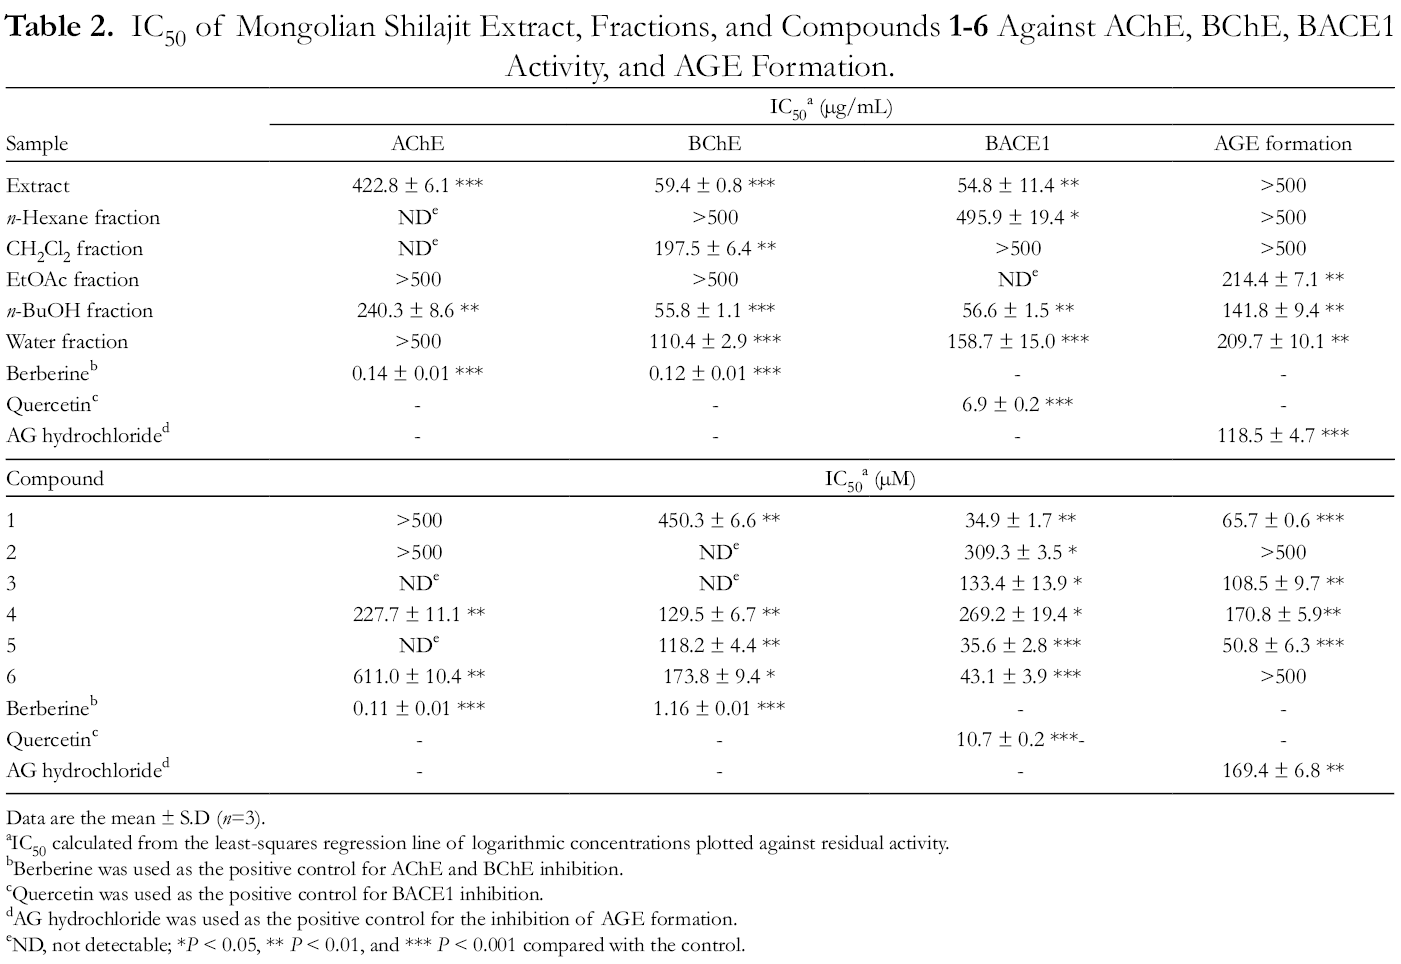
Data are the mean ± S.D (n=3).
aIC50 calculated from the least-squares regression line of logarithmic concentrations plotted against residual activity.
bBerberine was used as the positive control for AChE and BChE inhibition.
cQuercetin was used as the positive control for BACE1 inhibition.
dAG hydrochloride was used as the positive control for the inhibition of AGE formation.
eND, not detectable; *P < 0.05, ** P < 0.01, and *** P < 0.001 compared with the control.
Compounds
Validation of HPLC Analysis
Compounds
Specificity
Optimal ultraviolet wavelength screening was conducted using HPLC-PDA between 210 and 400 nm, and a wavelength of 232 nm was selected in the PDA spectrum. Using the developed HPLC analytical method, the 4 major compounds of Mongolian Shilajit extract were separated without interference.
Linearity
The linearity of the 4 compounds was measured at five final concentrations within 2.5 to 50 µg/mL. In all calibration curves, the correlation coefficient (r
2) of compounds
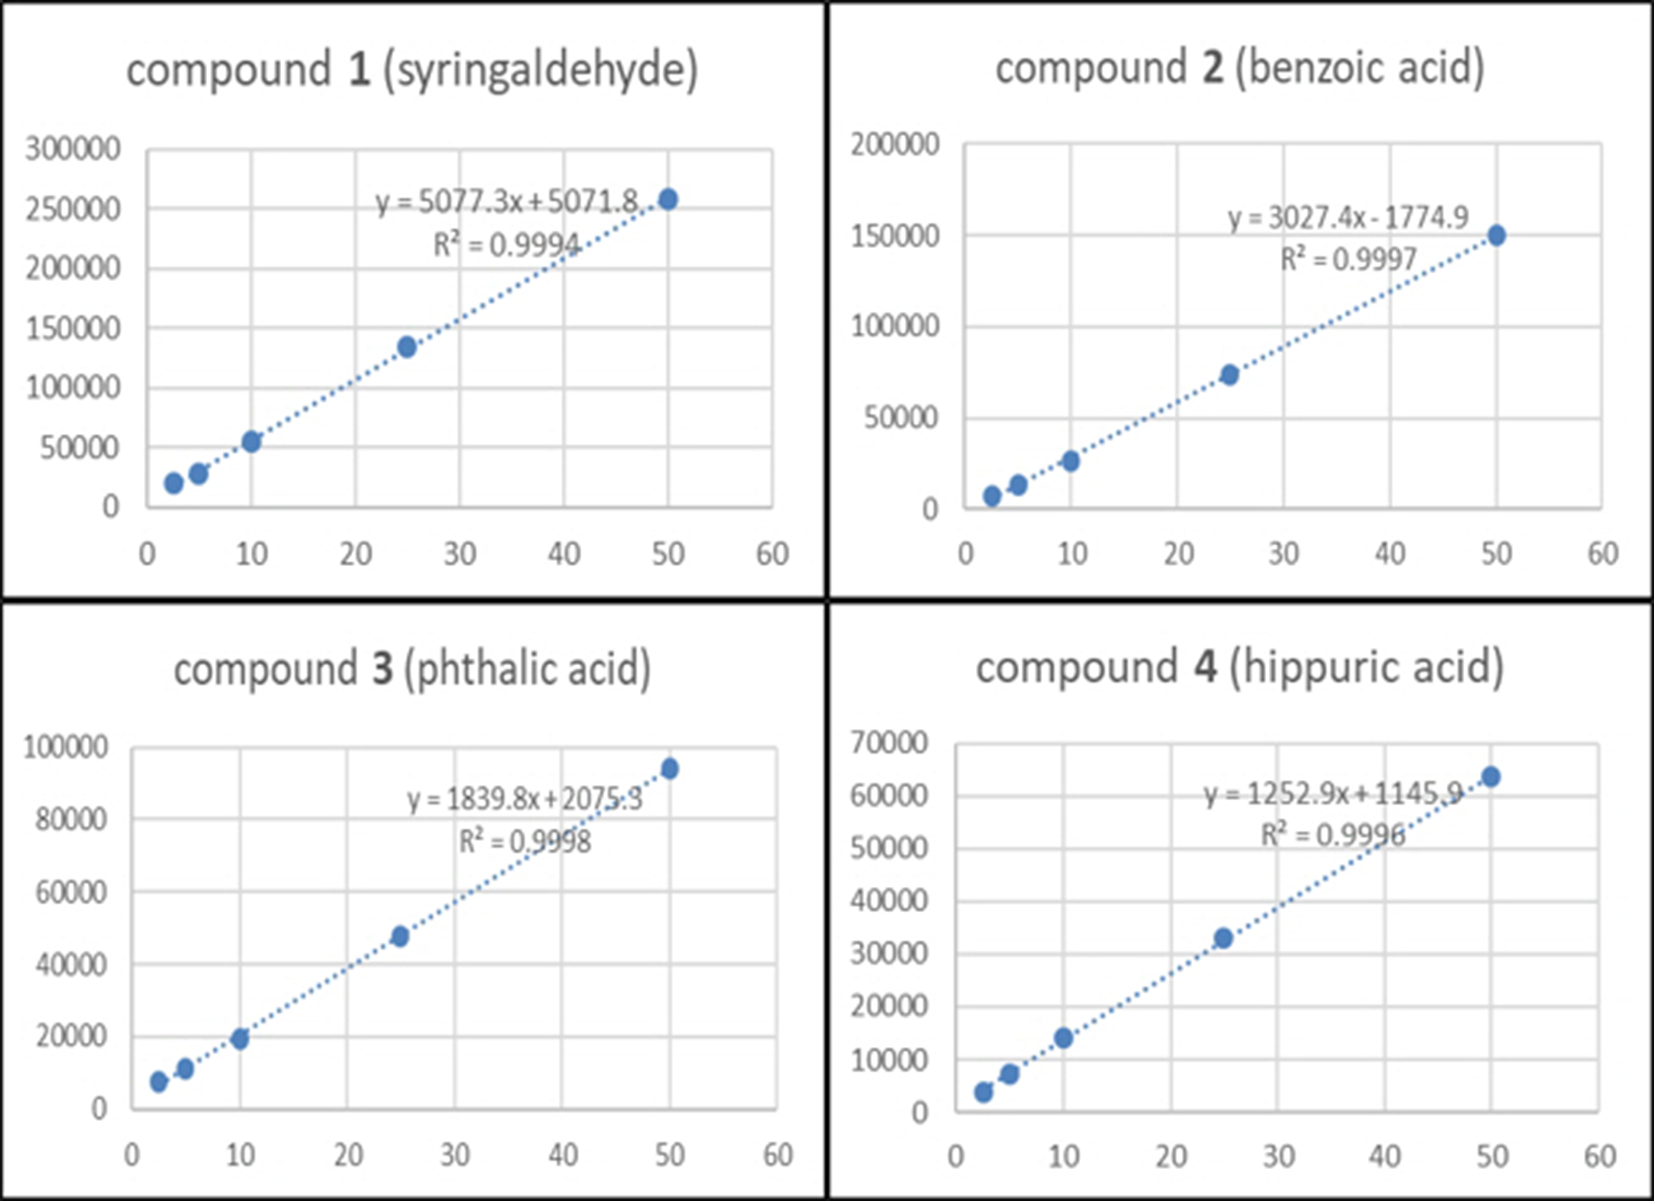
Calibration curves and correlation coefficients of compounds 1
Limit of Detection (LOD)/Limit of Quantification (LOQ)
The LOD values of compounds
Calibration Curves and Linear Range of Compounds 1

Each value is the mean of 3 determinations.
Compound
aY = peak area, X = concentration of standard (μg/mL).
br2 = correlation coefficient for five final concentrations in the calibration curve.
Intra—Inter Day Precision & Trueness
The precision and trueness of analysis were evaluated by 4 standard mixture solutions. Intra-day precision measurement was conducted in a day and repeated on 3 days. The intra-day precision of compounds
Intra-Day and Inter-Day Precision and Trueness of Compounds 1

Each value was presented by calculating mean of triplication.
Compound
Quantitative HPLC Analysis of Isolated Compounds
The isolated compounds
Conclusions
This study conducted standard marker compound isolation from Mongolian Shilajit extract, cognitive-related AD activity assay, development of a simultaneous analysis method for multi-compounds content using HPLC-UV, and origin identification to establish the standard quality control criteria for Mongolian Shilajit. The Mongolian Shilajit extract and fractions were evaluated for anti-oxidant and anti-AD activity. Among them, the n-BuOH fraction showed the greater anti-oxidant and anti-AD activity. Syringaldehyde, benzoic acid, phthalic acid, hippuric acid, urolithin B, and (+)-usnic acid were identified in the extracts. Hippuric acid (
Materials and Methods
Plant and Raw Materials
X. somloensis and Mongolian Shilajit samples (Figure 3) were both collected from the Khovd aimag - Ховд аймагin, Mongolia in April 2020. They were authenticated by Professor Wan Kyunn Whang, and Professor Enkhjargal Enkhtaivan of the Mongolian Academy of Sciences Institute of General and Experimental Biology in Mongolia.
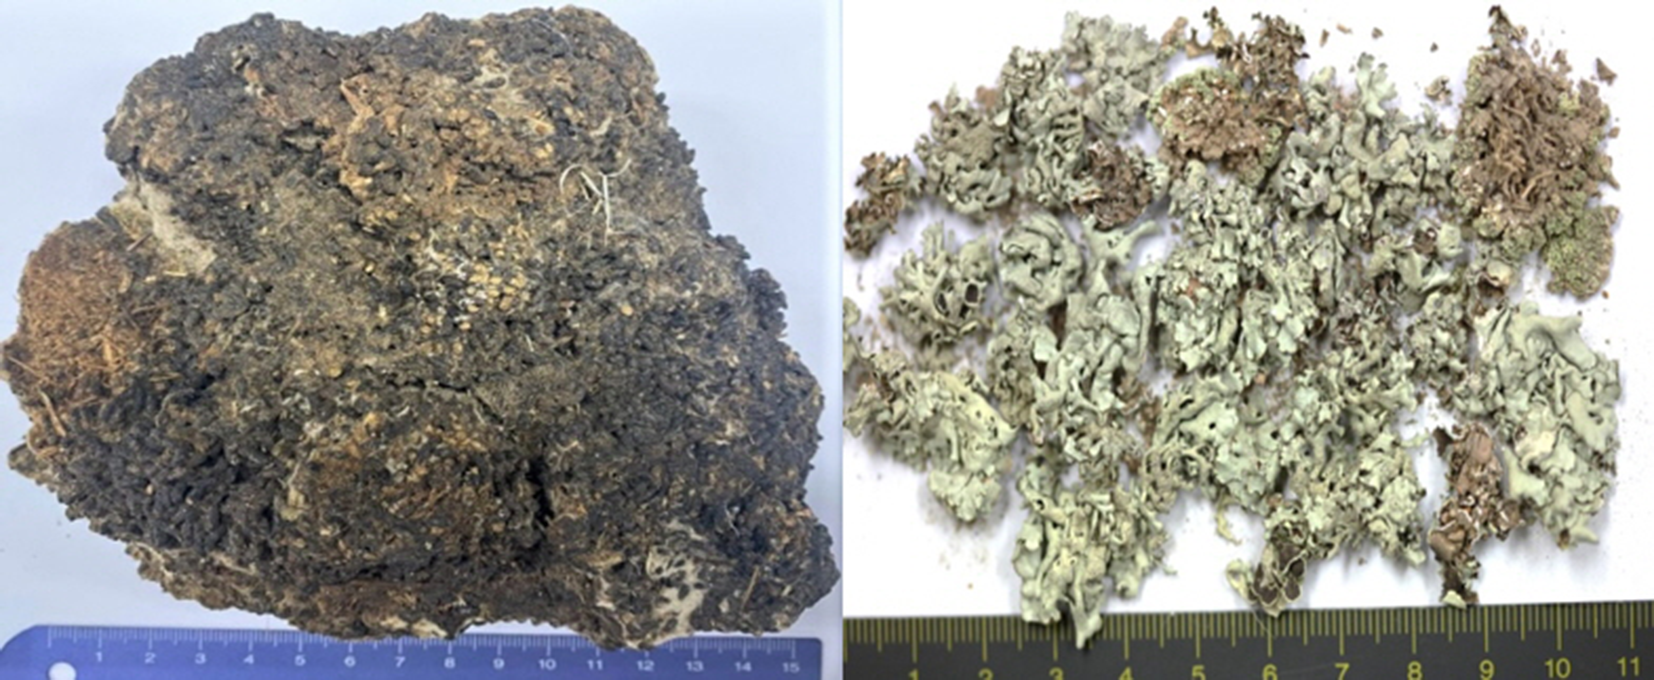
Mongolian shilajit, X. Somloensis (Gyel.) Hale.
Instruments and Reagents
Ethanol (EtOH), methanol (MeOH), n-hexane, dichloromethane (CH2Cl2), ethyl acetate (EtOAc), n-butanol (n-BuOH), and distilled water were used as solvents for extraction, fractionation, and open column chromatography. The open column chromatography was conducted using Sephadex LH-20 (25, 100 µm; Pharmacia, Stockholm, Sweden), MCI CHP 20P gel (Supelco, St. Louis, MO, USA), and octadecylsilane (ODS) gel (400, 500 mesh; Waters, Milford, MA, USA) columns. Dimethyl sulfoxide-d6 (DMSO-d6 ), MeOH-d4 (CD3OD), and chloroform-d (CDCl3; Sigma Aldrich Co., St. Louis, MO, USA) were used as solvents for nuclear magnetic resonance (NMR) imaging. The proton (1H)- and carbon (13C)-NMR spectra were recorded at 600 and 150 MHz, respectively, using a JEOL ECZ600R spectrometer (JEOL, Tokyo, Japan). Chemical shifts are presented as parts per million (ppm) on the δ scale, and coupling constants (J) are shown in Hertz. Electron ionization-mass spectrometry (EI-MS) was performed using UHPLC-ESI/LTQ-HRMS with an Ultimate 3000 rapid separation LC system (Thermo, Darmstadt, Germany). HPLC was conducted using Empower Pro 2.0 software, a Waters 2695 system pump with a Waters 2489 photodiode array detector (Waters, Milford, MA, USA), and a Nouryon Kromasil C18 separation column (4.6 × 250 mm, 5 µm, Bohus, Sweden). HPLC-grade solvents, such as acetonitrile, distilled water, acetic acid, and formic acid were obtained from Thermo Fisher Scientific (Waltham, MA, USA). The DPPH free radical-scavenging activity and anti-AD inhibitory assays were performed using an Infinite® F200 PRO spectrophotometer (Männedorf, Zürich, Switzerland). Other solvents and reagents, including DMSO, L-ascorbic acid, DPPH, sodium phosphate buffer, sodium azide, electric-eel AChE, horse serum BChE, acetylthiocholine iodide, butyrylthiocholine chloride, 5,5-dithiobis [2-nitrobenzoic acid] (DTNB), bovine serum albumin (BSA), glucose, fructose, berberine chloride, and aminoguanidine (AG) hydrochloride were purchased from Sigma-Aldrich Co. (St. Louis, MO, USA). BACE1 FRET assay kits (β -Secretase) were purchased from PanVera Co. (Madison, WI, USA).
Extraction, Fractionation, and Isolation of Mongolian Shilajit
Dried and powdered Mongolian Shilajit (1.0 kg) was extracted with MeOH (5 L × 3) at 28 ℃. The solution was filtered, and the dry extract (340.5 g) was obtained after the solvent was removed in vacuo. This was suspended in water and sequentially partitioned with n-hexane, CH2Cl2, EtOAc, and n-BuOH (each, 5 L × 3 times), and the yield of the various solvent fractions was obtained (5.20 g, 12.24 g, 9.76 g and 145.74 g, and that of the water fraction was 142.52 g). Among the fractions, the n-BuOH fraction showed the strongest inhibitory effect in the 4 AD inhibitory assays conducted; therefore, we further analyzed this fraction using open column chromatography. The n-BuOH fraction (145.74 g) was also subjected to MCI gel column chromatography with step gradient elution with 5% to 80% MeOH, and 5 sub-fractions were obtained. Sub-fraction 1 (10.1 g) was separated using ODS column chromatography with 5% MeOH, and sub-fractions 1‐1 (3.2 g) to 1‐2 (5.1 g) were obtained. Sub-fraction 1‐1 was separated using Sephadex LH-20 column chromatography with 20% MeOH to obtain compound
UHPLC-ESI/LTQ-Orbitrap-HRMS Conditions
The molecular weights of compounds
HPLC-UV Analysis
Sample preparation
One mg of powdered Mongolian Shilajit and X. somloensis were dissolved in 50% MeOH (1 ml) and filtered through a 0.45 µm syringe filter. For simultaneous content analysis, samples were sonicated with MeOH and EtOH at different concentrations (30%, 50%, 70%, and 100%) and extraction times (30, 60, 90, and 120 minutes). All samples were filtered through a 0.45 µm syringe filter.
Preparation of standard solution
One mg of isolated compounds
Analytical conditions
For the analysis of compounds
Validation
To verify the reproducibility and trueness of the HPLC-UV method, specificity, linearity, limit of detection (LOD) and limit of quantitation (LOQ), precision, and trueness were evaluated through the recovery.
Specificity
Optimal ultraviolet wavelength screening was conducted using HPLC-PDA under UV 210‐400 nm.
Linearity
The stock standard solution (compounds
Limit of detection and limit of quantitation (LOD, LOQ)
These was determined as the quantifiable concentration of the compounds having a signal-to-noise ratio of ≥3.3 and ≥10, respectively.
Precision and trueness
Standard mixtures (40, 60, and 100 µg/mL) were used for intra and inter day precision analysis. Precision (coefficient of variation [C.V%]) and trueness (%) were calculated using the linear range of the standard curves of the 3 different concentrations (40, 60, and 100 µg/mL) within 1 day or 3 consecutive days. Intra-inter day trueness was marked as the observed concentration value relative to the true concentration. The intra-inter day precisions was marked as the relative standard deviation (RSD).
Bioactivity assay
Anti-oxidant activity
DPPH Free Radical-Scavenging Activity
DPPH free radical-scavenging activity was measured using methods described in previous studies, 25,38 with modifications. All test samples were dissolved in 10% DMSO at 5 different concentrations (10, 500 µg/mL for the extract and fractions and 100‐1000 µM for the compounds). The assay mixture consisted of 180 µL 0.1 mM DPPH in EtOH and 20 µL of the test samples. The mixture was shaken for 10 s using a vortex mixer and incubated at 37 °C for 20 minutes. The reaction was performed in a 96-well plate, and the activity was measured using a UV-Visible (VIS) spectrophotometer at 517 nm with L-ascorbic acid as a positive control. 25 The inhibitory activity was calculated using the following formula: (Ac − As/Ac) ×100, where Ac and As are the absorbance values of the control and sample, respectively. The half-maximal free radical-scavenging activity concentration (FSC50) values of triplicate measurements of the samples and L-ascorbic acid, as the control, were calculated and expressed as the mean ± standard deviation (SD).
Anti-AD Activity
Cholinesterase (ChE) inhibitory activity
The cholinesterase (ChE) inhibitory activity was measured as previously reported, 17,39 with modifications, using AChE and BChE. All test samples were dissolved in 10% DMSO at 5 different final concentrations (10, 800 µg/mL for the extract and fractions and 10‐500 µM for the compounds). The assay mixture consisted of 20 µL of the test samples, 140 µL of 100 mM sodium phosphate buffer at pH 8.0, and 20 µL of 0.36 U/mL of either AChE or BChE. The mixture was incubated in a 96-well plate at room temperature for 15 minutes; then, 10 µL each of 0.5 mM DTNB and either ACh or BCh was added, followed by 15 minutes incubation. Subsequently, the mixture was analyzed at 412 nm using a spectrophotometer. Berberine, a typical ChE inhibitor, was used as a positive control. 31 Inhibitory activity was calculated using the following formula: (Ac − As/Ac) ×100, where Ac and As represent the change in absorbance for the control and sample, respectively, after 15 minutes. The half-maximal inhibitory concentration (IC50) values of triplicate measurements of the samples and berberine, as the control, were calculated and expressed as the mean ± SD.
BACE1 inhibitory activity
BACE1 activity was measured using a kit according to the manufacturer’s recommended protocol. All test samples were dissolved in 50 mM sodium acetate (pH 4.5) at 5 different final concentrations (25, 250 µg/mL for the extract and fractions and 25‐250 µM for the compounds). The assay mixture containing 10 µL of the test samples and 10 µL 1.0 U/mL BACE1 substrate (75 µM Rh-EVNLDAEFK-Quencher in 50 mM ammonium bicarbonate) was shaken for 5 s in a vortex mixer. To start the reaction, 10 µL BACE1 enzyme was added to the assay mixture in a blank 384-well plate, followed by incubation for 60 minutes at room temperature; then 10 µL BACE1 stop solution (50 mM sodium acetate at pH 4.5) was added. The fluorescence was subsequently measured using a spectrofluorometer at excitation and emission wavelengths of 545 and 585 nm, respectively, with quercetin as a positive control. 32 The inhibitory activity was calculated using the following formula: (Ac − As/Ac) ×100, where Ac and As represent the change in fluorescence of the control and sample, respectively, after 60 minutes. The IC50 values of triplicate measurements of the samples and quercetin were calculated as the mean ± SD.
Inhibitory activity against AGE formation
Inhibition of AGE formation was measured as described in previous studies, 32 with modifications. All test samples were dissolved in 10% DMSO to 5 different final concentrations (10, 500 µg/mL for the extract and fractions and 10‐100 µM for the compounds). The assay mixture contained the following constituents: BSA (10 mg/mL), substrate as 0.4 M fructose and glucose, and 50 mM phosphate buffer (pH 7.4) with 0.02% sodium azide. The assay mixture was incubated in a black 96-well plate at 60 °C for 48 hours, and the fluorescence was measured using a spectrofluorometer at excitation and emission wavelengths of 350 and 450 nm, respectively. AG hydrochloride was used as a positive control. 32 The inhibitory activity was calculated using the following formula: (Ac − As/Ac) ×100, where Ac and As represent the fluorescence of the control and sample, respectively. The IC50 values of triplicate measurements of the samples and AG hydrochloride were calculated and expressed as mean ± SD.
Statistical Analysis
All assays were performed in triplicate, and the data, which are presented as the mean ± SD, were analyzed using one-way analysis of variance. Differences in the results were considered statistically significant at P < 0.05, P < 0.01, and P < 0.001.
Footnotes
Acknowledgments
This research was supported by the Chung-Ang University Research Scholarship Grants in 2019.
Declaration of Conflicting Interests
The author(s) declared no potential conflicts of interest with respect to the research, authorship, and/or publication of this article.
Funding
The author(s) disclosed receipt of the following financial support for the research, authorship, and/or publication of this article: This work was supported by the Chung-Ang University Research Scholarship Grants in 2019.