
Abstract
Alzheimer’s disease (AD) is a progressive neurodegenerative disorder. Neurite atrophy and synaptic loss initiate the onset of neuronal death, while the activated M1 microglia-induced neuroinflammatory microenvironment inhibits neurite regeneration and exacerbates neuronal loss. Thus, optimizing the brain microenvironment using small compounds through suppressing activated M1 microglia and promoting neurite regrowth might be an effective therapeutic strategy for AD. We found that hederagenin (HED), a naturally occurring triterpene compound, inhibited lipopolysaccharide-induced nitric oxide generation and downregulated expression of proinflammatory cytokines, such as tumor necrosis factor-α, interleukin-1β (IL-1β), and IL-6. Further investigation of primary microglia confirmed that HED inhibited Iba-1 positive M1 microglia. However, no changes were seen in CD206 positive M2 microglia polarization. HED remarkably suppressed phosphorylated nuclear factor kappa-light-chain-enhancer of activated B cells subunit p65 signaling. In addition, HED ameliorated Aβ25-35-induced neuritic atrophy and neuronal death. Therefore, HED might be a therapeutic candidate for AD.
Microglia are the resident immunocytes in the brain. They are classified as M1 and alternative M2 phenotypes. 1 M1 microglial inflammatory responses contribute to the regulation of brain homeostasis, creating a harmful microenvironment that accelerates neurite degeneration in neurodegenerative diseases, such as Alzheimer’s disease (AD). Lipopolysaccharide (LPS) is a representative stimulator of M1 microglia. 2,3 The activation of M1 microglia promotes the secretion of proinflammatory molecules, including tumor necrosis factor-alpha (TNF-α), interferon-gamma (IFN-γ), interleukin-1 beta (IL-1β), and nitric oxide (NO), followed by accelerated neuroinflammation and neuronal death. 4 Microglial activation is the main cause of neuroinflammation in AD. 5 Polarization of microglia to the M1 phenotype is accompanied by disease progression. 6,7 Thus, the inhibition of M1 microglial polarization contributes to the amelioration of the neuroinflammatory microenvironment in the brain in AD.
Neurite atrophy is another hallmark of AD, except for microglia activation. Neurite degeneration probably triggers and promotes neuronal apoptosis in AD. 8 We demonstrated the importance of neurite regeneration-induced reconstruction of neuronal networks for the improvement of memory. 9 However, there are no effective therapies for memory function recovery in AD treatment that involve modulation of brain homeostasis and neuronetwork reconstruction. Therefore, the discovery of effective natural products capable of modulating the brain microenvironment and supporting neurite regeneration would be beneficial for the treatment of AD.
We have recently reported that naringenin (Nge) is a useful M1 microglia inhibitor for the treatment of AD. 7 In our ongoing screening of naturally occurring anti-inflammatory compounds, hederagenin (HED; Figure 1) exhibited a potent anti-neuroinflammatory effect in LPS-stimulated microglia. HED has been reported to possess diverse bioactivities, such as the inhibition of leishmania, tumors, acute edematous inflammation, and LPS-induced NO production in macrophages. 10 -12 Nevertheless, whether HED regulates neuroinflammation via microglial polarization and its specific molecular mechanism remains unknown. In addition, the effects of HED on neurite outgrowth and neuroprotection are unclear.

Chemical structure of hederagenin.
In the present study, we investigated the effects of HED on microglial inflammatory responses in microglia and neurite outgrowth in primary neurons.
Results and Discussion
LPS activated M1 microglia and was associated with the strong release of NO. 13 NO and other reactive oxidative species (ROS) enhance transactivation of nuclear factor kappa-light-chain-enhancer of activated B cells (NF-κB) and induce oxidative stress, promoting neuroinflammation, and neuronal death. 14 Thus, we evaluated the effects of HED on LPS-stimulated NO production. We previously reported that LPS significantly increased the production of NO at concentrations ranging from 10 to 1000 ng/mL without cell toxicity. 15 We used LPS at a concentration of 100 ng/mL for the following investigations. Different doses of HED (0.01-25 μM) were used for the 24-hour treatment of either BV2 microglia or LPS-treated microglia. Compared with the control cells, neither HED nor LPS co-treatment was toxic to the BV2 microglia (Figure 2(A)). LPS treatment significantly increased NO release and pretreatment with HED significantly inhibited NO release (Figure 2(B)). HED showed a wide range (0.01-25 μM) for NO release inhibition. However, the NO inhibitive effects of HED were slightly increased from 0.01 to 1 µM but decreased from 1 to 25 µM, and thus 1 µM HED might be the most appropriate dose for NO inhibition. Following the increase of HED concentration, the cell variability was slightly increased, which indicated that the BV2 microglia might be activated, but the mechanism remains to be elucidated. Therefore, we chose 1 and 10 µM HED in the following study.

Effects of hederagenin (HED) on lipopolysaccharide (LPS)-induced cell viability and nitric oxide (NO) production in BV2 microglia. Cell viability was detected by 3-(4,5-dimethylthiazol-2-yl)−2,5-diphenyltetrazolium bromide assay and NO release was detected by Griess reagent method. The data are normalized to the control (A) and shown as the mean ± SEM of at least 3 independent experiments. **P < 0.01 and ***P < 0.001 versus vehicle (Veh, B), one-way analysis of variance and Dunnett’s post hoc test.
IL-1β, IL-6, TNF-α, and IL-10 are important cytokines that modulate neuroinflammation and the brain microenvironment in AD. 4 NF-κB is significantly activated and levels of inflammatory cytokines, such as IL-1β, TNF-α, and IL-6, are significantly increased in neuroinflammatory and AD models in vitro and in vivo. 16,17 Thus, we investigated the effects of HED on the LPS-induced secretion of cytokines. Enzyme-linked immunosorbent assay (ELISA) was performed on LPS-stimulated BV2 microglia (Figure 3(A)). We confirmed that LPS-induced NO production was significantly inhibited after a 12-hour pretreatment with HED (Figure 3(B)). Nge was used as a positive control, as in our previous report. 7 The levels of IL-1β, TNF-α, and IL-6 were significantly increased, whereas those of IL-10 were decreased compared with the levels in the control group after LPS treatment. IL-1β, TNF-α, and IL-6 productions were significantly inhibited after the 12-hour pretreatment with either 1 and 10 µM HED or Nge (Figure 3(C)–(E)). However, HED did not recover the LPS-induced decrease in IL-10 levels (Figure 3(F)).
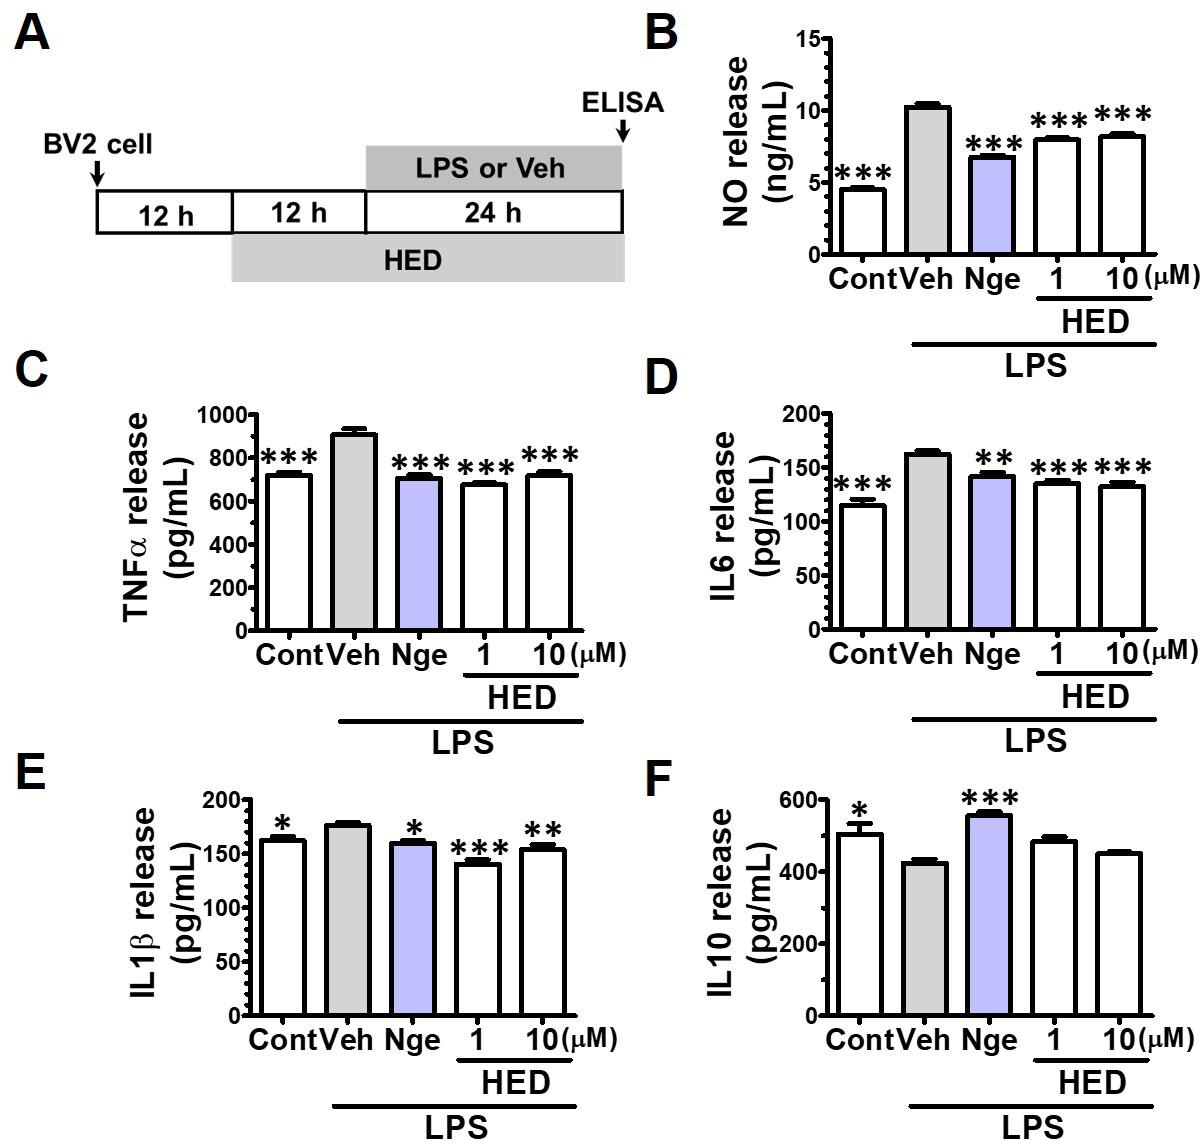
Effects of hederagenin (HED) on lipopolysaccharide (LPS)-induced nitric oxide (NO), tumor necrosis factor-alpha (TNF-α), interleukin (IL)-6, IL-1β, and IL-10 production in BV2 microglia. Concentrations of TNF-α, IL-6, IL-1β, and IL-10 were determined by enzyme-linked immunosorbent assay kit. The data are shown as the mean ± SEM of triplicate experiments. *P < 0.05, **P < 0.01, and ***P < 0.001 versus vehicle (Veh), one-way analysis of variance and Dunnett’s post hoc test.
M1 microglia associated inducible NO synthase (iNOS) protein overexpression leads to NO overproduction, which is involved in AD. 4 Also, the generation of NO is mostly intervened by iNOS. 18 Moreover, M1 microglia express specific proteins, including CD16/32 and iNOS, and M2 microglia express Arginase I, CD206, and Ym1. 7 To confirm whether HED affects microglial polarization, 1 and 10 µM HED were used to pretreat primary microglia for 2 hours followed by treatment with 100 ng/mL LPS for another 24 hours (Figure 4(A)). The analysis results showed that CD206 expression was significantly downregulated, while that of iNOS was upregulated after LPS treatment (Figure 4(B) and (C)). Pretreatment with 1 and 10 µM HED significantly decreased iNOS expression. The expression of CD206 was not altered. We concluded from the results that HED exerts anti-inflammatory effects by M1 microglial inhibition without the influence of M2 microglial polarization.

Effects of hederagenin (HED) on lipopolysaccharide (LPS)-induced microglial polarization. (A) Experimental schedule. (B) Representative images are immunostained for M1 microglia (inducible nitric oxide synthase [iNOS] green) and M2 microglia (CD206, red). (C) iNOS and CD206 expression per cell was quantified. The data are shown as the mean ± SEM of triplicate experiments. *P < 0.05, **P < 0.01, and ***P < 0.001 versus vehicle (Veh), one-way analysis of variance and Dunnett’s post hoc test.
LPS induces an inflammatory response by targeting toll-like receptor 4 (TLR4). 19 After the stimulation of TLR4 by LPS, downstream of IκB kinase (IKK), IκB is triggered to promote the nuclear transduction of transcriptional elements, including NF-κB and activator protein-1. 20 NF-κB plays a critical role in inflammatory diseases by regulating levels of ROS and inflammatory cytokines, 20 while, the phosphorylation of p65-nuclear factor-kappa B (NF-κB) and p38-mitogen-activated protein kinase signaling pathways also play key roles in the regulation of proinflammatory cytokines and M1 microglial polarization. 3,21 Therefore, we investigated the expression levels of phosphorylated p65 (p-p65) and phosphorylated p38 (p-p38) in LPS-induced microglia. BV2 microglia were pretreated with 1 and 10 µM HED for 12 hours followed by treatment with LPS for 1 hour. The expression levels of p-p65 and p-p38 were quantified using immunocytochemical analysis (Figure 5(A)). The results indicated that LPS treatment highly phosphorylated p65 and p38, whereas HED treatment significantly downregulated the expression of p-p65 (Figure 5(B) and (C)), but not of p-p38 (Figure 6). To validate the effects of HED on p65 and p38 phosphorylation, we measured the expression of phosphorylated p65 and p38 using ELISA kits. Phosphorylated p38 and p65 were increased after LPS treatment, while HED treatment significantly downregulated the expression of p-p65, but not of p-p38 (Figures 5(D) and 6(C)).

Effects of hederagenin (HED) on lipopolysaccharide (LPS)-induced phosphorylation of nuclear factor kappa-light-chain-enhancer of activated B cells (NF-κB) p65. (A) Experimental schedule. (B) Representative images immunostained for 4′,6-diamidino-2-phenylindole (DAPI, blue) and p-p65 (red). Phosphorylation of p65 (C) per cell was quantified. Phosphorylation of p65 per mg total protein was quantified with an enzyme-linked immunosorbent assay kit (D). The data are normalized to the control and shown as the mean ± SEM of triplicate experiments. *P < 0.05, **P < 0.01, and ***P < 0.001 versus vehicle (Veh), one-way analysis of variance, and Dunnett‘s post hoc test.

Effects of hederagenin (HED) on lipopolysaccharide (LPS)-induced phosphorylation of mitogen-activated protein kinase (MAPK) p38. (A) Representative images immunostained for 4′,6-diamidino-2-phenylindole (DAPI, blue) and p-p38 (red). Phosphorylation of p38 (B) per cell was quantified. Phosphorylation of p65 per mg total protein was quantified with an enzyme-linked immunosorbent assay kit (C). The data are normalized to the control and shown as the mean ± SEM of triplicate experiments. ***P < 0.001 versus vehicle (Veh), one-way analysis of variance and Dunnett’s post hoc test.
Phosphorylation of the RELA/p65 subunit is essential for the cytoplasmic-to-nuclear localization of NF-κB/p65 and binding with CBP/p300, which increases inflammatory gene transcription. 1,22 Therefore, the effect of HED on inhibition of inflammatory response is probably through the dephosphorylation of NF-κB p65.
Aβ or LPS-induced M1 microglia activation are the main causes of neuroinflammation in AD. Activated M1 microglia release proinflammatory molecules, which accelerate neurite atrophy and neuronal apoptosis, and suppress microglia-mediated Aβ fibril degradation. In AD, the classical M1 microglia are activated followed by accumulated inflammatory cytokines that exacerbate brain microenvironments, preventing neuritic regeneration and memory restoration. 18,23 To investigate the effect of HED on neurite extension, we post-treated cultured primary cortical neurons with HED after Aβ25-35 treatment (Figure 7(A)). We have reported previously that Aβ25-35 could inhibit neurite growth as well as Aβ1-42. 9 Compared with the control group, Aβ25-35 treatment significantly decreased the length of β3-tubulin positive neurite density, whereas treatment with 10 µM HED significantly increased neurite density as well as the positive control nerve growth factor (NGF) 9 (Figure 7(A) and (B)). To investigate further the effect of HED on Aβ25-35-induced neuronal survival, primary cortical neurons were co-treated with HED and Aβ25-35. As a result, the neuronal viability was decreased to 62.0% after 3 days of Aβ25-35 treatment compared with that in the control group (Figure 7(C)). In contrast, 10 µM HED attenuated Aβ25-35-induced neuronal apoptosis by 70.3% (Figure 7(C)). NGF did not show protective effects in Aβ25-35 induced neuronal apoptosis. It was reported that HED could promote the degradation of α-synuclein through AMPK-mTOR dependent autophagy signaling and protect against 1-methyl-4-phenyl-1,2,3,6-tetrahydropyridine-induced PC12 cell apoptosis. 24 However, there is no report about the effects of HED on Aβ-induced neuronal apoptosis and neurite atrophy. In the current study, we first found that HED could protect against Aβ-induced neuronal apoptosis and promote neurite outgrowth. Although the mechanism remains unknown, it was reported that phosphorylated NF-κB subunit p65 aggregates in neurites lead to tauopathy-related neurodegenerative disease. 25 Therefore, the effect of HED on inhibition of the neuronal apoptosis is probably through the dephosphorylation of NF-κB p65.
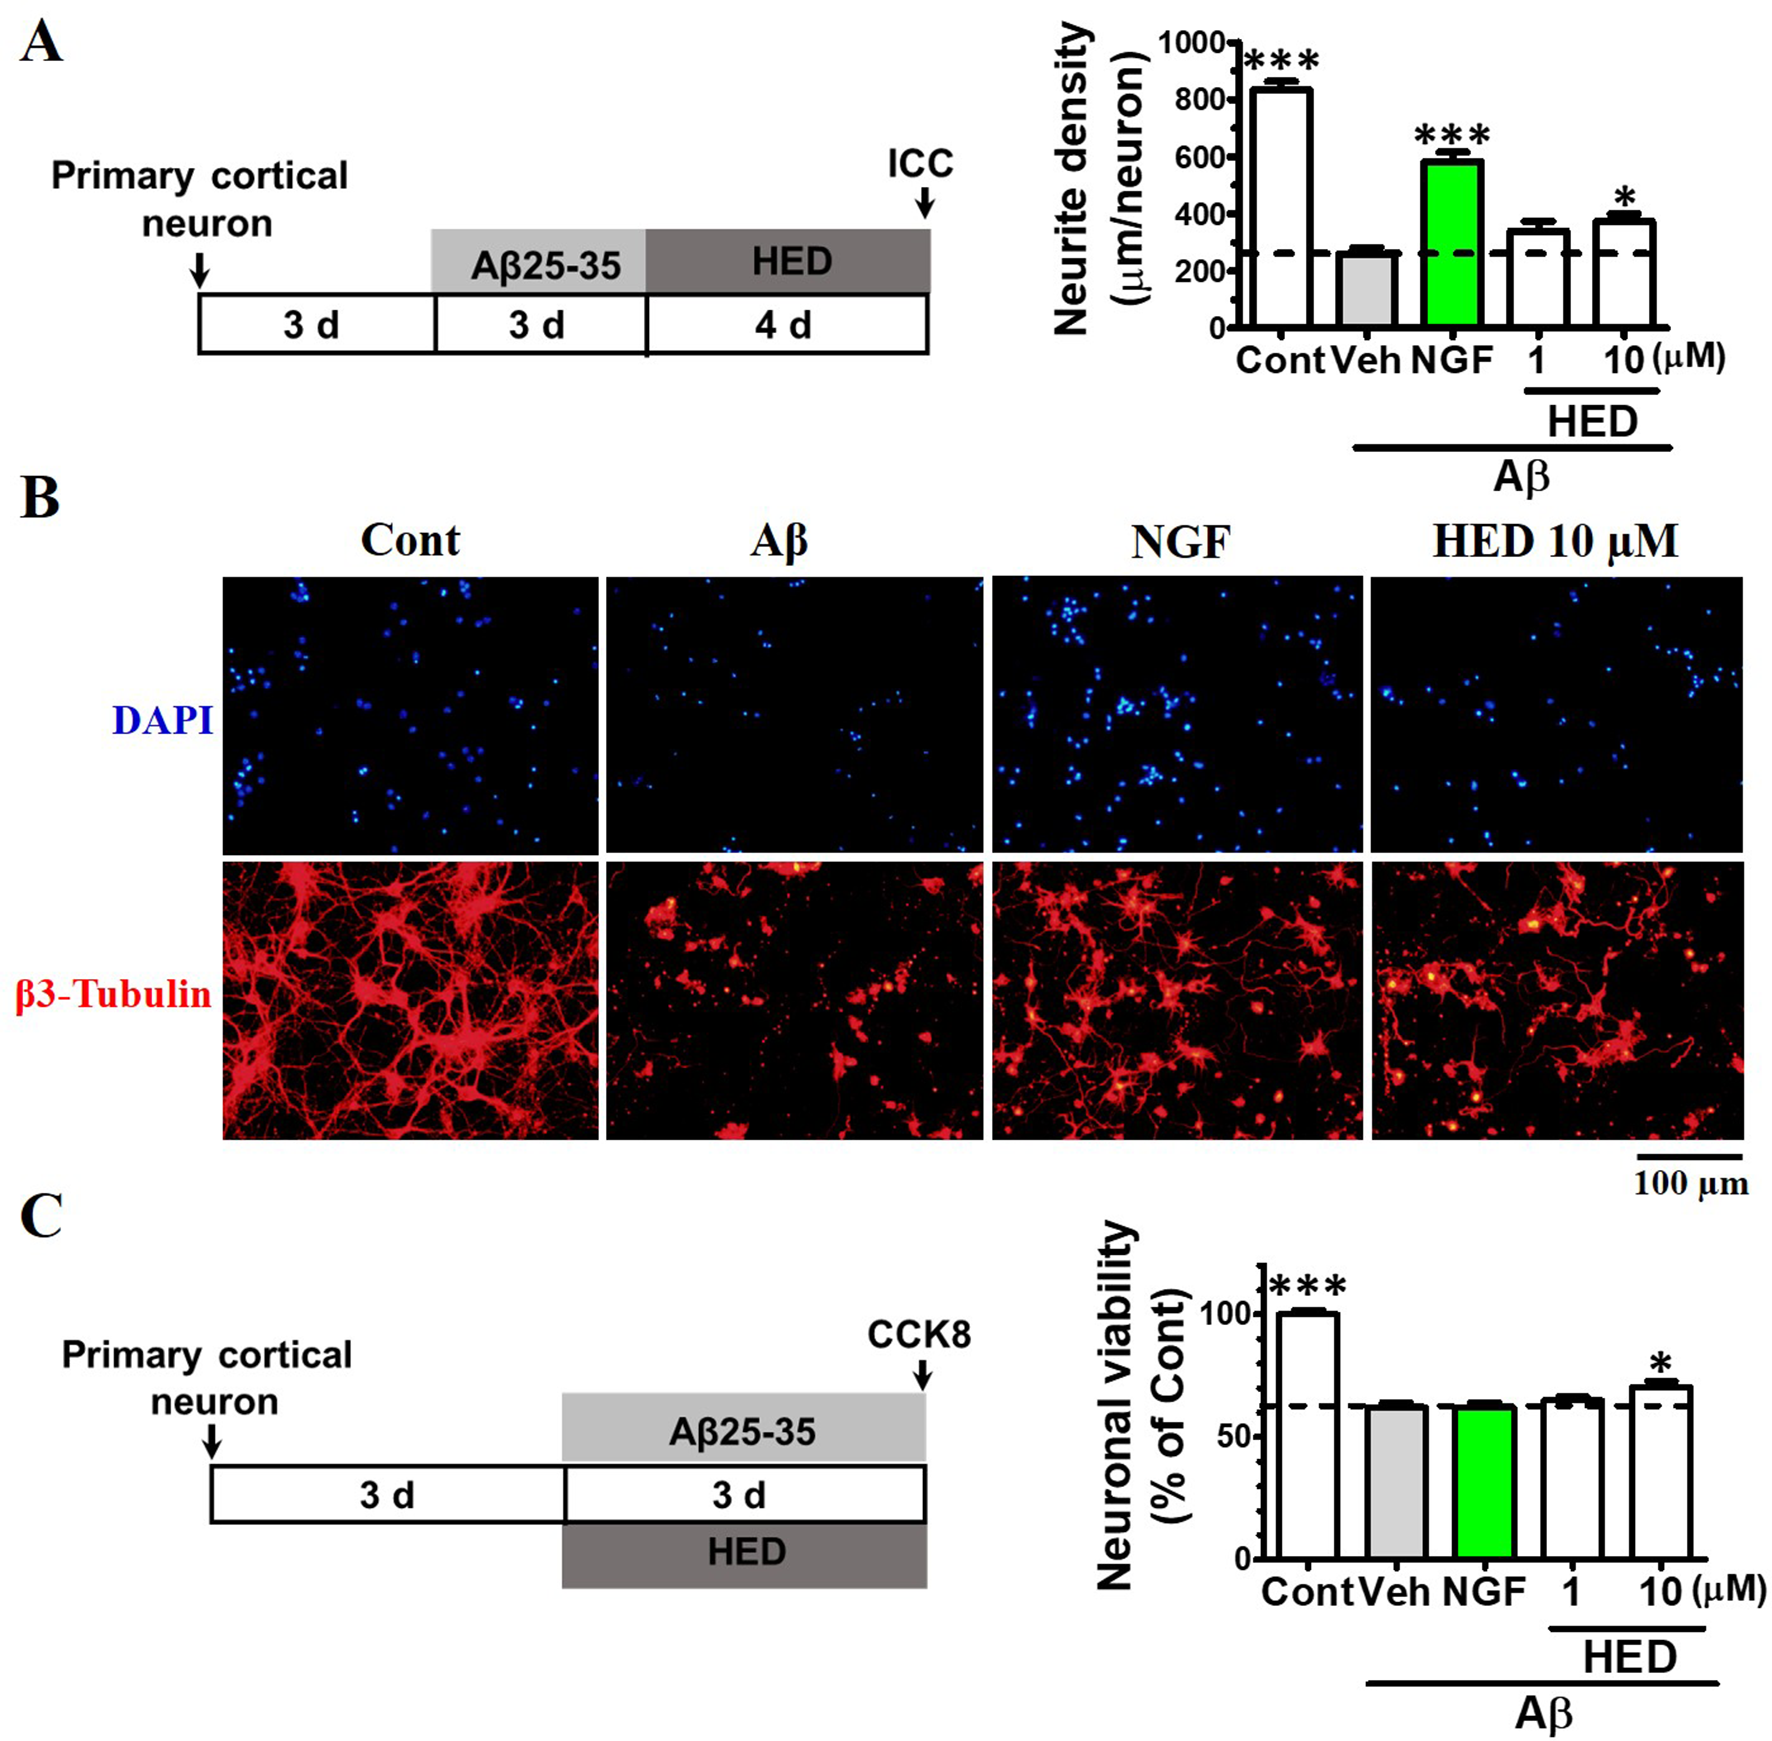
Effects of hederagenin (HED) on Aβ25-35-induced neuritic atrophy and neuronal death. (A) Quantification of total neurite outgrowth and associated statistics. (B) Representative images of β3-tubulin-positive neurites in Aβ25-35 treated group. (C) Effects of hederagenin on Aβ25-35-induced neuronal death. The data are shown as the mean ± SEM of triplicate experiments. *P < 0.05, **P < 0.01, and ***P < 0.001 versus vehicle (Veh), one-way analysis of variance and Dunnett’s post hoc test. Scale bar, 100 µm.
In summary, the present collective findings provide the first evidence that HED can inhibit the production of NO, IL-1β, IL-6, and TNF-α and the expression of iNOS in LPS-stimulated BV2 microglia. HED suppresses NF-κB activation by inhibition of p65 phosphorylation. Furthermore, HED ameliorates Aβ-induced neurite atrophy and neuronal apoptosis. The results implicate HED as a promising candidate for modulation of the brain inflammatory environment and neuronal injury.
Experimental Methods
Reagents and Chemicals
BV2 microglia were purchased from the Cell Bank of Shanghai Institutes for Biological Sciences, Chinese Academy of Sciences (Shanghai, China). HED was obtained from Chengdu Desite Biotech Co. Ltd (Chengdu, China). Other chemicals used were 3-(4,5-dimethylthiazol-2-yl)−2,5-diphenyltetrazolium bromide (MTT; Sigma-Aldrich, St. Louis, MO, USA), CCK-8 (HY-K0301; MedChemExpress, Monmouth Junction, NJ, USA), Aβ25-35 (A4559; Sigma-Aldrich), NGF (Abcam, ab269181), fetal bovine serum (FBS; 10270-106; Gibco, Rockville, MD, USA), Dulbecco’s modified Eagle‘s medium (DMEM, C11995500BT; Gibco), 0.25% trypsin-ethylenediaminetetraacetic acid (EDTA) (25200, 072; Gibco), trypsin inhibitor (17075, 011; Gibco), DNase I (18047, 019; Gibco), LPS (L22654; Sigma-Aldrich), Griess reagent (G2930; Promega, Madison, WI, USA), IL-6, TNF-α, IL-1β, and IL10 ELISA kits (Dogesce, Beijing, China), CD206 (M2 marker, 1:50, sc-58986; Santa Cruz Biotechnology, Dallas , TX, USA), iNOS (M1 marker, 1:200, PA1-036; Invitrogen, Carlsbad, CA, USA), p-p65 (1:100, sc-166748; Santa Cruz Biotechnology), p-p38 (1:100, sc-166182; Santa Cruz Biotechnology), and β3-tubulin (Neuritic marker, 1:200, sc-80005; Santa Cruz Biotechnology). Alexa Fluor 594-conjugated goat antimouse (GAR594) immunoglobulin (Ig)G and Alexa Fluor 488-conjugated goat antirabbit (GAR488) IgG (1:200, Invitrogen) were used as secondary antibodies. 4′,6-Diamidino-2-phenylindole (DAPI; Biomol, Hamburg, Germany) was used for counterstaining. Institute of Cancer Research (ICR) mice were purchased from Guangxi Medical University (Nanning, China). All animal experiments were approved by the Committee for the Care and Use of Laboratory Animals of Guangdong Ocean University.
Primary Cortical Microglia and BV2 Microglial Cultures
BV2 cells were maintained in DMEM supplemented with 10% FBS at 37 °C in a 5% carbon dioxide (CO2) incubator. Primary microglia were obtained from mice cortices as previously reported, with minor modifications. 7,26 Briefly, we dissected the cerebral cortices from ICR mice at postnatal days 2 to 4. The cortices were minced after removing the dura mater and digested with 0.25% trypsin-EDTA at 37 °C for 30 minutes. This was followed by the addition of 600 U/mL of DNase I and 0.3 mg/mL trypsin inhibitor for 15 minutes. The precipitates were collected after centrifugation and resuspended in 10% FBS-DMEM/F12. Bovine serum albumin (BSA, 15% in phosphate-buffered saline [PBS]) was used to remove debris after centrifugation. Precipitates were collected and resuspended in 10% FBS-DMEM/F12 after centrifugation (740 g, 4 minutes). Cells were plated into 6 cm dishes and cultured in an incubator at 37 °C. After 2 weeks, primary microglia were isolated from mixed glia by mild trypsinization. 26
Primary Neuron Culture, Neuronal Viability, and Neurite Density Measurement
Embryos were separated as described previously from a pregnant (14 days) ICR mouse. 9 For neuronal viability measurement, the neurons were incubated in a 96-well dish (20 000 cells per well) for 3 days. The cells were then either stimulated with Aβ25-35 (10 µM) or co-treated with HED for another 3 days. The Aβ25-35 peptide was incubated for 4 days at 37 °C for aggregation. CCK-8 solution was added to the culture medium for 3 hours. An ELISA microplate reader was used to determine the absorbance of the fluorescence at 450 nm. For the neuritic density assay, the neurons were plated in an 8-well slide (10 000 cells per well) for 3 days. The cells were then treated with either HED or vehicle (0.1% dimethylsulfoxide [DMSO]) for 4 days after stimulation with Aβ25-35 (10 µM) for 3 days. NGF (100 ng/mL) was used as a positive control. The neurons were fixed and used for immunocytochemistry.
Microglia Viability Assay
The MTT assay was performed to determine the effects of LPS and/or HED on BV2 microglial viability. Cells were precultured for either 12 or 24 hours in a 96-well plate (2000 cells per well), followed by treatment for another 24 hours with either LPS or HED. MTT (0.5 mg/mL) was added to the cultured microglia and incubated for 3 hours at 37 °C in a 5% CO2 incubator. Formazan crystals were dissolved with the addition of DMSO (150 µL) after removing the cultured medium. For the measurement of viability, an ELISA microplate reader was used to detect absorbance at 570 nm.
NO Measurement
BV2 microglia (2 × 10⁵ cells/mL) were incubated in the DMEM medium for either 12 or 24 hours, followed by pretreatment with HED (0.01, 0.1, 1, 10, 25 µM) for 2 hours and treatment with LPS (100 ng/mL) for another 24 hours. The culture supernatant (100 µL) was collected and mixed with the same volume of Griess reagent (1% sulfanilamide and 0.1% naphthylethylenediamine dihydrochloride in 2.5% phosphoric acid) at 20 °C for 10 minutes in the dark. Absorbance was measured at 540 nm using an ELISA microplate reader.
Measurements of IL-6, IL-1β, TNF-Α, and IL10 Levels
BV2 microglia (2 × 10⁵ cells/mL) were precultured for 12 hours and then pretreated with either HED (1-10 µM) or positive control Nge (10 µM) for 12 hours. LPS (100 ng/mL) was added and co-cultured for 24 hours. The media were collected and the levels of IL-6, IL-1β, TNF-α, and IL10 were measured using ELISA kits according to the manufacturer’s protocol (Meimian biotech, Beijing, China).
Immunocytochemistry
Either primary neurons or microglia was fixed with 4% paraformaldehyde and blocked with 5% normal goat serum. This was followed by immunostaining for iNOS, CD206, p-p65, p-p38, and β3-Tubulin. Alexa Fluor 594-conjugated goat antimouse (GAM594) IgG and Alexa Fluor 488-conjugated goat anti-rabbit (GAR488) IgG were used as secondary antibodies. Nuclei were immunostained with DAPI. A fluorescence microscope was used to capture fluorescence images (259 × 346 µm). Ten photos of each group were captured and ImageJ software (NIH, Bethesda, MD, USA) was used for quantitative analysis, as described previously. 9
Measurement of Phosphorylated P38 and P65 by ELISA
BV2 microglia (2 × 10⁵ cells/mL) were precultured for 12 hours and then pretreated with HED (1-10 µM) for 12 hours, then cells were incubated for 1 hour in either the absence or presence of LPS (100 ng/mL). Cells were washed twice with cold PBS, and total protein was collected and quantified using the bicinchoninic acid method; ELISA (MeiMian, Wuhan, China) was performed for quantification of p-p65 and p-p38 according to the manufacturer’s protocol.
Statistical Analyses
One-way analysis of variance with post hoc Dunnett’s test was used for statistical comparisons. For statistical analyses, GraphPad Prism 5 was used (GraphPad Software, La Jolla, CA, USA). The values of the data are indicated as the mean ± SEM. P values <0.05 were considered significant.
Footnotes
Declaration of Conflicting Interests
The author(s) declared no potential conflicts of interest with respect to the research, authorship, and/or publication of this article.
Funding
The author(s) disclosed receipt of the following financial support for the research, authorship, and/or publication of this article: This research was supported by National Natural Science Foundation of China (81803753), Special Funds for Science and Technology Development of Zhanjiang City (2018A01046), and Natural Science Foundation of Guangdong Province of China (2020A1515010779).