
Abstract
Thirty-two different solvent mixtures containing methanol and acid (acetic, formic, and hydrochloric); methanol, water, and acid; and pure methanol were tested for their efficiency for extraction of phenolic compounds from aronia (Aronia melanocarpa) belonging to the groups of anthocyanins, flavonols, and hydroxycinnamic acid derivatives. Thirteen compounds were detected and quantified in the extracts using HPLC/DAD/ESI-MS n . The yield of each compound and group was evaluated with regard to the extraction solvent composition. Extraction mixtures containing HCl were superior to the ones containing acetic or formic acid for the extraction yield of total phenolic compounds, which was especially pronounced for anthocyanins. The solvent mixture containing methanol/water/HCl (90:8:2, v/v/v) gave best results for the qualitative and quantitative assay of anthocyanins. However, this solvent mixture caused O-methylation of 3- and 5-caffeoylquinic acids transforming them to 3- and 5-feruloylquinic acids, respectively, during extraction. This peculiar finding must be taken into account during sample preparation for the analysis of polyphenols in any sample. It was observed that this O-methylation is specific for dihydroxycinnamic acid compounds containing neighboring hydroxyl groups. These results suggest the need for a detailed study of the behavior of various polyphenolic compounds during extraction with solvent mixtures containing methanol/HCl since it is very often used for the analysis of anthocyanins.
The antioxidant potential of phytochemicals for human health has been increasingly recognized in recent years. Sufficient evidence has shown that free radicals play an important role in many major health problems such as cancer, cardiovascular disease, and degenerative diseases associated with aging. Polyphenols are especially important antioxidants because of their high redox potentials allowing them to act as reducing agents, hydrogen donors, and singlet oxygen quenchers. 1
Berry fruits have been proven as rich sources of different classes of polyphenols studied for their beneficial health effects. 2 Aronia melanocarpa (Michx.) Elliott belongs to the Rosaceae family and it is a natural shrub growing in Northern America. The dark berries have been used as food resource and also in traditional medicine. 3,4 Aronia berries are high in content of anthocyanins, flavonols, and phenolic acids, 5 which depends on the cultivar, fertilization, stage of berry growth and ripening, harvest date, and habitat/location. 6,7
There have been studies of aronia from different climates confirming that the total phenolic content of aronia berries is in the range from 3440 mg/100 g DW (dry weight), 8 3760 mg/100 g of DW (cultivar “Nero”), 9 4010 mg/100 g DW, 1 4210 mg/100 g DW (cultivar “Viking”), 10 to as high as 7465 mg/100 g DW 11 and 7849 mg/ 100 g DW. 12 Aronia melanocarpa berries are among the richest plant sources of anthocyanins that represent about 25% of total polyphenols, mainly cyanidin glycosides. 12 -15 Procyanidins (PCs) have been identified as the major class of polyphenolic compounds. Total contents of PCs in aronia were determined by different authors to be 3992 mg/100 g DW, 11 5182 mg/100 g DW, 12 as well as 664 mg/100 g FW (fresh weight). 16 Other phenolics in aronia include chlorogenic and neochlorogenic acid and flavonols. In a recent study, besides rowanberry, aronia has been identified as the richest source of phenolic acids among berries (96 mg/100 g FW), 17 representing 7.5% of the total polyphenols. 12 The content of flavonols and (–)-epicatechin in aronia have been found to be significantly lower compared to the other phenolic constituents described above. Flavonols represent only 1.3% of the total aronia phenolics. 12
The critical point in studying polyphenols in plant materials is the extraction procedure used since it controls the type and quantity of polyphenols that will be transferred to the extract and further characterized. Solvent extractions are usually performed using solvents such as water, ethanol, methanol, and acetone, both as pure solvents and mixtures. The solvent can be acidified to enhance extraction, usually by adding 1% acid (v/v) such as HCl, acetic acid, or other acids. 18 Water-alcohol mixtures are more efficient than the corresponding pure solvent systems in extracting phenolic compounds. 19 Specifically, different water-ethanol ratios have been tested and the extraction yields of polyphenols obtained with 50% ethanol (vol.) at different temperatures (20 °C, 40 °C, and 60 °C) were found to be about 2 times higher than the ones obtained with pure water. Numerous studies have been performed to evaluate the effectiveness of different solvents for the extraction and recovery of antioxidant compounds, and ethanol has been shown to be more efficient than water, acetone, hexane, ethyl acetate, and methanol. 20 It has been reported that the optimal composition is around 40% to 70% ethanol in water-EtOH mixtures. 21 -24 Methanol mixtures, sometimes acidified, are the second most used solvent. 25
Different extraction procedures for studying phenolics in plant materials have been thoroughly reviewed by Naczk and Shahidi. 26 Methanol acidified with hydrochloric acid has been used for the extraction of flavonoids and phenolic acids, 27 and flavonols 28 in berries as well as for ellagic acid tannins and quercetin in raspberries, 29 and for anthocyanins and gallic acid derivatives from Arbutus unedo L. fruits. 30 Methanol/water/acetic acid mixture has been used for extraction and systematic study of anthocyanins in fruits and berries. 31
Usually, the conventional solid-liquid extraction of anthocyanins is time-consuming and inefficient. On the other hand, thermal extraction over an optimum period of time may cause the decomposition of anthocyanins and may also lead to the loss of bioactivity. 32 The “ideal” extraction method must provide high extraction rates and should be nondestructive and time saving. 33
Recently, more rapid and automated methods including supercritical fluid extraction, pressurized liquid extraction or microwave-assisted extraction (MAE), ultrasound-assisted extraction (UAE), and accelerated solvent extraction have been used. 32 Ultrasound-assisted extraction has been extensively used to extract anthocyanins from plant materials. 34 In order to obtain a maximum yield of anthocyanins, it is important to specify the optimum extraction conditions for UAE. For extraction of 2 or more compounds having different physicochemical properties, a different approach needs to be followed. Vázquez Espinosa et al 35 compared 2 optimized UAE and MAE methods for the extraction of anthocyanins and total phenolic compounds from Maqui berries. They concluded that UAE gave extracts with higher content of anthocyanins and used smaller amount of solvent than MAE.
In summary, the wide variety of polyphenols in plants implies the need for establishing effective methodology for their efficient extraction and characterization. In that direction, the aim of the present study was to systematically examine the efficiency of extraction of polyphenols from aronia berries in different acidic solvent mixtures. For that purpose, solvent mixtures containing methanol in combination with different acids (formic, acetic, and hydrochloric acid) were used to evaluate the effect of the extraction solvent composition on the yield of different classes of polyphenols and to find out the most efficient one.
Results and Discussion
In this study, spectrophotometric measurements were used in order to test the most efficient extraction solvent system for aronia fruit and then perform the analysis of total polyphenols as well as different classes of polyphenols.
Thirty-two different solvent mixtures containing pure methanol (M) and methanol combined with an acid (acetic, formic, and hydrochloric, with water or with acid and water) were tested for their efficiency for the extraction of total phenolic and total anthocyanin content.
All the results for the total polyphenols and total anthocyanins are summarized in Figure 1. These results clearly demonstrate that 2% or 5% acid in the extraction mixture significantly improves its efficiency for extraction of total phenolics and anthocyanins. It is also evident from the results that both total phenolics and anthocyanins follow the same pattern with regard to the effect of the presence of an acid and water in the extraction mixture.
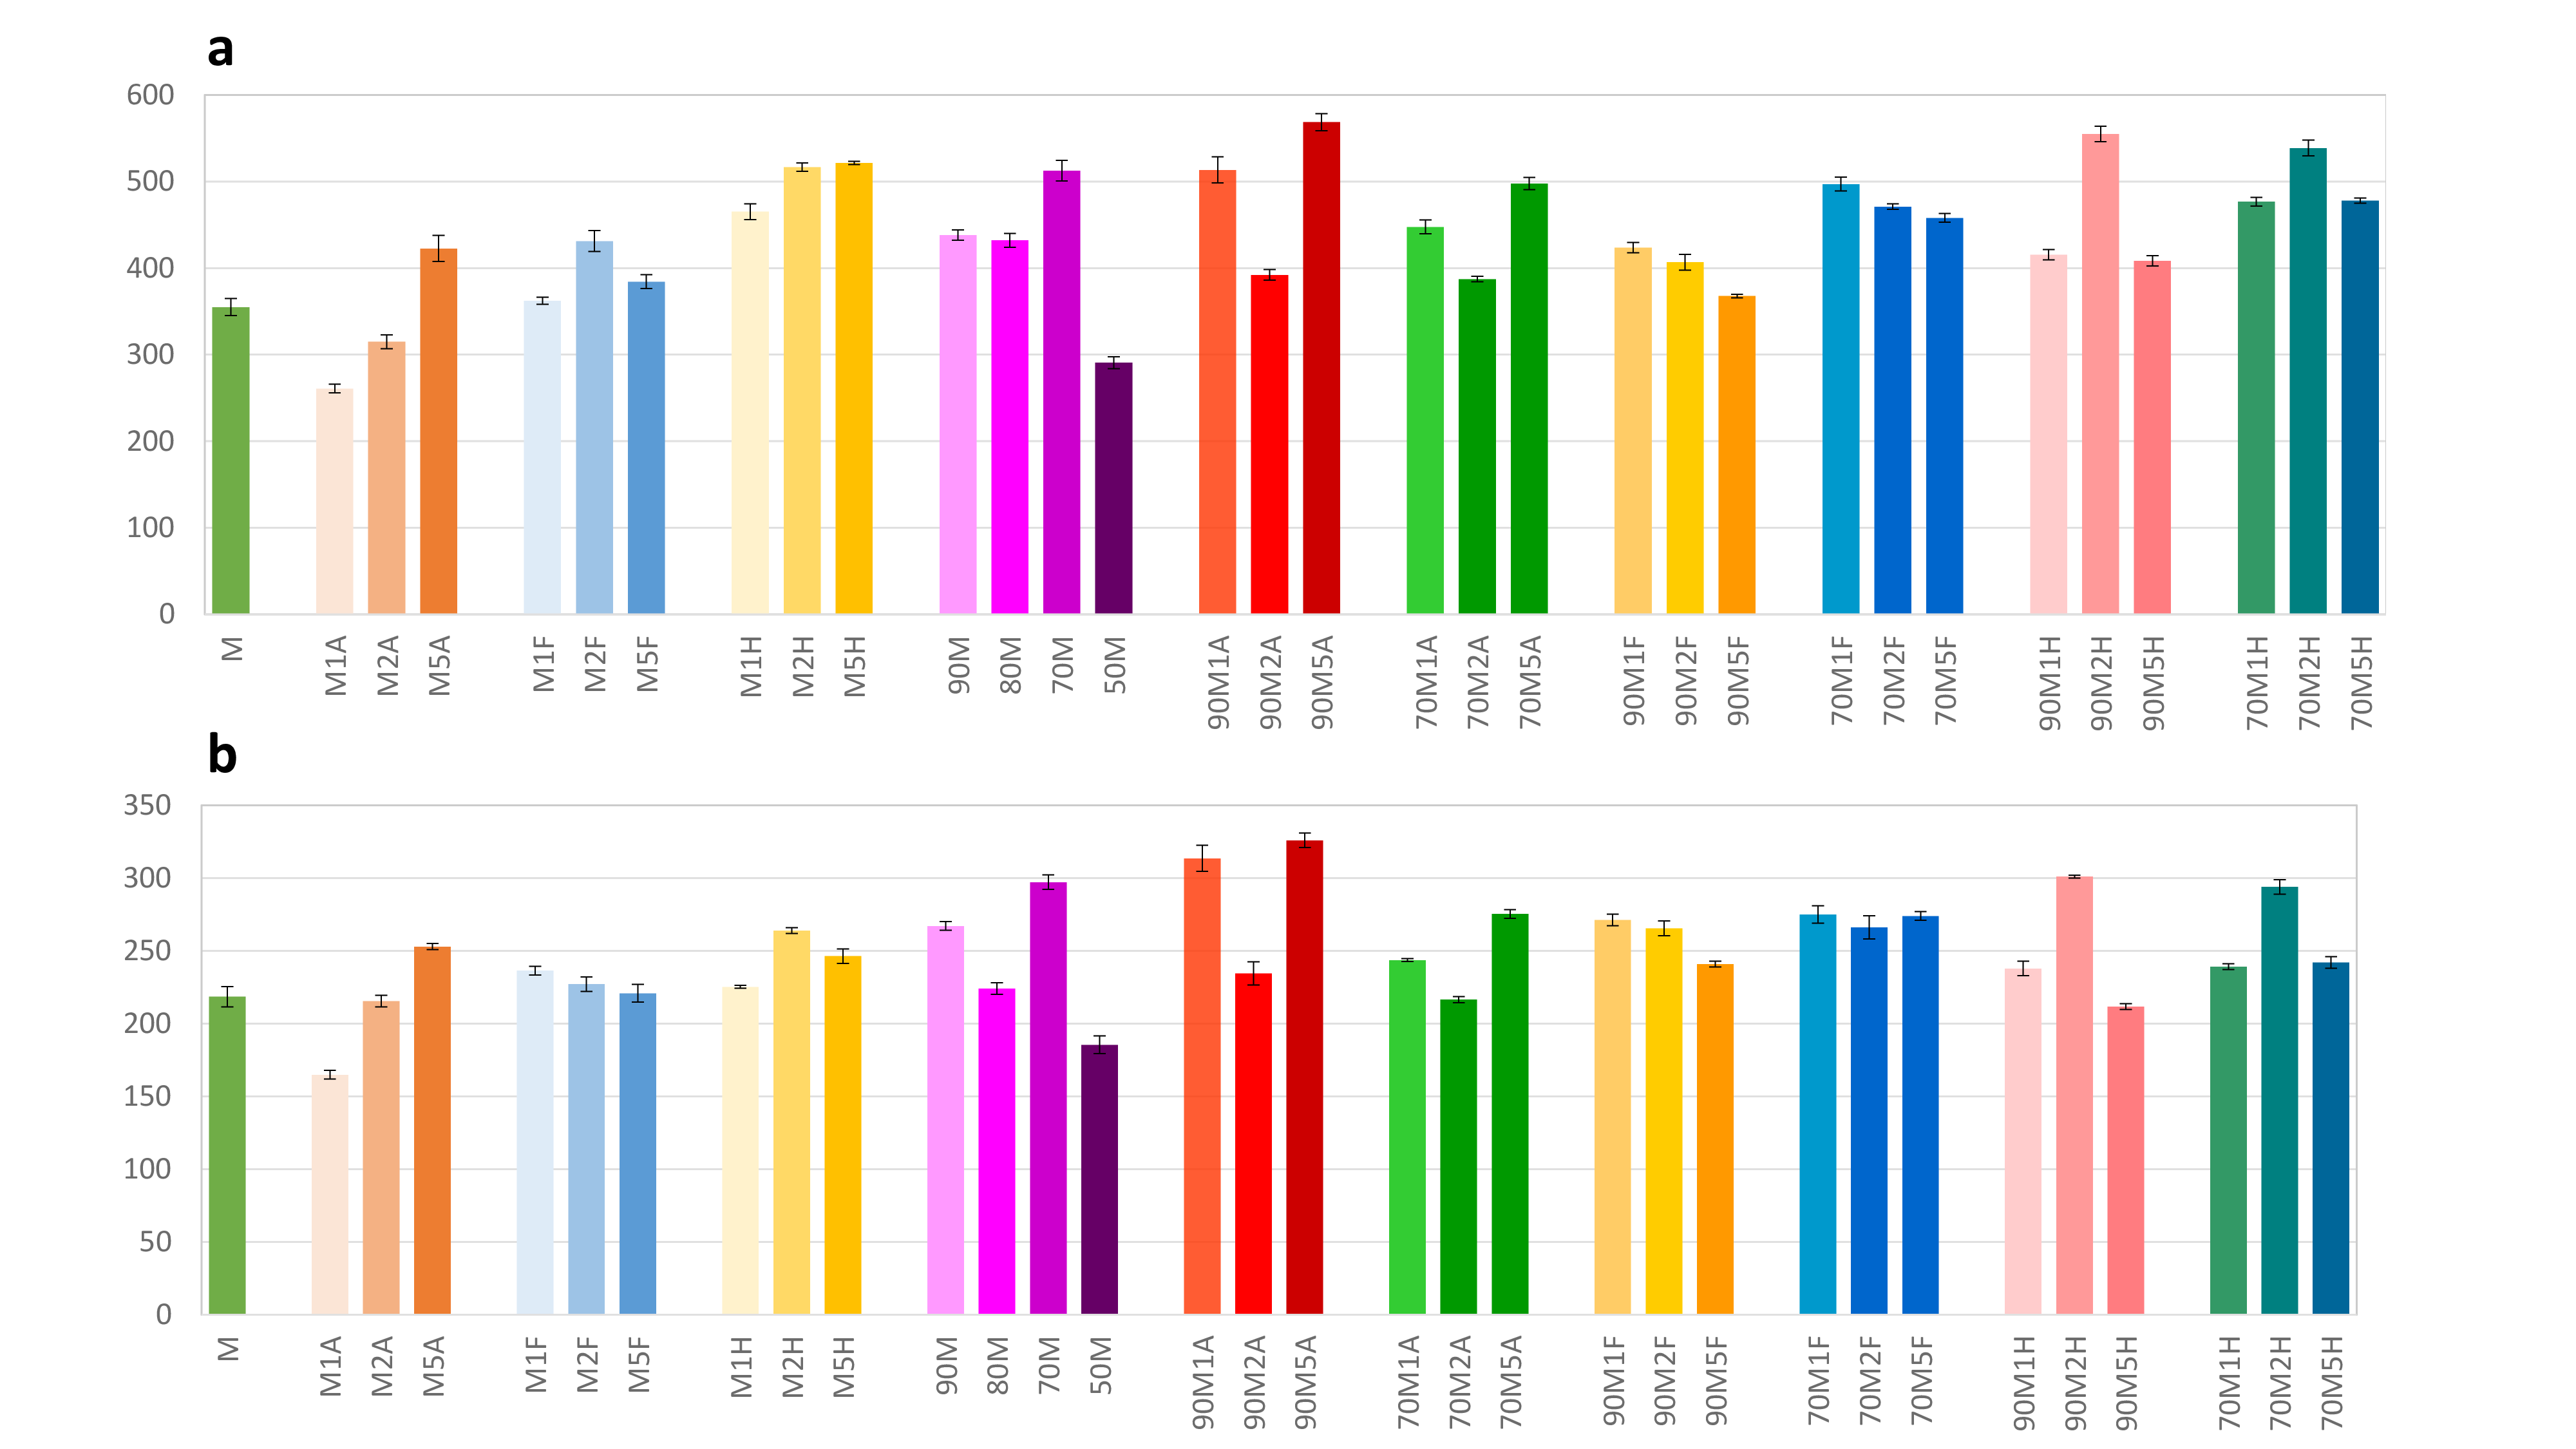
Spectrophotometric data for (a) total phenolic content (mg GAE/100 g) and (b) total anthocyanin content (mg/100 g). The extracts’ symbols are in accordance with Table 3 given in the Experimental section (M: methanol; F: formic acid; A: acetic acid; H: hydrochloric acid).
In order to study the effect of the extraction solvent composition on each specific compound from the classes of anthocyanins, phenolic acids, and flavonoids, an HPLC/DAD/ESI-MS n method previously developed for the analysis of pomegranate polyphenols 36 was applied on all extracts obtained with a solvent containing 2% of each acid.
Twelve compounds have been detected and identified according to their retention behavior, UV-Vis, and mass spectra. Results from the qualitative analysis are shown in Table 1. The characteristic UV spectra of every class of polyphenolic compounds are presented in Figure 2. Typical chromatograms obtained with the extraction mixture 90M2F (methanol/water/formic acid, 90:8:2, (v/v/v) and with the extraction mixture 90M2H (methanol/water/HCl, 90:8:2, v/v/v) are an excellent illustration for the effect of the acid used in the extraction solvent mixture on the differences observed in the corresponding extracts (Figure 3).

HPLC/DAD chromatograms recorded at 330 nm corresponding to extracts obtained with (a) methanol/water/formic acid, 90:8:2 (v/v/v), 90M2F and (b) methanol/water/HCl, 90:8:2 (v/v/v), 90M2H. Peak labels correspond to the compounds in Table 1.

Structures of compounds HA1 and HA2 (3- and 5- caffeoylquinic acid) that are transformed to compounds HA3 and HA4 (3- and 5-feruloylquinic acid), respectively, during extraction with extraction solvent containing HCl.
Retention Times, UV/Vis Spectra, and Characteristic Ions of Polyphenolic Compounds in the Analyzed Extracts.

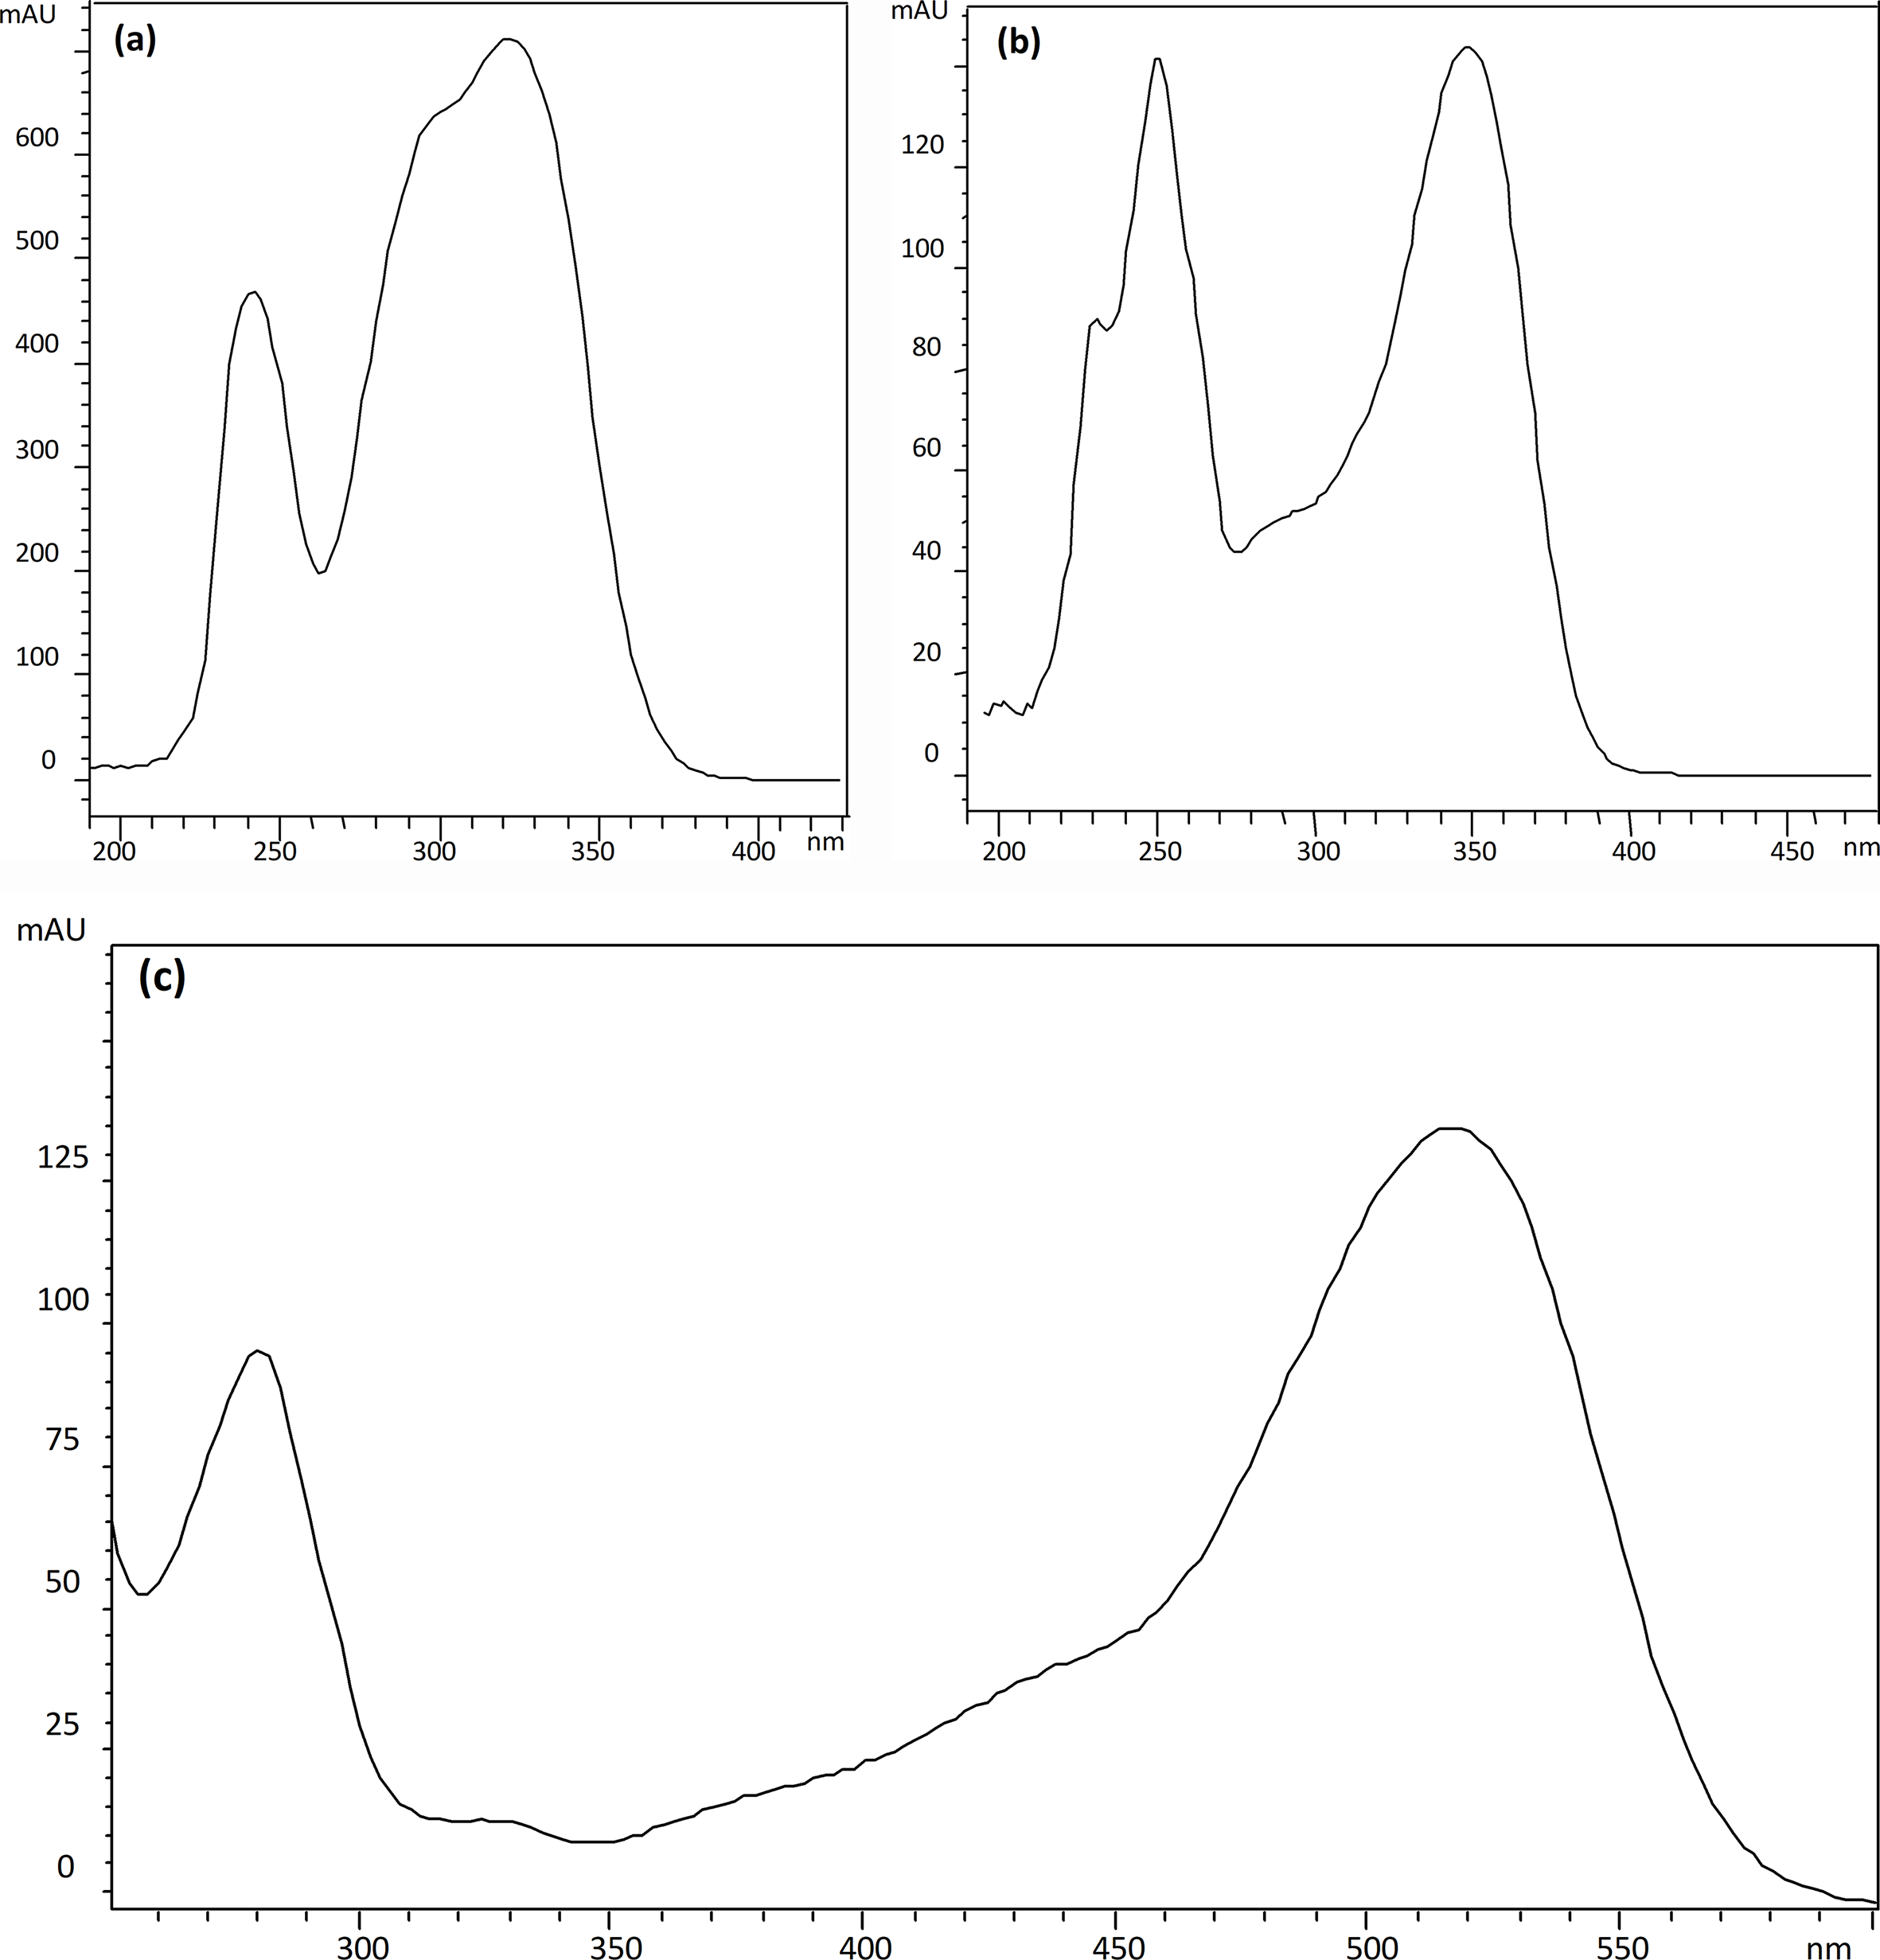
UV spectra of (a) hydroxycinnamic acid derivatives, (b) quercetin derivatives, and (c) cyanidin derivatives.
A very peculiar observation that has arisen from the analysis of the extracts obtained with acetic (and formic acid, as well) was the appearance of only 3- and 5-caffeoylquinic acid (HA1 and HA2), whereas in the extracts obtained with a solvent mixture containing HCl only small amounts of HA1 and HA2 were detected and high amounts of their methylated analogs, ie, 3- and 5-feruloylquinic acid (HA3 and HA4), were found. This fact has not been observed earlier and is a very important finding because it demonstrates that methylation of caffeic acid and caffeoyl derivatives can occur during extraction in HCl containing extraction solvent mixtures and can lead to artifacts formation and reporting of wrong results.
The identified polyphenolic compounds were quantified directly by HPLC/DAD using 5-point regression curves of authentic standards of quercetin (at 350 nm for flavonols), caffeic acid (at 320 nm for phenolic acids), and cyanidin 3-O-glucoside chloride (at 520 nm for anthocyanins). The quantitative data for each compound and for the total content for each of the 3 groups obtained with solvent mixtures with 3 acids were calculated and are given in Table 2.
Contents (mg/100 g Fresh Fruit) of Phenolic Compounds, Hydroxycinnamic Acids, Flavonols, and Anthocyanins in Aronia melanocarpa Obtained by Extraction with 9 Solvent Mixtures (Mean of 3 Replicates ± Standard Deviation).

The extracts’ symbols are in accordance with Table 3 given in the Materials and methods section (M: methanol; F: formic acid; A: acetic acid; H: hydrochloric acid). Means (n = 3) ± SD in the same row followed by same letters are not significantly different by Newman-Keuls test (P < .05)
Composition of Extraction Mixtures in % (v/v).
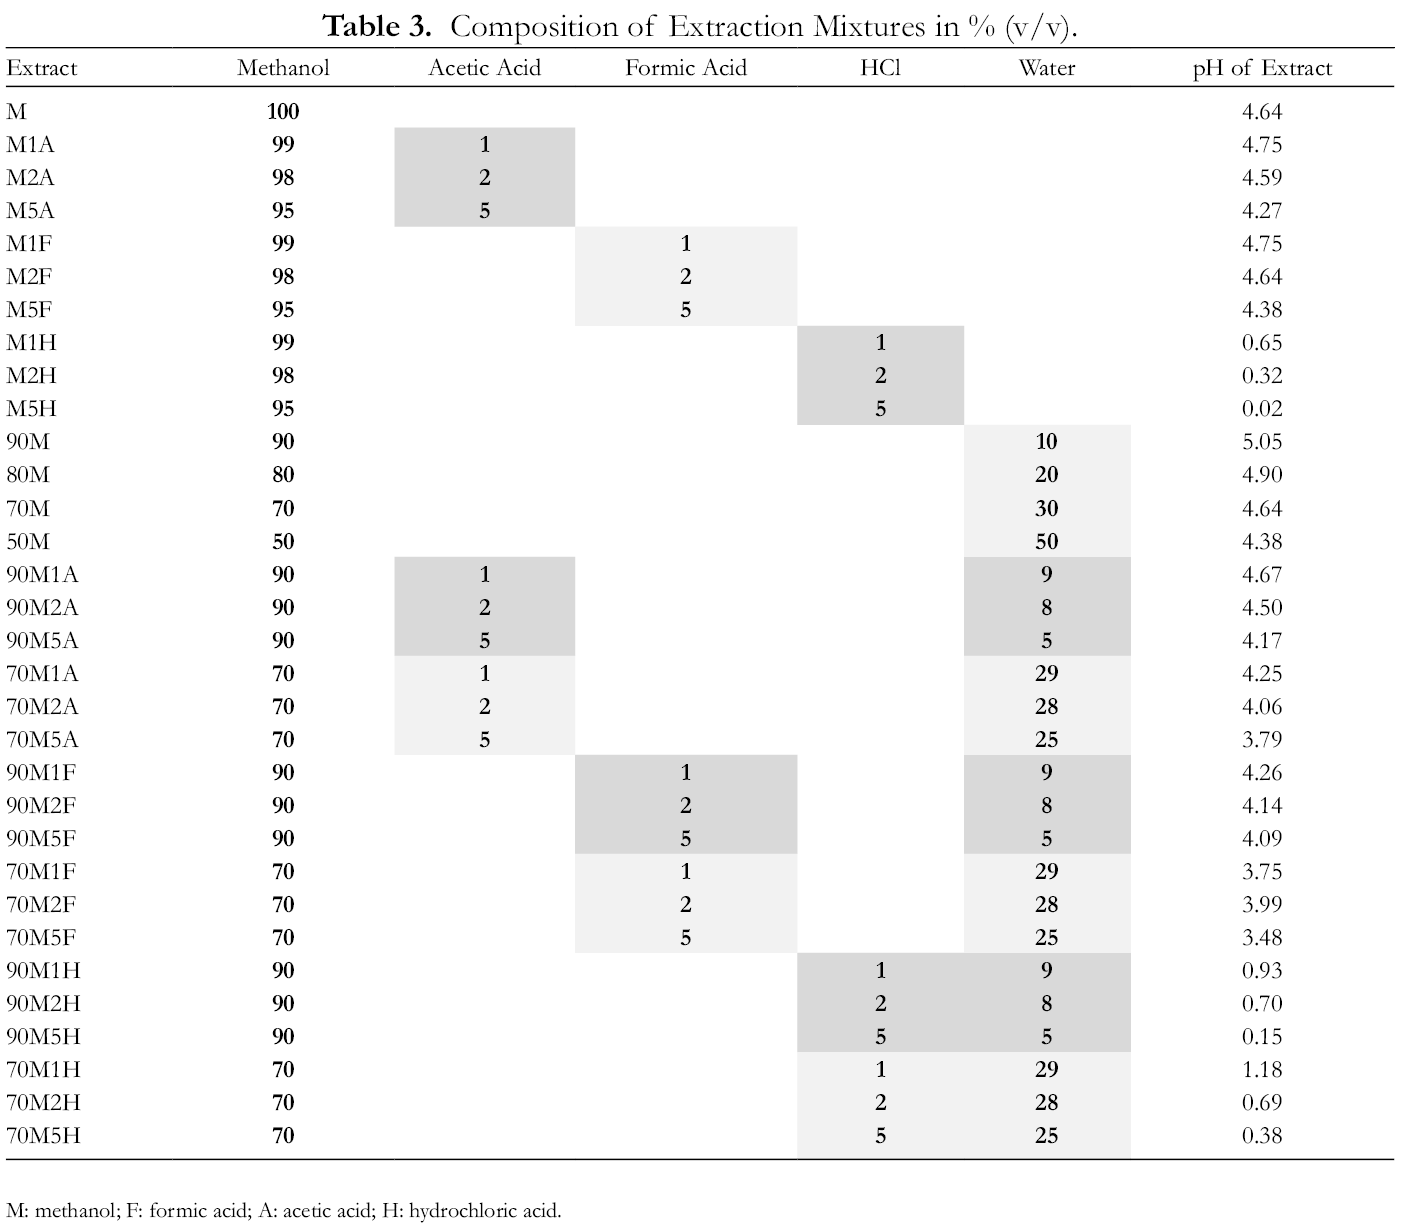
M: methanol; F: formic acid; A: acetic acid; H: hydrochloric acid.
For a better view of the obtained yield of phenolic compounds with different extraction solvents, the total content of phenolic compounds and the contribution of each group and the contribution of each compound to its group (summed individual contents determined by HPLC/DAD) in each extract are presented in Figures 4 and 5, respectively. The graphical presentation clearly indicates the differences between the various solvents used, which is also supported by a statistical analysis (Newman-Keuls test at P < .05 and also P < .01).

Total content of phenolic compounds with contributions of each group (expressed as mg/100 g fresh fruit) in the extracts (HPLC data), hydroxycinnamic acids (green), flavonols (yellow), and anthocyanins (purple).

Content of hydroxycinnamic acids (green), flavonols (yellow), and anthocyanins (purple) in extracts obtained with a solvent containing 2% acids (A: acetic acid; F: formic acid; H: HCl), expressed as mg/100 g fresh fruit (HPLC data).
Hydrochloric acid containing mixtures (M2H, 90M2H, and 70M2H) gave much higher yields of total phenolic compounds than acetic and formic acids containing ones (M2A, 90M2A, 70M2A, M2F, 90M2F, and 70M2F), which can mainly be attributed to the higher quantities of anthocyanins. It is well established that anthocyanins can be found in different chemical forms which depend on the pH of the solution. At pH 1, the flavylium cation is the predominant species and contributes to the purple and red color. 37
Water containing mixtures were more efficient for all classes of polyphenols than analogous mixtures without water. Extraction mixture 70M2F (methanol/water/formic acid, 70:28:2, v/v/v) was found as the most efficient one for flavonols, but it also gave good results for hydroxycinnamic acids. All extraction mixtures containing acetic acid have shown lower extraction efficiency compared to those with formic or hydrochloric acid.
If only the results from the quantitative analysis are taken into account, then it is evident that extraction mixtures containing hydrochloric acid were superior to the ones containing acetic or formic acid for the extraction yield of total phenolic compounds, which was especially pronounced for anthocyanins. For that reason, HCl-containing solvent mixtures are widely used and recommended for their extraction. 37,38
In our study also, the solvent mixture containing methanol/water/HCl (90:8:2, v/v/v) (90M2H) gave the best results for the qualitative and quantitative assay of anthocyanins. However, this solvent mixture caused O-methylation of 3- and 5-caffeoylquinic acids which were almost completely transformed to 3- and 5-feruloylquinic acids, respectively, during the extraction, as shown in Figures 3(b) and 6. This peculiar finding must be taken into account during sample preparation for the analysis of polyphenols. From several experiments with model compounds, it was observed that this O-methylation is specific for dihydroxycinnamic acid derivatives containing neighboring hydroxyl groups. These results suggest that more detailed studies should be carried out to elucidate the behavior of various polyphenolic compounds during extraction with solvent mixtures containing methanol/HCl, since it is very often used for assays of anthocyanins.
Materials and Methods
Reagents and Chemicals
Formic acid, acetic acid, hydrochloric acid, methanol, sodium carbonate, and water were purchased from Merck (Darmstadt, Germany). Standard of cyanidin-3-glucoside chloride was purchased from Phytolab (Vestenbergsgreuth, Germany); gallic acid and quercetin were from Sigma (Darmstadt, Germany); caffeic and chlorogenic acid were from Genay (Lyon, France). Folin-Ciocalteu reagent solution was purchased from Sigma Aldrich and sodium fluoride from Alkaloid (Skopje, Macedonia).
Plant Material and Sample Preparation
The samples were selected from mature aronia berries grown in Berovo (eastern Macedonia). The fruits were harvested in September 2018; 500 g was randomly sampled and stored at –80°C until analysis. Around 100 g of frozen material was homogenized and precisely 1 g (to 0.1 mg) weighed for each extraction (n = 3). A total of 10 mg of solid NaF was added in all extracts (to inactivate polyphenol oxidases and prevent phenolic degradation, corresponding to 2 mM) 39 and then the samples were extracted with 10 mL of extraction solvent mixture. Thirty-two different solvent mixtures containing methanol or methanol with water and acid (formic, acetic, and hydrochloric acid) were tested (Table 3).
All extracts were sonicated for 15 minutes and then centrifuged for 15 minutes at 3000 rpm at room temperature. pH values of the solvent extraction mixtures were measured (Table 3). Then, the supernatant was filtered through a 0.45-µm pore nylon membrane before analysis. Extractions and analyses were made in triplicate. All extracts were measured for total phenolic and total anthocyanin content. The extraction mixtures with 2% of acid were analyzed by HPLC/DAD/MS n .
Spectrophotometric Analysis
The Folin-Ciocalteu method was used for the determination of total polyphenols. 19 A total of 1 mL of extract was added to a 10-mL volumetric flask containing 5 mL distilled water followed by the addition of 0.5 mL Folin-Ciocalteu reagent. After 3 minutes, 1.5 mL Na2CO3 solution (5 g/L) was added to the mixture and filled with water to volume. Samples prepared in this manner were kept in a water bath at 50 °C for 16 minutes in sealed flasks and, after cooling to room temperature, their absorbance was read at 765 nm against distilled water as blank. The concentration of total polyphenols was expressed as gallic acid equivalent (GAE) per 100 g of fresh sample (mg GAE/100 g). All samples were prepared in triplicate.
Total anthocyanins were determined by dilution of the extracts with a solvent consisting of 70/30/1 (v/v/v) ethanol/water/HCl and the absorbance was measured at 540 nm. The total anthocyanins content was expressed as cyanidin-3-glucoside equivalents and calculated using the equation TA 540 nm (mg/L) =A 540 nm 16.7d, where A 540 nm is the absorbance at 540 nm and d is the dilution. 19
LC/DAD/ESI-MS n Analysis
Chromatographic separations were carried out on a 250 mm × 4.6 mm, 5 µm, Supelco C18 Discovery column (Sigma-Aldrich, Germany). The mobile phase consisted of water-formic acid (2%, v/v) (A) and methanol (B). Gradient elution method was used (0-5 minutes, 5% B; 5-20 minutes, 5%-35% B; 20-45 minutes, 35%-50% B; 45-55 minutes, 50%-70% B; 55-60 minutes, 70%-100% B, and 60-65 minutes, 15% B). The flow rate was 0.4 mL/min and the injection volume was 10 µL.
The HPLC system was equipped with an Agilent 1100 series diode array detector and ion trap mass detector in series (Agilent Technologies, Waldbronn, Germany). It consisted of G1312A binary pump, G1329A autosampler, G1379B degasser, and G1315D photodiode array detector, controlled by a ChemStation software (Agilent, v.08.03). Spectral data from all peaks were accumulated in the 190 to 600 nm range and chromatograms were recorded at 320 nm for hydroxycinnamic acids, at 350 nm for flavonols, and at 520 nm for anthocyanins.
The mass detector was a G2449A ion-trap mass spectrometer equipped with an electrospray ionization (ESI) system and controlled by LCMSD software (Agilent, v.6.1.). Nitrogen was used as the nebulizing gas at a pressure of 50 psi and the flow was adjusted to 12 L/min. The heated capillary and the voltage were maintained at 325°C and 4 kV, respectively. The parameters for capillary exit offset, skimmer 1, and skimmer 2 were 100, 40, and 6 V, respectively, and compound stability was 100%. Mass spectrometric data were acquired in the positive and negative ionization modes. The full scan covered the mass range at m/z 50 to 1200.
Liquid chromatography with diode array detection (LC/DAD) was used for separation and quantification. Peak assignment of various classes of polyphenols in the chromatograms was based on the comparison of their retention behavior and UV-Vis spectra to those of the authentic compounds and literature data. The conjugated forms of polyphenolic compounds were further characterized by ESI-MS detection in the positive ionization mode for anthocyanins and in the negative ionization mode for the other polyphenolic classes.
Quantification was performed by HPLC/DAD using 5-point regression curves (R 2 ≥ 0.999) of authentic standards. Anthocyanins were quantified with cyanidin 3-O-glucoside chloride at 520 nm, flavonols at 350 nm as quercetin equivalent, and hydroxycinnamic acids were determined at 320 nm using caffeic acid as external standard.
Statistical Analysis
Statistical treatment including calculations of means and standard deviations were performed by applying Excel (Microsoft Office, 2013). Samples were analyzed in triplicate, and one-way analysis of variance (ANOVA) was performed using STATISTICA, version 7. The Newman-Keuls post hoc test (at P < .05) was used to evaluate the significant differences between different extractions.
Footnotes
Declaration of Conflicting Interests
The author(s) declared no potential conflicts of interest with respect to the research, authorship, and/or publication of this article.
Funding
The author(s) received no financial support for the research, authorship, and/or publication of this article.