
Abstract
Diospyros lotus L. (Ebenaceae) is a deciduous plant that was traditionally used to treat various diseases such as sedation, constipation, and hypertension. However, its effects on Alzheimer’s diseases (AD) have not been reported. We investigated the potent biological effects of D. lotus on AD and performed quantitative analysis of 7 standard compounds in D. lotus leaves. First, two parts leaf and branch of D. lotus were compared to examine the effects on amyloid-β (Aβ) aggregation and oxidative stress. Ethanol extract of D. lotus leaves (EDLL) had higher activities on the Aβ disaggregation and antioxidation compared with ethanol extract of D. lotus branches (EDLB). Second, we have focused on the biological activities of EDLL for neurocellular analyses. In HT22 neuronal cells, EDLL reversed hydrogen peroxide (H2O2)-damaged cell death. In BV-2 microglia, EDLL suppressed lipopolysaccharide-stimulated productions of nitric oxide (NO) and prostaglandin E2. Third, we performed quantitative analyses of 7 standard compounds in D. lotus using high-performance liquid chromatography. Among 7 compounds, myricitrin (44.189 mg/g) was the most abundant compound in EDLL. Myricetin presented the marked inhibitory effect on Aβ aggregation, indicating its potential as a bioactive compound to control Aβ aggregation. Overall, this study suggests that EDLL may be a promising therapeutic agent for AD via Aβ disaggregation, and inhibition of neuronal cell damage and inflammation.
Alzheimer’s disease (AD) is the most common leading cause of dementia and is characterized by progressive cognitive impairments which typically occur with memory loss. The prevalence of AD is estimated to be 44 million worldwide and increases exponentially every year. 1 Although most AD patients are the elderly population aged 65 years or older, recent reports from the National Institute on Aging indicate that the number of younger-onset AD doubles every 5 years. 2 Unfortunately, curative treatments and precautionary measures against AD are currently lacking.
Amyloid-β (Aβ) deposition in the brain is a hallmark of AD pathogenesis.
3
Aβ1-42 is the most neurotoxic among Aβ isomers including Aβ1-40, Aβ1-42, and Aβ1-43, and induces neuronal cell damage in the late stage of AD.
4
The intracellular accumulation of Aβ aggregates initiates a neuroinflammatory cascade and leads to neuronal cell death.
5
There are five FDA-approved drugs for AD, including tacrine, rivastigmine, galantamine, donepezil, and memantine.
6
They are effective at delaying AD progression or mitigating disease symptoms by targeting acetylcholinesterase (AChE) or N-methyl-
Diospyros lotus L. (Ebenaceae) is native to the Middle East and South Asia. Its fruits are traditionally used as sedative, antidiabetic, antitumor, and antiseptic compounds, 10 and to treat diarrhea and hypertension. 11 The leaves of D. lotus have antioxidant, anti-inflammatory, and analgesic effects, 10 ameliorative effects against ultraviolet B (UVB)-induced skin damage, 12 and anti-obesity effects in mice. 13 The root of D. lotus has anti-inflammatory, antinociceptive, sedative, 14 and antibacterial activity. 15 However, there is no report on the effect of branches of D. lotus although several papers have provided the effects of fruits, leaves, and roots from the plants. Accumulating evidences showed the biological and pharmacological effects of branch part of many plants. 16 -18 Thus, we may also need to consider the efficacies of branches as drug candidates.
In the present study, we investigated the biological effects of D. lotus leaves and branches on AD pathogenesis-related factors such as AChE activity, Aβ aggregation, neuronal cell death, and neuroinflammation. As many studies reported that natural products, including phytochemicals and botanical extracts, are powerful drug candidates for a variety of chronic incurable diseases, our research using medicinal plants may be useful for investigation on AD.
Materials and Methods
Plant Materials
The leaves and branches of D. lotus were collected (Jeollanam-do, South Korea) and identified by Professor Joo-Hwan Kim (Gachon University, Seongnam, South Korea), and provided on April 5, 2018. Voucher specimens (SCD-A-117) were deposited at the Herbarium, Korea Institute of Oriental Medicine (Daejeon, South Korea).
Preparation of Ethanol Extracts
The dried leaves and branches of D. lotus (30 g) were extracted with 70% aqueous ethanol (300 mL) for 2 days at room temperature and this process was repeated 3 times. The extracted solutions were filtered through a filter paper (5-µm pore size) and concentrated using a rotary evaporator (EYELA N-1000, Rikakikai Co., Tokyo, Japan) under vacuum to generate powdered 70% ethanol extracts of D. lotus leaves (EDLL) and branches (EDLB) (5.28 and 2.09 g, respectively). The yield of EDLL and EDLB were 17.6% and 6.9%, respectively.
AChE Assay
In vitro AChE activity was evaluated using an AChE Assay Kit (Abcam, Cambridge, United Kingdom). Stock solutions of EDLL and EDLB were prepared by dissolving in dimethylsulfoxide at a concentration of 100 mg/mL and diluted in sodium phosphate buffer (0.1 M, pH 8.0) for assay. AChE stock solution was prepared by dissolving in 0.1% bovine serum albumin/H2O at 25 U/mL and dissolved in sodium phosphate buffer (0.1 M, pH 7.3, assay buffer) to a concentration of 35.2 mU/mL. The substrates 5,5′-dithiobis-2-nitrobenzoic acid (DTNB) and acetylthiocholine (AcSCh) were dissolved in 0.6 mL of assay buffer and distilled water, respectively, to produce 10 mM stock solution. To make 0.5 mM reaction mixture for AChE assay, 0.14 mL each of 10 mM solution was mixed in 2.52 mL assay buffer. For the enzymatic reaction, sample solution (50 µL) and reaction mixture (50 µL) were mixed in 96-well plates and preincubated for 10 minutes at room temperature. After incubation, AChE solution (10 µL) was added to each well to initiate the reaction. The reaction was performed on an Epoch microplate spectrophotometer (Bio-Tek Instruments, Winooski, VT, United States) for 1 hour at room temperature. The absorbance was read at 412 nm. Berberine (100 µM) was used as a positive control for AChE inhibition. All experiments were conducted in triplicate and independently repeated 3 times. The AChE inhibitory activities (%) of samples were calculated using the following equation 1:

where S is the sample (sample, assay buffer with DTNB, AcSCh, and enzyme); S′ is the sample (sample, assay buffer with DTNB and AcSCh, without enzyme); C is the control (sodium phosphate buffer [0.1 M, pH 8.0], assay buffer with DTNB, AcSCh, and enzyme); and C′ is the control (sodium phosphate buffer [0.1 M, pH 8.0], assay buffer with DTNB and AcSCh, without enzyme).
Aβ Aggregation Assay
The inhibitory activity on Aβ1-42 aggregation was determined using the SensoLyte Thioflavin T (ThT) β-Amyloid aggregation kit (AnaSpec, Fremont, CA, United States). The assay is based on the property of the ThT dye, whose fluorescence increases when it is bound to aggregates of Aβ1-42 peptides. Briefly, ThT was dissolved in assay buffer (50 mM Tris/150 mM NaCl [pH = 7.2], 20 mM HEPES/150 mM NaCl [pH = 7.2], and 10 mM phosphate/150 mM NaCl) at 100 µM. Samples were dissolved in assay buffer to make final concentration of 100 µg/mL for EDLL and EDLB, and 100 µM for each standard compound. For assay, 5 µL sample and 85 µL Aβ1-42 aggregates were mixed in 96-well black microplates and 10 µL ThT was added. Fluorescence of the mixture was measured for 2 hours (intervals of 20 minutes) with wavelength (λex) of 440 nm (excitation) and 485 nm (emission) on a SpectraMax i3 Multi-Mode Detection Platform (Molecular Devices, Sunnyvale, CA, United States). All fluorescence readings are presented in relative fluorescence units. Tests were conducted in triplicate and independently repeated 3 times. The % inhibition of Aβ aggregation was calculated by the following equation 2:

Morin (100 µM) was used as a positive control for inhibiting Aβ aggregation.
The 50% inhibitory concentration (IC50) was calculated from the dose response curve (Graph Pad Prism Version 7.0) obtained by plotting percentage inhibition vs concentrations.
Free Radical Scavenging Assay
2,2′-Azino-bis(3-ethylbenzothiazoline-6-sulfonic acid) (ABTS) assay
ABTS radical cations were generated by reacting 7 mM ABTS solution with 2.45 mM potassium persulfate for 16 hours at room temperature in the dark. Absorbance of the reactant was later adjusted to 0.7 at a wavelength of 734 nm. A 100 μL EDLL or EDLB solution (6.25-100 µg/mL) and 100 μL ABTS·+ solution were mixed. The mixture was incubated for 5 minutes at room temperature in the dark. The absorbance of the resulting solution was read on spectrophotometer (Benchmark Plus, Bio-Rad, Hercules, CA, United States) at 734 nm. All experiments were conducted in triplicate and independently repeated 3 times. The radical scavenging potential of the samples was presented by the following equation 3:

The IC50 was calculated from the dose response curve (Graph Pad Prism Version 7.0) obtained by plotting percentage inhibition vs concentrations.
2,2-Diphenyl-1-picrylhydrazyl (DPPH) assay
A 100 μL aliquot of EDLL or EDLB solution (6.25-100 µg/mL) and 100 μL DPPH solution (0.15 mM in methanol) were mixed to make reaction mixture. Then, this mixture was incubated for 30 minutes at room temperature in the dark. The absorbance of the resulting solution was read on spectrophotometer (Benchmark Plus, Bio-Rad, Hercules, CA, United States) at 517 nm. All experiments were conducted in triplicate and independently repeated 3 times. The radical scavenging potential of the samples was calculated by Equation 3. Ascorbic acid was used as a positive control for radical scavenging. The IC50 was calculated from the dose response curve (Graph Pad Prism Version 7.0) obtained by plotting percentage inhibition vs concentrations.
Cell Lines and Culture
BV-2 and HT22 cells were maintained in Dulbecco’s Modified Eagle’s medium (Hyclone/Thermo, Rockford, IL, United States), supplemented with 10% fetal bovine serum (Hyclone/Thermo, Rockford, IL, United States) and penicillin/streptomycin in 5% CO2 at 37°C. HT22 cells were cotreated with EDLL and hydrogen peroxide (H2O2; 250 µM, Sigma-Aldrich, St. Louis, MO, United States) for 6 hours. BV-2 cells were pretreated with EDLL for 2 hours and treated with 1 µg/mL lipopolysaccharide (LPS; Sigma-Aldrich, St. Louis, MO, United States) for additional 22 hours. Carvedilol and ibuprofen were used as positive controls for neuroprotection 19 and neuroinflammatory inhibition, 20 respectively.
Cell Viability Test
The cytotoxic effects of EDLL against HT22 or BV-2 cells were assessed using Cell Counting Kit-8 (CCK-8; Dojindo, Kumamoto, Japan) assay. BV-2 and HT22 cells were plated on 96-well microplates at a density of 3 × 10⁴/well and 5 × 10³/well, respectively. Cells were treated with 0, 12.5, 25, 50, or 100 µg/mL EDLL for 24 hours and CCK-8 solution was added. Then, the cells were incubated for 4 hours. The absorbance of each well at 450 nm was read using an Epoch Microplate Spectrophotometer (BioTek Instruments, Inc., Winooski, VT, United States). All experiments were conducted in triplicate and independently repeated 3 times. Cell viability (%) was presented by the following equation 4:

Lactose Dehydrogenase (LDH) Assay
To determine the cytotoxic effects of EDLL, the release of LDH from H2O2-damaged HT22 cells was assayed using CytoTox 96 Nonradioactive Cytotoxicity Assay kit (Promega, Madison, WI, United States). Cells were lysed to induce maximal LDH release. Supernatants were collected to assess experimental LDH release. Cell lysates or supernatants were reacted with substrate mixture for 30 minutes at room temperature in the dark. Then, stop solution was added and the absorbance was measured at 490 nm on an Epoch Microplate Spectrophotometer (BioTek Instruments, Inc., Winooski, VT, United States). All experiments were conducted in triplicate and independently repeated 3 times. The cytotoxicity (%) was presented by the following equation 5:

Nitric Oxide (NO) Assay
BV-2 cells were pretreated with various concentrations of EDLL for 2 hours and stimulated with 1 µg/mL LPS for 22 hours. NO synthesis was analyzed by determining the accumulation of nitrite (NO2 −) in culture supernatant using the Griess Reagent System (Promega, Madison, WI, United States). Equal volumes of supernatant and sulfanilamide solutions were mixed and incubated at room temperature for 10 minutes, and then naphthylethylenediamine dihydrochloride solution were added for an additional 5 minutes. The absorbance was read at 540 nm on Epoch Microplate Spectophotometer (BioTek Instruments, Inc., Winooski, VT, United States). Nitrite concentration was determined from a standard curve generated with sodium nitrite (NaNO2). All experiments were conducted in triplicate and independently repeated 3 times.
Measurement of Prostaglandin E2 (PGE2) Production
BV-2 cells were treated with various concentrations of EDLL for 2 hours and stimulated with LPS for 22 hours. ELISA kit from R&D Systems (Minneapolis, MN, United States) was used for the measurement of PGE2. Briefly, the supernatant of the cell culture was collected and applied to each well of the ELISA plates with the designated antibodies. Optical density was measured at 450 nm, and the concentration of PGE2 was calculated by creating a standard curve. All experiments were conducted in triplicate and independently repeated 3 times.
Chemicals and Reagents for High-Performance Liquid Chromatography Analysis (HPLC)
Seven standard compounds gallic acid, myricitrin, ellagic acid, isoquercitrin, quercitrin, myricetin, and quercetin were purchased from ChemFaces Biochemical Co., Ltd. (Wuhan, China). The purities of standard compounds were ≥98.0% as evaluated using HPLC analysis. The analytical-grade solvents (water and acetonitrile) were purchased from J.T. Baker Chemical Co. (Phillipsburg, NJ, United States), and the formic acid (FA) was purchased from Sigma-Aldrich (St. Louis, MO, United States).
Preparation of Sample and Standard Solutions for HPLC Analysis
Ethanol extract of D. lotus leaves was dissolved in methanol at 10 mg/mL and filtered through a syringe filter (0.45 µm) for quantitative analysis. Seven standard compounds were dissolved in methanol to make stock solutions (1.0 mg/mL). These solutions were diluted with methanol to obtain various concentrations of standard solutions for quantitative analysis.
Apparatus and Chromatographic Conditions
To identify and quantify 7 compounds in D. lotus, a Waters Alliance e2695 system (Waters Corp, Milford, MA, United States) equipped with photodiode array (PDA) detector (#2998; Waters Corp) was used. The acquired data were processed using Empower software (version 3; Waters Corp). Seven compounds were separated and analyzed by Gemini C18 analytical column (250 × 4.6 mm, 5 µm; Phenomenex, Torrance, CA, United States) with 2 mobile phases consisting of 0.5% (v/v) aqueous FA (A) and acetonitrile (B) using a gradient elution of 5% to 8% B for 0 to 10 minutes, 8% to 50% B for 10 to 50 minutes, and 100% B for 50 to 60 minutes. The column temperature was maintained at 40°C. The PDA detection was performed at 210 to 400 nm for scanning chromatograms. The flow rate of the mobile phase was 1 mL/min, and the injection volume of samples was 10 µL.
Calibration Curve, Limits of Detection (LOD), and Limits of Quantification(LOQ)
The calibration curves for 7 standard compounds were determined from the peak areas of the standard solutions at various concentrations: gallic acid (6.25~ 200 μg/mL), myricitrin (15.625~ 500 μg/mL), ellagic acid (0.78125~ 25 μg/mL), isoquercitrin (1.5625~ 50 μg/mL), quercitrin (3.125~ 100 μg/mL), myricetin (1.5625~ 50 μg/mL), and quercetin (0.78125~ 25 μg/mL). These solutions were measured in triplicate to make calibration curves. The LOD and LOQ for 7 standard compounds were determined using the standard deviation (SD) of the response and slope of the calibration curve, by the following equation 6, 7:


Statistical Analysis
Data are expressed as the mean ± standard error of measurement. One-way analysis of variance followed by a Tukey’s multiple comparison test or an unpaired Student’s t-test was performed to detect significance differences between control and tester groups using GraphPad Prism 7.0 (GraphPad Software, San Diego, CA, United States). Differences with P < .05 were considered statistically significant.
Results
Effects of EDLL and EDLB on In Vitro AChE Activation and Aβ Aggregation
AChE activation and Aβ aggregation are critical hallmarks in AD pathogenesis. 21,22 We explored whether EDLL and EDLB would influence AChE activity or Aβ aggregation. Both EDLL and EDLB markedly inhibited Aβ aggregation at 100 µg/mL, whereas they had no effect on AChE activity (Table 1). Effects of EDLL and EDLB on Aβ aggregation were further confirmed at various concentrations (6.25, 12.5, 25, 50, or 100 µg/mL). Both EDLL and EDLB exerted inhibitory effects on Aβ aggregation in a dose-dependent manner Figure 1(a) and (b). The IC50 of EDLL and EDLB was 45.02 and 75.39 µg/mL, respectively. Amyloid-β inhibition by morin reached about 70%.
Inhibitory Activity of Ethanol Extract of Diospyros lotus Leaves and Branches on In Vitro Acetylcholinesterase Activity and Amyloid-β Aggregation (at 100 µg/mL).

Aβ, amyloid-β; AChE, acetylcholinesterase; EDLB, ethanol extract of Diospyros lotus branches; EDLL, ethanol extract of Diospyros lotus leaves.
The results are presented as the mean ± standard error of measurement of 3 independent experiments. *P < .05 or **P < .01 vs control.
aPositive control for AChE inhibition.
bPositive control for inhibiting Aβ aggregation.

Effects of ethanol extract of Diospyros lotus leaves and branches on amyloid-β disaggregation. (a,b) Amyloid-β aggregation assay was performed using the SensoLyte Thioflavin T β-Amyloid aggregation kit (AnaSpec, Fremont, CA, United States). Various concentrations (6.25, 12.5, 25, 50, or 100 µg/mL) of ethanol extract of Diospyros lotus leaves (a) or ethanol extract of Diospyros lotus branches (b) were prepared and reacted with Aβ1-42 peptides, followed by the addition of Thioflavin T. Fluorescence of Thioflavin T was measured at an excitation wavelength of 440 nm and emission wavelength of 485 nm. Each value is expressed as the mean ± standard error of measurement (n = 3). All experiments were conducted in triplicate and independently repeated 3 times. The results are presented as the mean ± standard error of measurement of 3 independent experiments. *P < .05 or **P < .01 vs control.
Effects of EDLL and EDLB on Antioxidant Activation
Aβ induces oxidative stress in the brain. 23 To examine the effects of 2 extracts against oxidative stress, free radical scavenging assays for ABTS and DPPH were performed. Both EDLL and EDLB at 6.25 µg/mL did not result in any activity and dramatically increased at 12.5 µg/mL for ABTS scavenging. EDLL and EDLB reached 100% of ABTS radical scavenging activity at 25 and 50 µg/mL, respectively; this effect was sustained up to 100 µg/mL Figure 2(a) and (b). The IC50 of EDLL and EDLB for ABTS scavenging was 11.20 and 12.45 µg/mL, respectively. In DPPH assay, EDLL showed a similar pattern to ABTS assay. Compared to EDLL, EDLB produced mild effects on DPPH radical scavenging Figure 2(c) and (d). The IC50 of EDLL and EDLB on DPPH scavenging was 11.28 and >100 µg/mL, respectively.
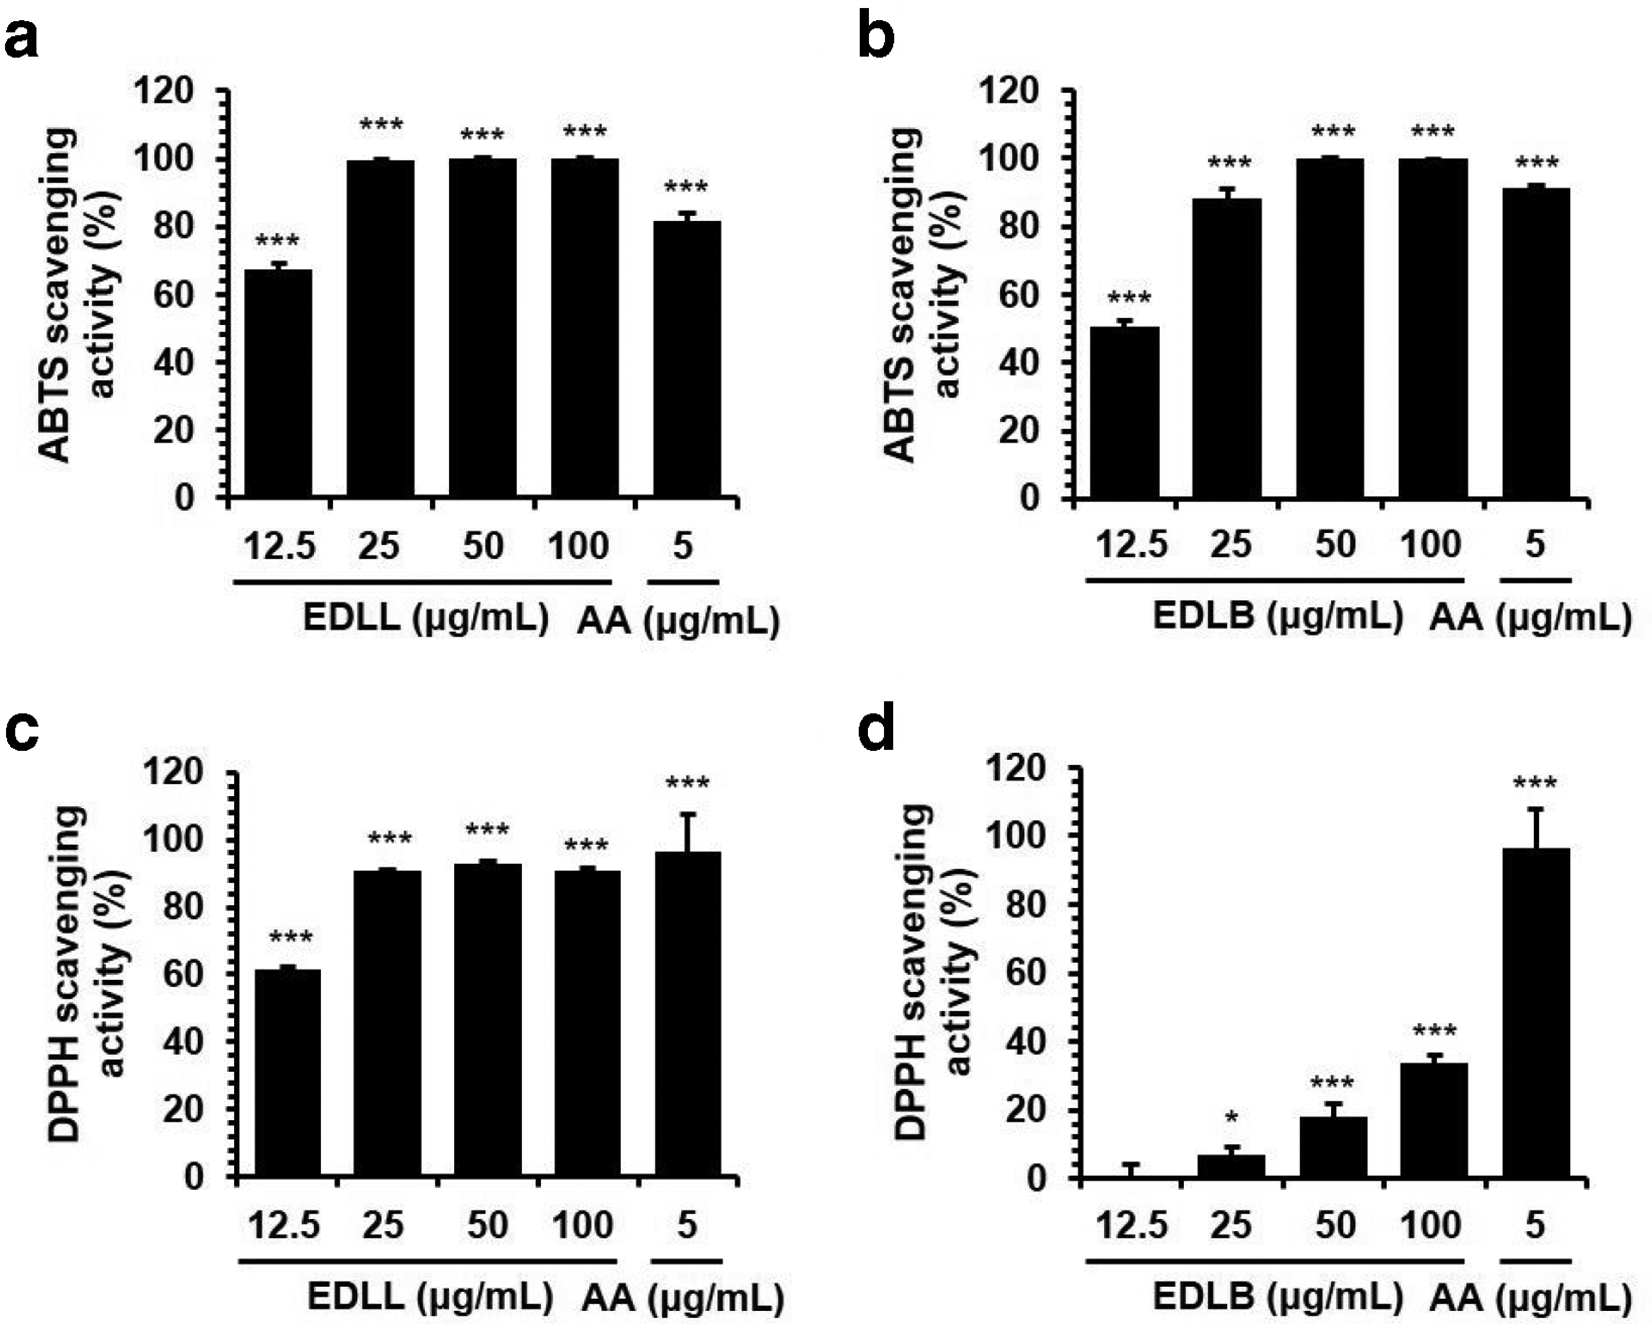
Antioxidant effects of ethanol extract of Diospyros lotus leaves and branches. Antioxidant activity was measured by a free radical scavenging assay for 2,2′-azino-bis(3-ethylbenzothiazoline-6-sulfonic acid) (a, b) and 2,2-diphenyl-1-picrylhydrazyl (c, d). Percent activity is equal to percent inhibition of 2,2′-azino-bis(3-ethylbenzothiazoline-6-sulfonic acid) and 2,2-diphenyl-1-picrylhydrazyl. Each value is expressed as the mean ± standard error of measurement (n = 3). All experiments were conducted in triplicate and independently repeated 3 times. The results are presented as the mean ± standard error of measurement of 3 independent experiments. *P < .05 or ***P < .001 vs control.
By comparing the assay results of Aβ aggregation and anti-oxidation, we observed better effects of EDLL than those of EDLB. Additional experiments were performed to confirm the effects of EDLL using HT22 hippocampal cells and BV-2 microglia.
Effects of EDLL on Neuronal Cell Damage in H2O2-Treated HT22 Cells
To determine the cytotoxicity of EDLL, a cell viability assay was performed. HT22 cells were treated with 0, 12.5, 25, 50, or 100 µg/mL EDLL for 24 hours. As shown in Figure 3A, EDLL did not have any significant effects on cell viability. To induce neuronal cell damage, HT22 cells were exposed to H2O2 for 6 hours. Concentration and time of H2O2 were determined by a dose- and time-dependent study before the assay. Damaged neuronal cells were cotreated with various concentrations of EDLL (0, 25, 50, or 100 µg/mL). Cell viability was significantly reduced by treatment with H2O2 alone. In contrast, EDLL treatment significantly blocked H2O2-induced cell death of HT22. The protective effects of neuronal cell damage were maximally reached at 50 µg/mL (Figure 3B). Consistent with the cell viability assay results, LDH release in damaged HT22 cells was significantly inhibited by EDLL treatment (Figure 3C).

Neuroprotective effects of ethanol extract of Diospyros lotus leaves in HT22 hippocampal cells. (a) Cells were seeded in 96-well plates and treated with 0, 12.5, 25, 50, or 100 µg/mL ethanol extract of Diospyros lotus leaves for 24 hours. Cell viability was evaluated using the Cell Counting Kit-8 assay. (b, c) Cells were exposed to H2O2 in the absence or presence of ethanol extract of Diospyros lotus leaves for 6 hours. (b) Cell viability was determined using a Cell Counting assay kit. (c) Neuroprotection was examined using the lactate dehydrogenase release assay. As an indicator of cell disruption, lactate dehydrogenase release from cells was measured in supernatants and cell lysates. The results are presented as the mean ± standard error of measurement of 3 independent experiments. ### P < .001 vs vehicle control cells; *P < .05, **P < .01, or ***P < .001 vs H2O2-treated cells.
Effects of EDLL on Neuronal Inflammation in LPS-Treated BV-2 Cells
BV-2 microglia were used to investigate whether EDLL would affect neuronal inflammation. Microglia are key mediators in neuroinflammatory processes. 24 The cytotoxicity of EDLL against BV-2 cells was determined using the cell viability assay. BV-2 cells were treated with various concentrations (0, 12.5, 25, 50, or 100 µg/mL) of EDLL for 24 hours. Ethanol extract of D. lotus leaves did not have any significant effect on cell viability up to 100 µg/mL Figure 4(a).
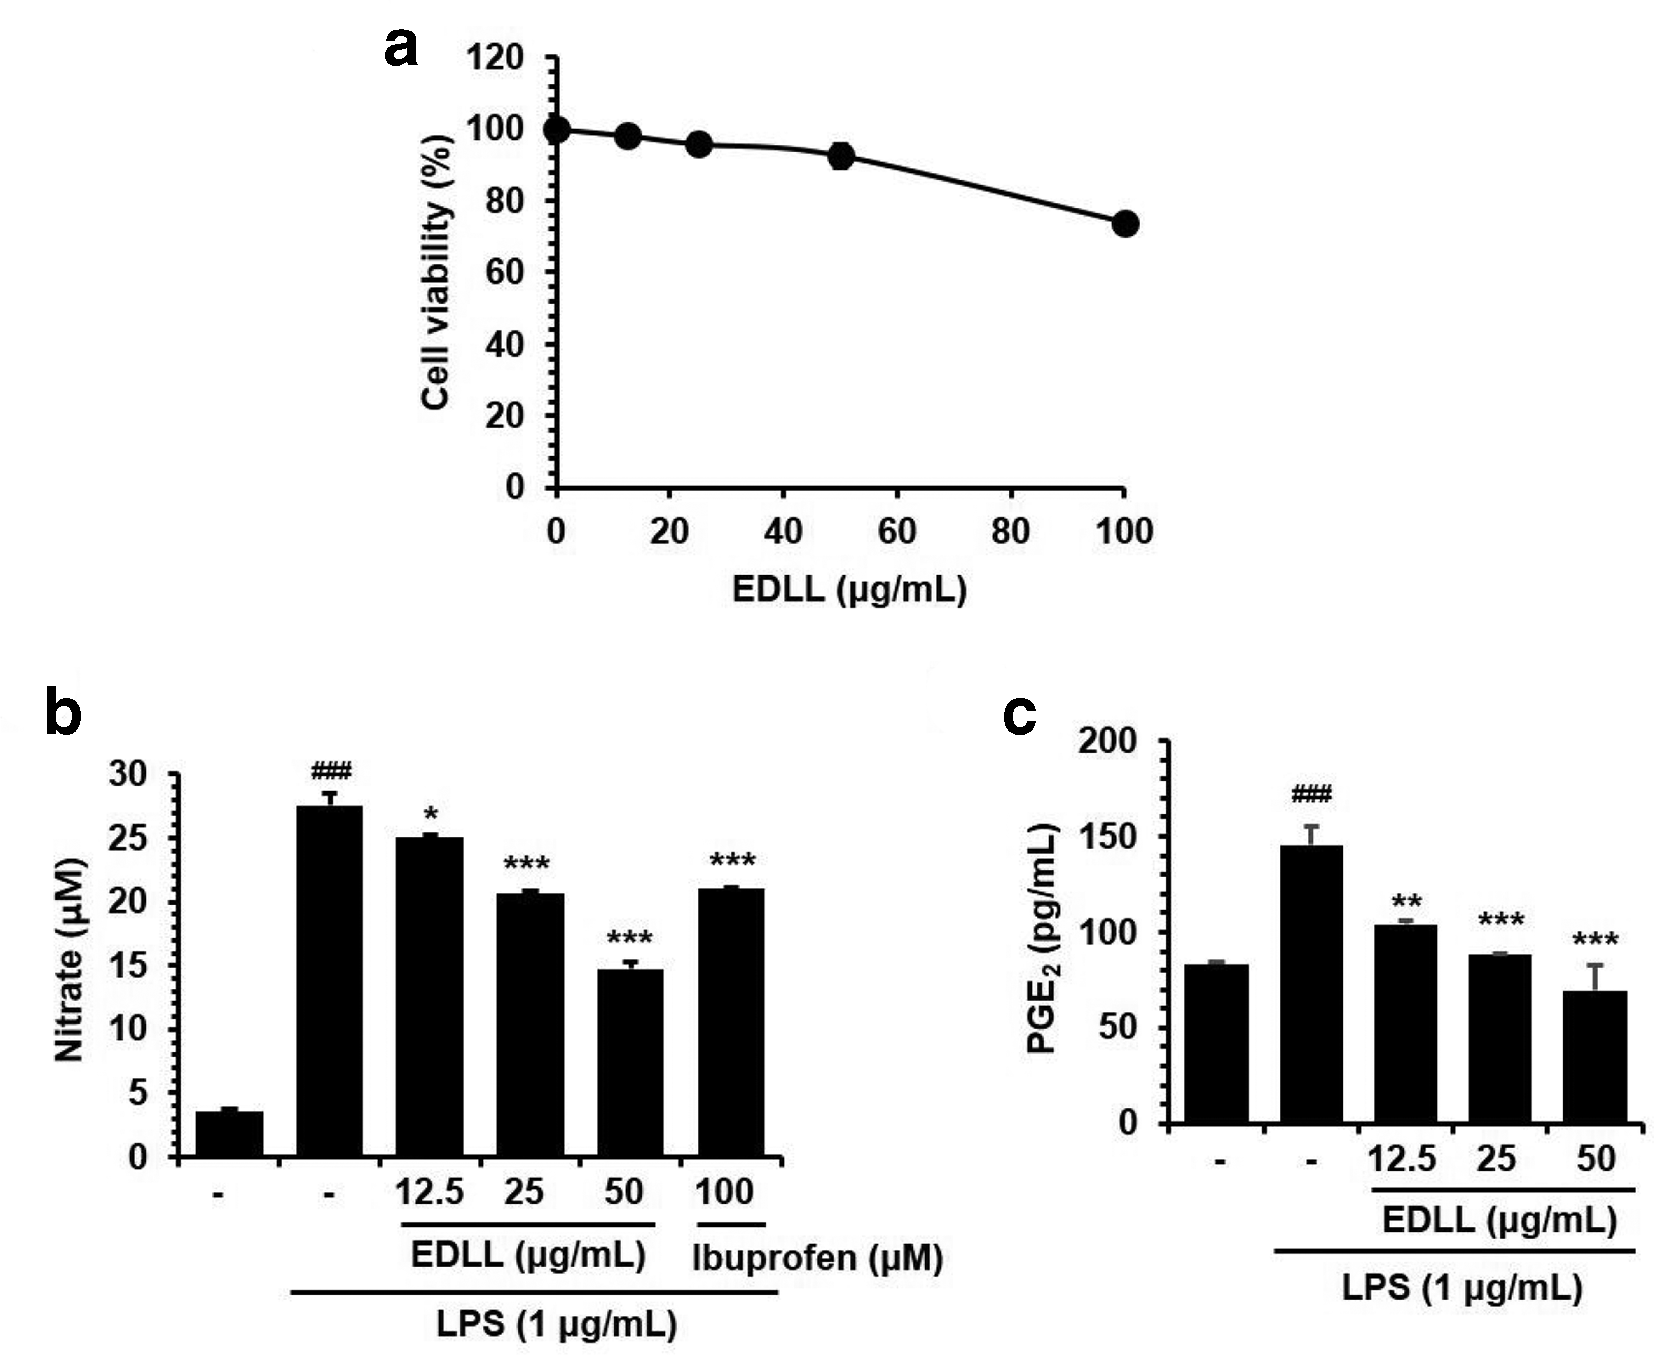
Antineuroinflammatory effects of ethanol extract of Diospyros lotus leaves in lipopolysaccharide-stimulated BV-2 cells. (a) Cells were seeded in 96-well plates and treated with 0, 12.5, 25, 50, or 100 µg/mL of ethanol extract of Diospyros lotus leaves for 24 hours. (b, c) Cells were pretreated with various concentrations (0, 12.5, 25, or 50 µg/mL) of ethanol extract of Diospyros lotus leaves for 2 hours and then stimulated with lipopolysaccharide (1 µg/mL) for an additional 22 hours. (b) The production of NO was determined using Griess reagents. (c) The production of prostaglandin E2 was measured in the culture medium and assessed using ELISA. The results are presented as the mean ± standard error of measurement of 3 independent experiments. ### P < .001 vs vehicle control cells; *P < .05, **P < .01, or ***P < .001 vs lipopolysaccharide-treated cells.
BV-2 cells were treated with LPS to stimulate inflammatory responses in the absence or presence of EDLL (0, 12.5, 25, 50, or 100 µg/mL). As shown in Figure 4(b), LPS treatment significantly enhanced the production of inflammatory mediators NO and PGE2. In contrast, concurrent treatment with LPS and EDLL significantly prevented LPS-mediated generation of NO and PGE2 in a dose-dependent manner.
HPLC Analysis of 7 Standard Compounds in EDLL
For the simultaneous analysis of 7 standard compounds of EDLL, established HPLC method was applied. Seven compounds were successfully separated using 2 mobile phases consisting of 0.5% (v/v) aqueous FA and acetonitrile within 40 minutes and detected at 260 nm of UV wavelength. The retention times of gallic acid, myricitrin, ellagic acid, isoquercitrin, quercitrin, myricetin, and quercetin were 7.28, 28.17, 28.55, 28.81, 31.19, 33.93, and 38.5 minutes, respectively. HPLC chromatograms for the EDLL and standard mixture are presented in Figure 5(a) and (b). Chemical structures of standard compounds are presented in Figure 5(c).

High-performance liquid chromatography chromatograms of the ethanol extract of Diospyros lotus leaves (a) and standard mixture (b) at 260 nm. (c) Chemical structures of 7 standard compounds in Diospyros lotus.
Regression Equation, Linearity, LOD, and LOQ
The calibration curves for 7 compounds were calculated by the linear relationships between the peak area (y) and concentration (x, μg/mL) of each standard compound and presented as regression equations (y = ax + b) in Table 2. All calibration curves for 7 compounds showed acceptable linearity (r 2 ≥ 0.9999). The LOD for 7 standard compounds ranged from 0.014 to 0.87 μg/mL and LOQ ranged from 0.042 to 2.635 μg/mL.
Regression Equation, Linearity, Limits of Detection, Limits of Quantification, and Content of 7 Compounds.

LOD, limits of detection; LOQ, limits of quantification.
a y = ax + b, y means peak area and x means concentration (μg /mL).
bLOD: 3.3 × (SD of the response/slope of the calibration curve)
cLOQ: 10 × (SD of the response/slope of the calibration curve)
Quantitative Analysis of 7 Standard Compounds in EDLL
The determined analytical method was applied for the quantitative analysis of gallic acid, myricitrin, ellagic acid, isoquercitrin, quercitrin, myricetin, and quercetin in D. lotus extract. The amounts of these compounds ranged from 0.358 to 44.189 mg/g. The results are presented in Table 2. Among these 7 compounds, myricitrin (44.189 mg/g) was the most abundant compound.
Effects of Standard Compounds of EDLL on In Vitro Aβ Aggregation
To identify bioactive compounds of EDLL to control neurobiological responses, an in vitro Aβ aggregation assay was performed. Myricetin produced a dramatic inhibitory effect on Aβ aggregation (93.1%). The inhibitory rates of other compounds gallic acid, myricitrin, ellagic acid, isoquercitrin, quercitrin, and quercetin were less than 55% (Figure 6).

Effects of standard compounds of ethanol extract of Diospyros lotus leaves on amyloid-β disaggregation. Amyloid-β aggregation assay was performed using the SensoLyte Thioflavin T β-Amyloid aggregation kit (AnaSpec, Fremont, CA, United States). Ethanol extract of Diospyros lotus leaves (100 µg/mL) and 7 standard compounds (gallic acid, myricitrin, ellagic acid, isoquercitrin, quercitrin, myricetin, and quercetin) were prepared at final concentration of 100 µM and reacted with Aβ1-42 peptides, followed by the addition of Thioflavin T. Fluorescence of Thioflavin T was measured at an excitation wavelength of 440 nm and emission wavelength of 485 nm. Each value is showed as the mean ± standard error of measurement (n = 3). All experiments were conducted in triplicate and independently repeated 3 times. The results are presented as the mean ± standard error of measurement of 3 independent experiments. *P < .05 or ***P < .001 vs control.
Discussion
We here report the potential role of EDLL in AD. EDLL dramatically inhibited Aβ aggregation and prevented neuronal cell death and neuroinflammation. AD is a multifactorial disease, and its pathogenesis is regulated by multiple mechanisms. 25 Aβ is a key protein crucially involved in AD. Aβ is observed in the healthy brain in soluble form, whereas in AD patient brains, it is observed in aggregated form. 26 Many scientists propose that Aβ accumulation is a primary cause of AD 27,28 and have explored drugs that target Aβ. That is, the focus was mainly on reducing the formation or accumulation of Aβ for the development of AD therapeutic agents. 29 So far, active or passive anti-Aβ immunotherapies have been tested in clinical trials as Aβ antigens, its aggregation inhibitors, monoclonal antibodies against Aβ, and BACE inhibitors. 30 -32 However, most efforts to develop Aβ-targeted drugs that affect the formation, aggregation, and clearance of Aβ have unfortunately failed in clinical trials. 33,34 Although there is controversy that Aβ may not be the best therapeutic target for AD, 35,36 the preclinical and clinical studies of anti-Aβ therapies for AD are still ongoing. 34
Our investigation used 2 ethanol extracts from D. lotus leaves and branches to examine their effects on Aβ aggregation. Both extracts EDLL and EDLB produced inhibitory effects on Aβ aggregation in a dose-dependent manner. The IC50 values of EDLL and EDLB on Aβ aggregation were 45.02 and 75.39 µg/mL, respectively, indicating that EDLL more effectively inhibited Aβ aggregation. Recently, we and others reported the efficacies of various extracts of natural products such as Camellia sinensis, Annona atemoya, and herbal formula Jowiseungchungtang to inhibit Aβ aggregation in vitro and in vivo. 37 -39 Given the complex pathology of AD, natural products with the properties of multitargets and multicomponents can be considered attractive materials for AD therapeutics by cotargeting Aβ and other AD biomarkers.
Oxidative stress plays a crucial role in AD pathogenesis that is closely related to the presence of Aβ. 40 Elevation of Aβ levels leads to generation of oxidative products in the brains of AD patients. 41 In the present study, we performed ABTS and DPPH radical scavenging assays which are most widely used for natural products. 42,43 The ABTS and DPPH assays are based on the generation of an ABTS·+ reduced by antioxidants and the reduction of DPPH· to 1,1-diphenyl-2-picryl hydrazine, respectively. 44 As expected, both EDLL and EDLB showed marked ABTS radical scavenging activity. Conversely, EDLL revealed strong scavenging activity against DPPH radicals, whereas EDLB had relatively lower activity. It is not surprising that D. lotus extracts have antioxidant activity. Antioxidant activities of natural products have been reported by various researchers. 45 -47 These reports suggest the validity of natural products for chronic diseases associated with oxidative stress. Of importance, oxidative stress plays a key role in neuronal cell death and inflammation in the pathogenesis of AD. 48 We observed that EDLL had significant inhibitory effects on neuronal cell death and neuroinflammation. The viability of HT22 hippocampal cells damaged by H2O2 was reversed by concurrent treatment with EDLL. In addition, EDLL significantly suppressed LPS-stimulated inflammatory responses in BV-2 microglia by reducing NO and PGE2 production. As mentioned above, the complexity of AD pathogenesis makes the constraint of single molecular target therapy for AD. The control of a multicellular response to brain injury is considered as one of promising approaches to develop anti-AD drugs. Especially, the importance of neuroinflammation has been suggested as a key event to be considered in the AD treatment. 49,50 With the inflammatory mediators NO and PGE2, additional inflammation-related factors such as cytokines and signaling molecules should be examined to verify anti-AD effects of EDLL in the next step of our studies.
Previous phytochemical studies of D. lotus revealed the presence of flavonoids (eg, myricitrin, myricetin, quercetin, and kaempferol), 10,51 hydrolyable tannins (eg, gallic acid and ellagic acid), 10 triterpenoids (eg, lupeol and betulinic acid) and phytosterols (eg, stigmasterol and β-sitosterol), 14 bis-naphtoquinone (eg, diospyrin, 8-hydroxy diospyrin, and di-naphthodiospyrol D and E), 52 and phenolic compounds (eg, protocatechuic, caffeic, and ferulic acids). 53 In the current study, quantitative analysis of 7 standard compounds gallic acid, myricitrin, ellagic acid, isoquercitrin, quercitrin, myricetin, and quercetin in the leaves of D. lotus was conducted using the established HPLC-PDA method. Consequently, the most abundant compound in the EDLL was myricitrin (44.189 ± 0.193 mg/g). Studies on the quantitative analysis of the components in the D. lotus leaves have not been reported before. However, phenolic compounds gallic acid, protocatechuic acid, caffeic acid, p-coumaric aicd, ferulic acid, rutin, myricetin, quercetin, kaempferol, and galangin in water, methanol, and acetone extracts from the D. lotus fruits were quantified by HPLC. 53 In their results, gallic acid (0.287 mg/g) was the most abundant compound in water extract. Furthermore, bioactive compounds in EDLL were determined by assessing their inhibitory effects on Aβ aggregation. Myricetin dramatically inhibited Aβ aggregation when compared with the other 6 standard compounds, indicating the potential of myricetin as a bioactive compound. Previous studies have reported that phenolic compounds, including flavonoids, prevent Aβ oligomerization by conformational change of Aβ. 54 -56 They found that the polyphenolic flavonoids suppress β-sheet formation toward Aβ. The phenolic hydroxyl groups may interact with Aβ and make hydrogen bonds with Aβ17-42 peptide backbone, which contribute to the disruption of the Aβ structure. 54 Since myricetin has the most abundant phenolic hydroxyl groups (6 hydroxyl groups), it is more effective for the formation of hydrogen bonds than the other 6 standard compounds.
In conclusion, EDLL inhibited Aβ aggregation, enhanced antioxidant activity, and exerted neuroprotective and antineuroinflammatory effects. Myricitrin was the most abundant compound among 7 standard compounds in EDLL and myricetin was proved to be the most potent bioactive phytochemical. Overall, our data demonstrate that EDLL may be a valuable candidate drug against AD.
Footnotes
Acknowledgments
We thank the Diabetic Complications Research Team, Herbal Medicine Research Division, Korea Institute of Oriental Medicine (Dr Jin Sook Kim) and the Korean Seed Association for kind donation of plant material.
Declaration of Conflicting Interests
The author(s) declared no potential conflicts of interest with respect to the research, authorship, and/or publication of this article.
Funding
The author(s) disclosed receipt of the following financial support for the research, authorship, and/or publication of this article: This study was supported by the Korea Institute of Oriental Medicine under Grants KSN1515293 and KSN2013240.