
Abstract
Astragalus membranaceus (Fish.) Bunge is a perennial herb distributed in the northern part of China, and its roots, namely, Hang qi, are included as a natural ingredient in dietary supplement formulations commonly used to treat different disorders such as respiratory infections, diabetes, and heart failure. The availability of a simple method for the determination of the quality of Astragalus herbal preparations could be a challenging issue for commercial purposes. In this study, a liquid chromatography–mass spectrometry (LC–MS)/MS based approach was used to characterize specialized metabolite recovery of 3 commercial hydroalcoholic extracts of A. membranaceus (AMG1, AMG2, AMG3) in addition to a hydroalcoholic extract of A. membranaceus root (AST). The hypoglycemic effect, cholinesterase inhibition, and antioxidant activities were also evaluated. Thirty-one compounds, of which 19 polyphenols and 12 saponins, were identified. The extracts were also quantified by using a sensitive and selective Q-Trap system for their content in flavonoids and astragalosides, selecting astragaloside I and IV as chemical markers. From our results, AMG3 preparation (Axtragyl) was the most abundant in terms of both specialized classes of metabolites, showing a fingerprint similar to that of AST. Interestingly, tested enzyme inhibition ability of flavonoids, daidzein (
Astragalus L. (Fabaceae family) includes more than 2500 different species and represents one of the most important genus of the flowering plants. 1,2 Many Astragalus species are largely used as herbal preparations in Asia and provide an important economic source in many regions of this continent. In the traditional Chinese medicine (TCM), the dried roots of several species are considered remedies for the treatment of many diseases such as diabetes mellitus, hypertension, cirrhosis, nephritis, and inflammations. 3 Different pharmacological properties are reported for Astragalus root extracts, particularly hepatoprotective, immunostimulant, antioxidant, neuroprotective, anti-inflammatory, and antiviral activities. 4 Astragalus membranaceus (Fish.) Bunge is a perennial herb distributed in the northern part of China, and its roots, namely, Hang qi, are a natural dietary supplement ingredient commonly used for immunomodulation 5 and to treat a wide variety of diseases and body disorders such as respiratory infections, diabetes, and heart failure. Recent studies highlighted the potential application for peripheral neuroprotection and pain relief. 6 -9 The major components of Hang qi extracts are polysaccharides, flavonoids, and saponins, named astragalosides. 10
The availability of a simple method for the determination of the quality of Astragalus herbal preparations could be a challenging issue for commercial purposes. Several methods for the analysis of highly complex compound mixtures of A. membranaceus roots are currently used. The aim of this work was to study the phytochemical profile by a liquid chromatography–mass spectrometry (LC–MS) method of three commercial hydroalcoholic root extracts of A. membranaceus (AMG1, AMG2, AMG3) in addition to a hydroalcoholic extract of A. membranaceus root (AST). In particular, the goal was to analyze the main secondary metabolites, polyphenols and saponins, of the different commercial samples of hydroalcoholic A. membranaceus root extracts in order to identify the ones with the most abundant bioactive compounds quantity. Moreover, the antioxidant, anticholinesterase, and inhibition of α-glucosidase and α-amylase activity of these herbal preparations were also assessed using in vitro cell-free assays, together with the in silico interaction of the most active compounds. Finally, the possible protective role played by samples on the injurious effect of reactive oxygen metabolites (ROM) against the intestinal epithelium, using Caco-2 human cell line, was investigated. 11
Results and Discussion
Qualitative and Quantitative Analyses
To evaluate the phytochemical profile of the 3 different commercial 50% hydroalcoholic extracts of A. membranaceus roots (AMG1, AMG2, AMG3) and A. membranaceus roots (AST), high resolution (HR)-LC-electrospray ionization (ESI)-MS analyses were carried out. The HR-LC-ESI-MS total ion chromatogram (TIC) of each extract is reported in Figure 1. Chromatograms showed a similar qualitative fingerprint in all samples but different amounts of compounds. The first step was the qualitative determination of the main classes of specialized metabolites; compound identification was achieved through accurate precursor ions and MS tandem experiments. As reported in the literature, the main compounds found in A. membranaceus are flavonoids, isoflavonoids, pterocarpans, and saponins.

High resolution liquid chromatography-electrospray ionization-mass spectrometry total ion current chromatograms of the AMG1, AMG2, AMG3 , and Astragalus membranaceus root extract (AST).
In the negative ion mode mass spectrum of compounds
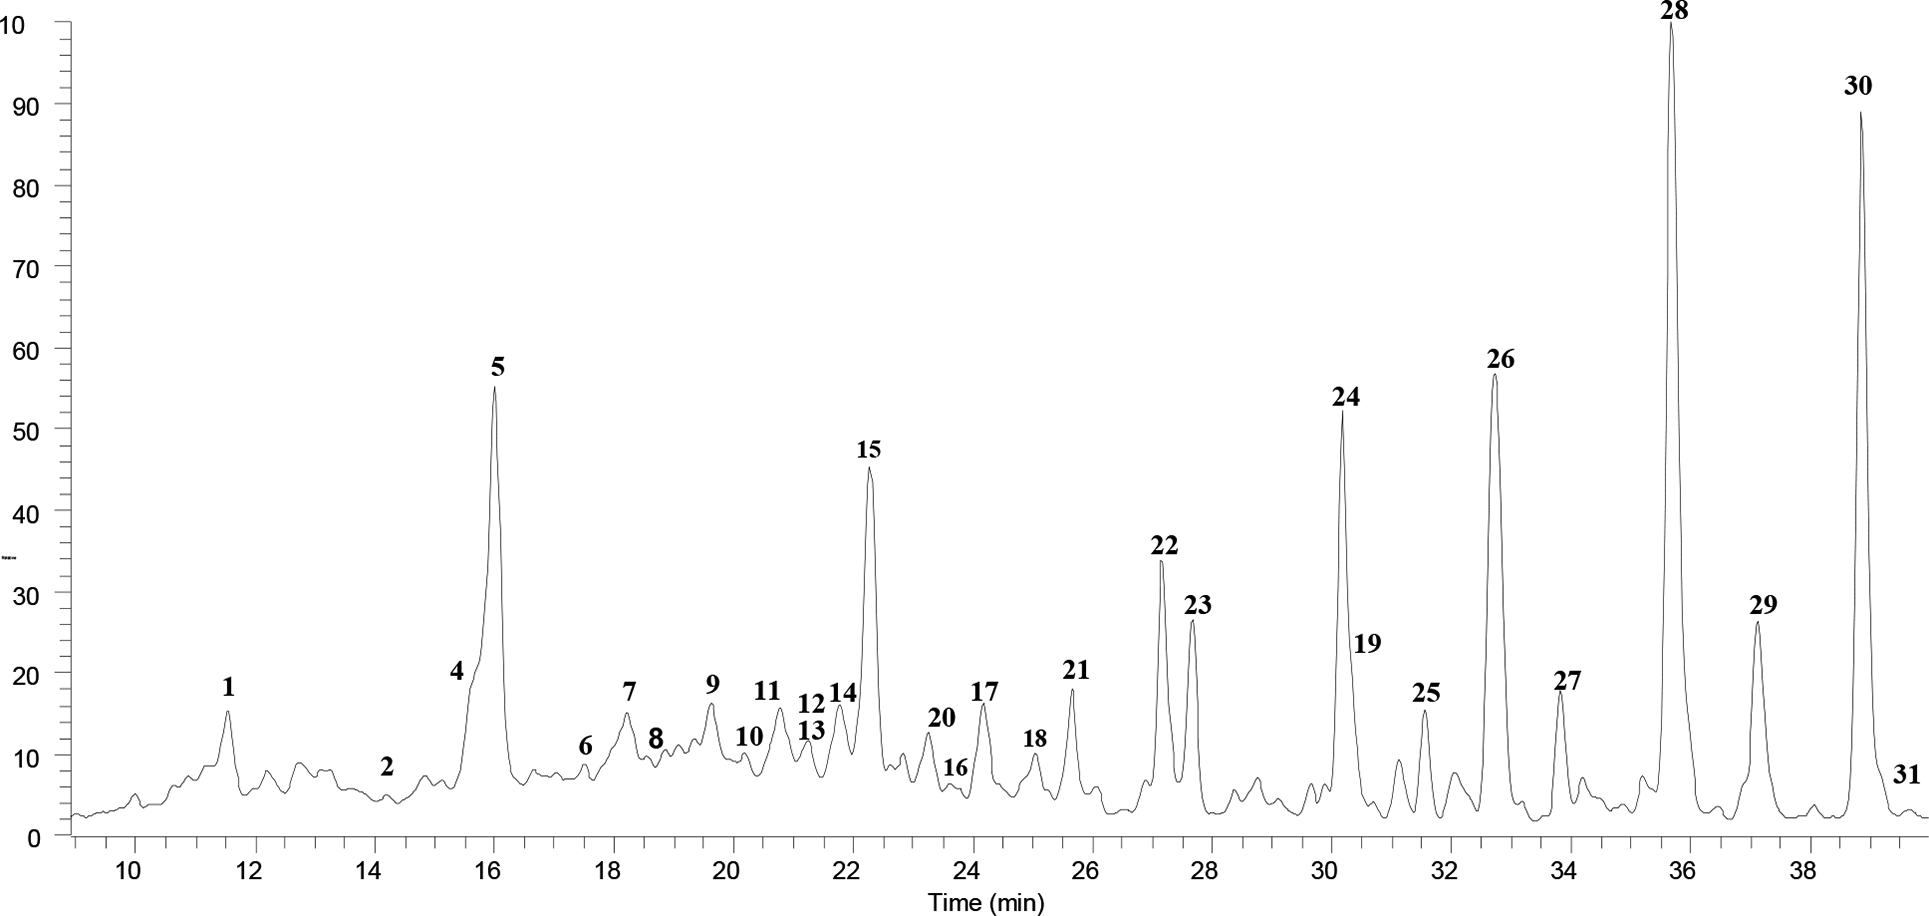
High-performance liquid chromatography-high resolution electrospray ionization-mass spectrometry profile of the polyphenol derivatives and astragalosides in Astragalus membranaceus root extract (AST).
Chromatographic and MS Data of Compounds 1-
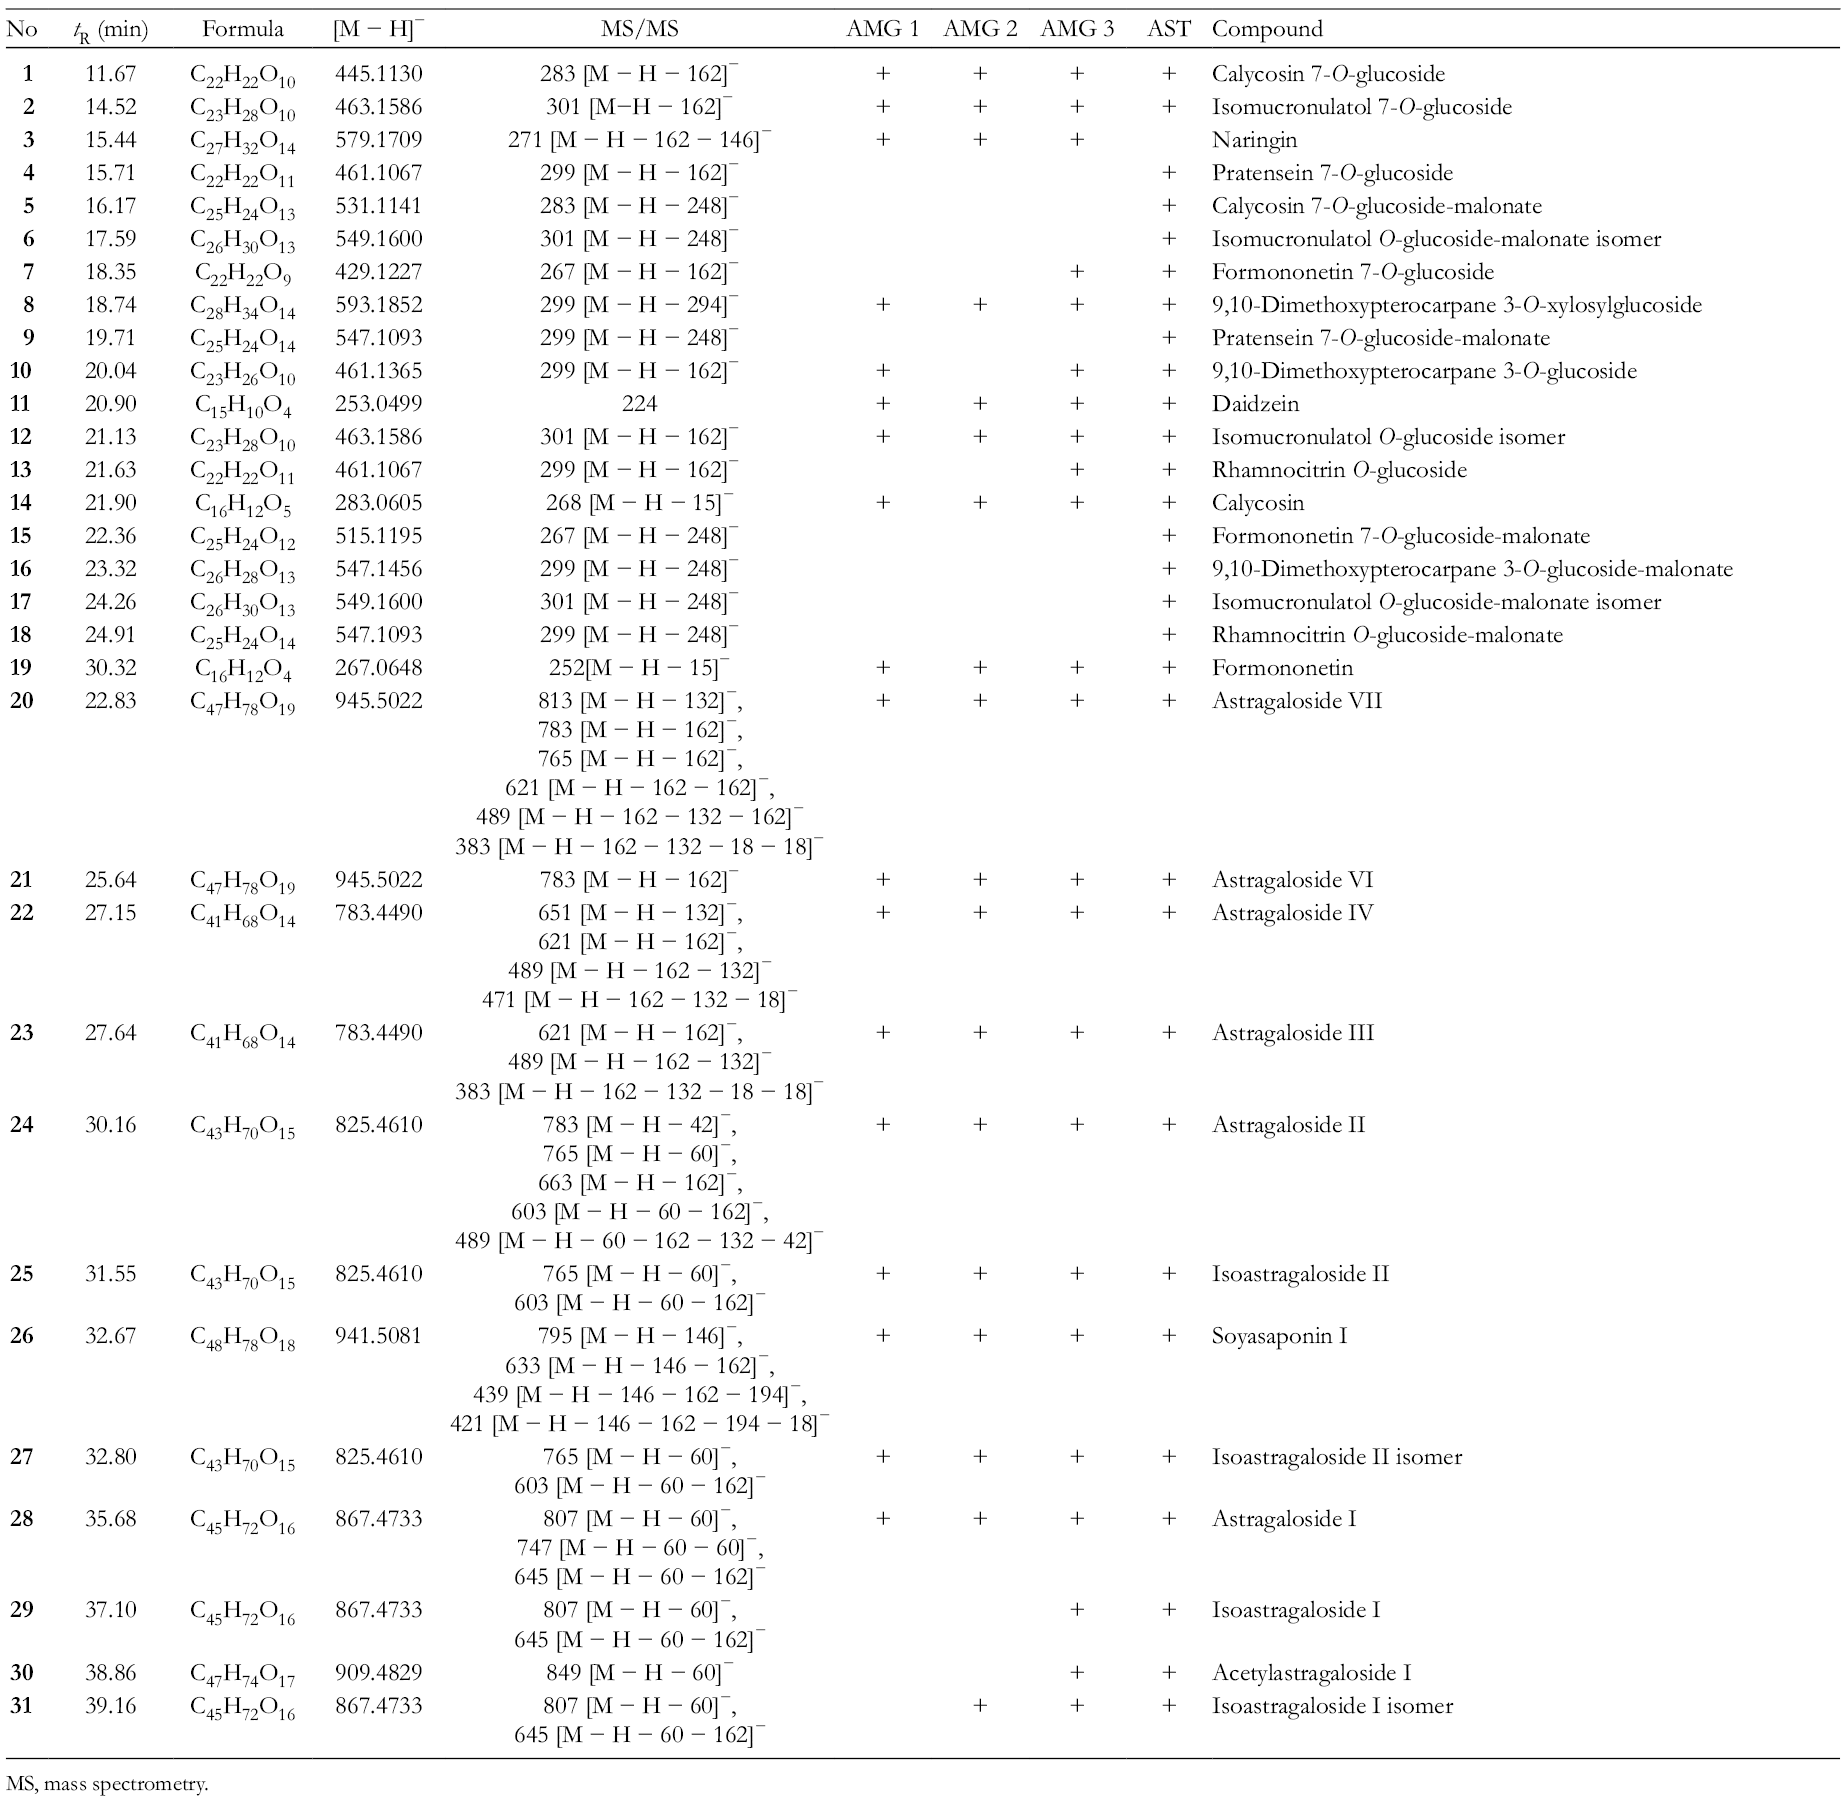
MS, mass spectrometry.
Compounds
Successively, quantitative analysis of the flavonoids and astragalosides fraction was performed in all samples. The flavonoids were quantified as formononetin, whereas astragaloside IV was used to express the saponins amount. In Table 2, the composition of total flavonoids and astragalosides as a percentage of 100 g of extracts is reported. Results of the quantitative analysis indicated that in the AMG3 (Axtragyl), saponins are more abundant compared with the other samples, whereas the flavonoids are the most represented in AST sample compared with the other three , although the flavonoids content in AMG3 was higher than in AMG1 and AMG2. Astragaloside I and astragaloside IV, being the most representative among the saponins, were selected and quantified in all samples as a marker of quality of the commercial batches. In order to obtain accurate data regarding their amounts, a selective and sensitive ultra-performance liquid chromatography-ESI-QTrap-MS/MS method was developed after the direct introduction of the standard to optimize the signal of the analyte. Data were acquired in multiple-reaction monitoring (MRM) mode in triplicate, and the results of quantitative analysis of astragaloside I and astragaloside IV in all the samples are the following: 0.0004 and 0.04 mg/g for AMG1, 0.0003 and 0.011 mg/g for AMG2, 0.24 and 0.84 mg/g for AMG3, and 0.16 and 0.13 mg/g for AST.
Content in Percentage (%) of Flavonoids and Astragalosides in 100 g of AMG1, AMG2, AMG3, and Astragalus membranaceus Root Extract (AST).

α-Glucosidase and α-Amylase Inhibition Activity
Since A. membranaceus root extracts are used in the TCM for the treatment of diabetes mellitus, the hypoglycemic activity of all extracts in comparison to some selected pure compounds was investigated. α-Glucosidase and α-amylase are key enzymes of dietary carbohydrate digestion in humans. Inhibitors of these enzymes may be effective in retarding carbohydrate digestion and glucose absorption to suppress postprandial hyperglycemia. 17 Several molecules are currently used in the clinical practice as antidiabetic drugs including acarbose. These drugs work well by slowing the action of certain enzymes that break down starches and carbohydrates into sugars, but they have known side effects. Several natural compounds have been already demonstrated to possess a similar or even higher ability to inhibit these enzymes than acarbose, that, in this study, has been used as positive control. 18
AMG3 and AMG1 demonstrated the highest inhibitory activity on α-amylase among tested extracts (half-maximal inhibitory concentration [IC50] 495.6 ± 23.8 µg/mL and 679.3 ± 22.1 µg/mL, respectively) but, as expected, lower than acarbose (IC50 3.5 ± 0.2 µM) (Table 3). No activity was observed in the α-glucosidase assay for all the extracts. Among the pure compounds, the astragalosides were inactive (data not shown), while the isoflavone aglycones showed only a mild activity against α-amylase enzyme at tested concentrations. According to previous studies,
19
-21
daidzein (
α-Amylase and α-Glucosidase Inhibition of AMG1, AMG2, AMG3, Astragalus membranaceus Root Extract (AST), and Pure Compounds.

IC50, half-maximal inhibitory concentration.
*In this case, it was not possible to reach the IC50 value; the results were expressed as % α-amylase inhibition obtained testing extract at 50 µg/mL.
Acarbose IC50 9.59 ± 0.90 and 350.3 ± 12.6 µg/mL vs α-amylase and α-glucosidase respectively. Significant differences (P < 0.05) are represented with different letters.
Molecular Docking of Daidzein and Formonoetin Into Human Small Intestine α-Glucosidase
To get further insight into the inhibitory effects of compounds

Docking of daidzein (11) and formononetin (19) in the C-terminal domain of human small intestinal α-glucosidase. Daidzein (a) (in sticks with carbons in cyan) and formononetin (b) (in sticks with carbons in orange) docked into the binding pocket of α-glucosidase (gray spheres with interacting residues in sticks with carbons in green) close to the active site residues (D1420 and D1526) and where acarbose (displayed as lines with carbons in yellow) binds.
Cholinesterase Inhibition Activity
According to the published studies on the protective role of A. membranaceus in nervous cell models, the modulation of cholinesterase enzyme activity was also investigated. 23 Cholinesterase enzymes, acetylcholinesterase (AChE) in particular, are an important target for the treatment of several neurodegenerative disorders including Alzheimer’s disease (AD). Nowadays, prevention of acetylcholine degradation in synapses is one of the most accepted palliative therapy opportunity for neuroprotection. 24 Since the introduction of the first cholinesterase inhibitor in 1997, most clinicians consider cholinergic drugs such as galantamine used in this study as the reference drug, as first-line pharmacotherapy for mild and moderate AD. 25
In the present study, the inhibition of AChE and butyrylcholinesterase (BChE) enzymes was evaluated for all extracts and pure compounds (Table 4). AMG3 reported the highest AChE inhibition (IC50 27.9 ± 5.1 µg/mL) at tested concentrations. All extracts showed a similar value of inhibition vs BChE (Table 4). On the contrary, pure compounds showed a low value of inhibition of AchE activity and no activity in the BChE inhibition assay (data not shown).
AChE and BChE Inhibition of AMG1, AMG2, AMG3, and Astragalus membranaceus Root Extract (AST).

AChE, acetylcholinesterase; BChE, butyrylcholinesterase; IC50, half-maximal inhibitory concentration.
Percentage of AChE and BChE inhibition obtained testing extracts at 50 µg/mL and of pure compounds at 5 µM; galantamine IC50 = 0.2 ± 0.0 and 6.9 ± 0.4 µg/mL vs AChE and BChE, respectively. Significant differences (P < 0.05) are represented with different letters.
Antioxidant Activity
Several studies reported a protective effect of A. membranaceus preparations in intestinal injury models. 26 In our study, the antioxidant activity of the four samples was evaluated in differentiated Caco-2 cells. However, preliminary, the cytotoxic potential of the extracts was evaluated in human peripheral blood mononuclear cells (PBMC) from healthy donors. All extracts did not cause any toxic activity at 150 µg/mL. Then, to investigate ROS-induced cytotoxic effects in Caco-2 cells, increasing amounts of H2O2 were added to the medium, bathing the apical side of the cells, and after incubation, cellular alterations were evaluated. Incubation of cells in the presence of a molar concentration of H2O2 resulted in a decrease in Caco-2 viability; after 20 hours of treatment with 10 mmol/L H2O2, about 25% loss of cell viability was observed. Then, the protective effect of the extracts against H2O2-induced injury to the intestinal Caco-2 cells was investigated. When cells were pretreated with each sample before being challenged with 10 mmol/L H2O2, a moderate decrease in cell viability was observed, indicating that the extracts at a dose of 150 µg/L are able to reduce the H2O2-induced toxicity. Among all tested extracts, AMG3 (Axtragyl) was able to improve cell viability even at the lowest tested concentrations (Table 5). Nevertheless, further experiments on different cell model assays will be performed to confirm obtained results, together with in vivo studies directed to the assessment of other biological properties related to A. membranaceous root extract.
Effect of Cytotoxicity in Caco-2 Cells of AMG1, AMG2, AMG3, and Astragalus membranaceus Root Extract (AST).

Values are means ± standard deviation; N = 3.
Significant differences (P < 0.05) are represented with different letters.
Conclusions
Herbal extracts should be standardized to ensure safety, quality, and efficacy. In our study, LC-MS/MS-based approach was used to characterize specialized metabolite recovery in 3 different commercial samples of A. membranaceus (hydroalcoholic roots extracts) AMG1, AMG2, and AMG3 and compared with the freshly produced hydroalcoholic extract of A. membranaceus roots (AST). Thirty-one compounds, of which 19 polyphenols and 12 saponins were identified showing that all extracts possess the typical polyphenols and saponins pattern of A. membranaceus roots. Among the extracts, AMG3 commercial sample (Axtragyl) resulted in a higher content of bioactive compounds proven to confer protective benefits. AMG3 showed a fingerprint comparable to that of AST confirming the high degree of reproducibility of the manufacturing process. Regarding the biological assays, the most interesting results come from flavonoids, particularly in the α-glucosidase inhibition activity test, where
Experimental
Reagents
Solvents for extraction were purchased from Sigma Chemicals Company (Milan, Italy). LC–MS grade solvents were purchased by Romil Ltd Pure Chemistry (Cambridge, GB). For the quantitative HPLC analysis, the following standards were used: astragaloside IV, European Pharmacopeia (EP) reference standard (97.8%), astragaloside I, Phyproof reference substance ≥98.0% (HPLC), and formononetin, analytical standard (≥98% by HPLC) from (Sigma-Aldrich, Milano, Italy). Dulbecco’s modified Eagle’s medium (DMEM), Eagle’s minimum essential medium (EMEM), and fetal calf serum (FCS), penicillin–streptomycin, from porcine pancreas and phosphate-buffered saline (PBS) tablets were purchased from Euroclone.
Plant Material
The roots of A. membranaceus (Fish.) Bunge were collected from plants cultivated in Sichuan province and Gansu province (China). Axtragyl (Giellepi Health Science, Lissone, Italy) is an A. membranaceus root extract manufactured using a selective extraction process that ensures a broad spectrum of natural bioactive compounds. Commercial samples of A. membranaceus dried roots 50% hydroalcoholic extract, respectively, renamed AMG1, AMG2, and AMG3 (Axtragyl) were provided by Giellepi.
Extraction and Sample Preparation
The dried roots of A. membranaceus (500 g) were powdered and extracted with 50% hydroalcoholic mixture by exhaustive maceration for 48 hours (3 × 2.5 L). The extraction solvent was eliminated under vacuum obtaining almost 68 g of dried hydroalcoholic extract (AST). For qualitative and quantitative analyses, 10 mg of AST, AMG1, AMG2, and AMG3 were dissolved in 1 mL of ultrapure methanol, obtaining a concentration of 10 mg/mL, and, after centrifugation for 5 minutes at 13 000 rpm, the supernatant was subjected to LC-ESI-MS analysis.
LC–MS Qualitative Analysis
The separation system adopted was an Accela (Thermo Fisher Scientific, Milan, Italy) HPLC interfaced through an ESI source to a linear ion trap coupled to a high-resolution mass analyzer (LTQ-Orbitrap XL, Thermo Fisher Scientific, Milan, Italy). The MS data were acquired, in negative ion mode, at first in full-mass and data dependent-scan mode, then, tandem MS experiments were done in order to identify the specialized metabolites. Capillary temperature was set at 350°C, flow rate of sheath gas and auxiliary gas were set at 30.0 and 10 arbitrary units, capillary voltage was −48.0 V. A C18 column (Luna C18, Phenomenex, 100 × 2.0 mm, 2.5 µm) and a binary mobile phase composed of eluent A (ultrapure water–formic acid 0.1% v/v) and eluent B (ultrapure acetonitrile–formic acid 0.1% v/v) were used. The separation conditions are from 10% to 95% of B in 60 minutes. Flow rate was 0.0200 mL/min and the injection volume 10.0 µL.
LC–MS Quantitative Analysis
Quantification of astragalosides I and IV was carried out using an API6500 Q-Trap (ABSciex Foster City, CA, USA) coupled with an A NexeraX2 UHPLC apparatus (Shimadzu, USA), working in negative MRM mode. All the instrumental parameters were optimized directly injecting solutions containing pure compounds. Samples were loaded on a Kinetex column (Phenomenex) (C18 100 A, 50 mm × 2.6 µm × 2.1 mm), and compounds were separated using a linear gradient from 30% to 55% of acetonitrile (eluent B) and water containing 0.1% formic acid (eluent A) over 10 minutes. The flow rate was 0.35 mL/minute, and the injection volume was 3 µL for standards and samples. To perform accurate quantitative analyses, 9 points (in the range 0.10-2 µg /mL) calibration curves were built for the two astragalosides. The mean values ± standard deviation from at least three experiments showing similar results were reported.
α-Amylase Inhibition Assay
The α-amylase inhibition assay was performed using the iodine/potassium iodide method. 27 Each sample (25 µL) was mixed with the α-amylase solution (50 µL, 5 U/mL) in phosphate buffer (pH 6.9 with 6 mM sodium chloride) in a 96-well microplate and incubated for 10 minutes at 37°C. Then, the reaction was initiated with the addition of the starch solution (100 µL, 0.1%). Similarly, a blank was prepared by adding a sample solution to all reaction reagents without enzyme solution. The reaction mixture was incubated for 10 minutes at 37°C. The reaction was then stopped with the addition of hydrochloric acid (HCl, 25 µL, 0.1 M). This was followed by the addition of a potassium iodide (KI /0.5 mM) solution (100 µL). The absorbance of the sample and blank was read at 630 nm for 10 minutes. Results are expressed as IC50 values (μg/mL for extracts and pure compounds) determined by GraphPad Prism 5 Software (San Diego, CA, USA). When it was not possible to reach the IC50, % of enzyme inhibition measured at certain concentrations is reported.
α-Glucosidase Inhibition Assay
Different concentration of each sample was incubated with the α-glucosidase solution (40 µL, 0.1 U/mL) in phosphate buffer (50 µL, 0.1 M, pH 7) for 10 minutes. Then, 40 µL of 0.5 mM 4-nitrophenyl α-
In Silico Molecular Docking
Molecular docking of conformationally flexible
AChE and BChE Inhibition Assay
The inhibition of AChE was determined based on Ellman’s method, as reported by Faraone et al. 31 In this assay, 25 µL of 0.05 U/mL AChE, 125 µL of DTNB (3 mM), 25 µL of buffer B (50 mM Tris–HCl, pH 8 containing 0.1% BSA), and 50 µL of the sample at different concentrations were incubated for 10 minutes. Then, 25 µL of acetylthiocholine iodide (5 mM) was added, and the absorbance was measured at 405 nm after 10 minutes. The BChE inhibition assay was performed in a similar way using 25 µL of butyrylthiocholine chloride (5 mM) as substrate and 0.05 U/mL of BChE as enzyme. Three independent assays were performed in triplicate at different concentrations. Results are expressed as % of enzyme inhibition measured at certain concentrations.
Cell Cultures
PBMC cells were isolated from buffy coats of healthy donors and cell viability evaluated as reported before.
32
Caco-2 cells were maintained in DMEM, containing 200 mL/L FCS, 10 mL/L of 100× nonessential amino acids, 2 mmol/L
Induction of Oxidative Stress and Neutral Red Assay
An iron-free medium (EMEM) was used for the oxidative stress induction experiments. The oxidative stress was induced in the apical compartment of the transwell insert by the addition of H2O2. To assay the capacity of AMG1, AMG2, AMG3, and AST to protect Caco-2 cells from ROM-mediated oxidative injury, cells were preincubated for 4 hours with extracts that were added to the apical side of monolayer. After the end of the preincubation time, the medium was changed before the addition of the oxidative stress-inducing agents. The cytotoxicity of ROM on Caco-2 was assessed by the viability test of neutral red uptake, performed according to the procedure of Fautz et al. 34 After oxidative stress induction, the medium in the insert was removed and replaced with 0.1 mL of fresh medium containing 1.14 mmol/L neutral red. At the end of 3 hours of incubation, the medium was removed and cells were washed twice with PBS; finally, the incorporated neutral red was released from cells by incubation for 15 minutes at room temperature in the presence of 1 mL of cell lysis buffer containing acetic acid (1%, v/v) and ethanol (50% v/v). To measure the dye taken up, the cell lysis products were centrifuged and supernatants spectrophotometrically measured at 540 nm.
Statistical Analysis
Data were expressed as mean ± standard deviation. Statistical analysis was performed by analysis of variance followed by Tukey’s test using GraphPad Prism 5 Software, Inc. (San Diego, CA, USA) and a P-value of 0.05 or less was considered as statistically significant. All measurements were performed by using SPECTROstarNano (BMG Labtech, Ortenberg, Germany).
Footnotes
Declaration of Conflicting Interests
The author(s) declared no potential conflicts of interest with respect to the research, authorship, and/or publication of this article.
Funding
The author(s) disclosed receipt of the following financial support for the research, authorship, and/or publication of this article: This work was financially supported by FARB 2018, University of Salerno.