
Abstract
Rosmarinic acid (RA) is a phenolic acid found in a variety of plants, especially those in the Lamiaceae family. A number of biological effects are attributed to the compound; so, in recent years, RA has been the focus of many studies. The aim of this review is to provide information on the latest developments on flow chromatography analysis of RA. A reverse-phase high-performance liquid chromatography (HPLC) method with gradient elution and either diode array or mass spectrometric detection is usually used to measure the compound. Factors affecting the performance of HPLC analysis of RA such as sample preparation, column, mobile phase, and detection methods are discussed in detail in this review.
The Lamiaceae (formerly Labiatae) family is the sixth largest plant family, with more than 200 genera and 7000 species. Many plants of this family have aromatic and spicy properties which make them important for the pharmaceutical, food, and cosmetic industries, and can easily be cultivated. 1 Many species in this family are used as culinary herbs, eg, basil (Ocimum spp.), hyssop (Hyssopus officinalis L.), lavender (Lavandula angustifolia Mill.), lemon balm (Melissa officinalis L.), marjoram (Origanum majorana L.), oregano (Origanum vulgare L.), peppermint (Mentha × piperita L.), rosemary (Rosmarinus officinalis L.), sage (Salvia officinalis L.), and thyme (Thymus vulgaris L.). 2,3
Lamiaceae species have been used in traditional medicine for the treatment of depression, headache, asthma, 4 stress, 5 and respiratory 6 and Alzheimer’s diseases. 7,8 In addition, these plants have antioxidant, 9 antiallergic, 10 antimicrobial, 11 anticarcinogenic, 12 anti-inflammatory, 13 astringent, 14 and antiHIV-1 effects. 15 These properties are mainly due to phenolic compounds found in the plants, especially rosmarinic acid (RA). 16 Rosmarinic acid is found in the Boraginaceae and Lamiaceae families, with the highest bioavailability found in the subfamily Nepetoideae. 17,18 The most important steps in measuring polyphenol compounds are the extraction process and identification of bioactive compounds. It is one of the biggest challenges for analysts due to the large number and variety of natural phenolics in different classes. 19,20
This review includes the latest research in high-performance liquid chromatography (HPLC) analysis of RA from herbs in the Lamiaceae family.
Chemistry of RA
Rosmarinic acid was first isolated in 1958 by Scarpati and Oriente from R. officinalis. 21 Ellis and Towers 22 reported 12 years later a biosynthetic pathway of RA for the first time. From a chemical point of view, RA (molecular formula: C18H16O8, molecular mass: 360.3 g/mol), a phenylpropanoid, is the caffeic acid ester of 3,4-dihydroxyphenyllactic acid. 23 -25 Rosmarinic acid contains 2 aromatic amino acids, phenylalanine and tyrosine, which are joined through an ester linkage. The caffeic acid and 3,4-dihydroxyphenyllactic acid are synthesized through 2 distinct routes of the shikimic acid biosynthesis pathway. The caffeic acid part is formed only from phenylalanine and the 3,4-dihydroxyphenyllactic acid only from tyrosine. 26 -28
Rosmariic acid is a yellowish-white crystalline powder with a 174°C melting point, 29 an optical rotation of 140°, and D-(+) = (R)-(+) absolute configuration at the chiral center. 30 The compound is more soluble in most organic solvents, but less soluble in water. 31
Aydi et al 32 investigated the solubility and thermodynamic properties of RA in 3 solvents (water, ethyl acetate, and methyl acetate) and in their binary solvent mixtures at different temperatures ranging from 20°C to 40°C. Their results show that the solubility of RA in individual solvent mixtures increases with the increasing temperatures. However, the solubility of RA decreases with an increase in water content. They found that the best solvents were pure methyl and ethyl acetate.
Similarly, Zibetti et al 33 investigated the solubility of RA in pure solvents (water, methanol, ethanol) and binary solvent mixtures (methanol + water and ethanol + water) from 20°C to 45°C. Their results show that the solubility of RA was increased by higher temperature and the molar fraction of ethanol and methanol, while it decreases with an increase of water in the solvent mixture.
The chemical synthesis of RA was achieved by Albrecht in 1991, but since then, there are many examples of its synthesis. 34,35 The (R)-enantiomer of RA was reported in 1996. 36 The chemical structure of RA is shown in Figure 1.

Structures of R-(+)-rosmarinic acid (a) and S-(−)-rosmarinic acid (b) enantiomers.
Extraction of RA From Lamiaceae Plants
The structure of polyphenols from different plants varies widely, so creating a standard extraction protocol to extract all target compounds from different sources is impossible. 37 There are several extraction techniques for polyphenols from plants. 38 Ngo et al 39 reported in their review that the commonly used extraction methods for RA include the following: maceration, maceration with continuous stirring, percolation, hydrodistillation, heat reflux extraction, Soxhlet solvent extraction, ultrasound-assisted extraction, microwave-assisted extraction, enzyme-assisted extraction, and supercritical fluid extraction.
Attention is focused on extraction techniques that use solvents that are either not or less harmful to human health. 40 Most frequently, ethanol and water are used as extraction solvents because they have low toxicity and high extraction yields with the advantage that the polarity of the solvents can be modified by varying the ratio of the ethanol-water mixture. 41 The extraction of RA from plants is carried out with medium polarity organic solvents. 33 Some studies reported that for the extraction of RA, a variety of concentrations of binary solvent mixtures such as water, methanol, and ethanol is used. 4,42-44 Other solvents such as acetone, chloroform, and ethyl acetate have also been reported. 45 -47 In preparing extracts of RA-rich plants, it is advisable to use either an acidified ethanol or methanol-water mixtures, because such solvent systems denature the cell membrane of plants and stabilize the RA. To achieve the best yield of extraction, the use of either a weak organic acid, such as formic, acetic, citric, tartaric, or phosphoric acid, or a low concentration of strong acid, such as 0.5% to 3.0% trifluoroacetic acid (TFA) or <1% hydrochloric acid, is recommended. 48
High-Performance Liquid Chromatography Analytical Studies
The most widely used method for determining RA in plant extracts is HPLC with UV-spectrometric detectors. 42 Most recently, Fourier transformation IR spectroscopy has been reported as a new tool to determine RA in situ. 49 Other techniques include the following: liquid chromatography-mass spectrometry (LC-MS), 50 high-performance thin-layer chromatography, 51,52 and capillary electrophoresis. 53
High-performance liquid chromatography techniques are relatively simple with high accuracy, resolution, selectivity, and sensitivity and can be fully automated. 54 The advantage of modern HPLC-diode array detection (DAD) equipment is that it has a low sensitivity level (1 × 10⁻⁵ AU). 55
Sample Preparation for HPLC
The procedure of sample preparation for the analysis of phenolic compounds depends on many factors, eg, sample matrix, chemical properties of the phenolic structure, and polarity and number of aromatic rings and hydroxyl groups. 56
Simple sample preparation is usually performed to separate RA. This means that the extracts are centrifuged and simply filtered through either a membrane filter (polyvinylidene difluoride [PVDF nylon]) or filter paper and then injected directly onto the HPLC column. In many cases, the samples are diluted and then injected onto the HPLC column. 38,57-59 Often, the extract is evaporated until dry and then recovered in an organic solvent. 60 Solid phase extraction is often used as a sample preparation technique because it is rapid and selective, so it is a very popular method for isolation and purification of bioactive compounds from plants extracts. 61,62 Table 1 summarizes different extraction and sample preparation techniques of RA from various Lamiaceae plants.
Extraction and Sample Preparation Process for Rosmarinic Acid From Lamiaceae.
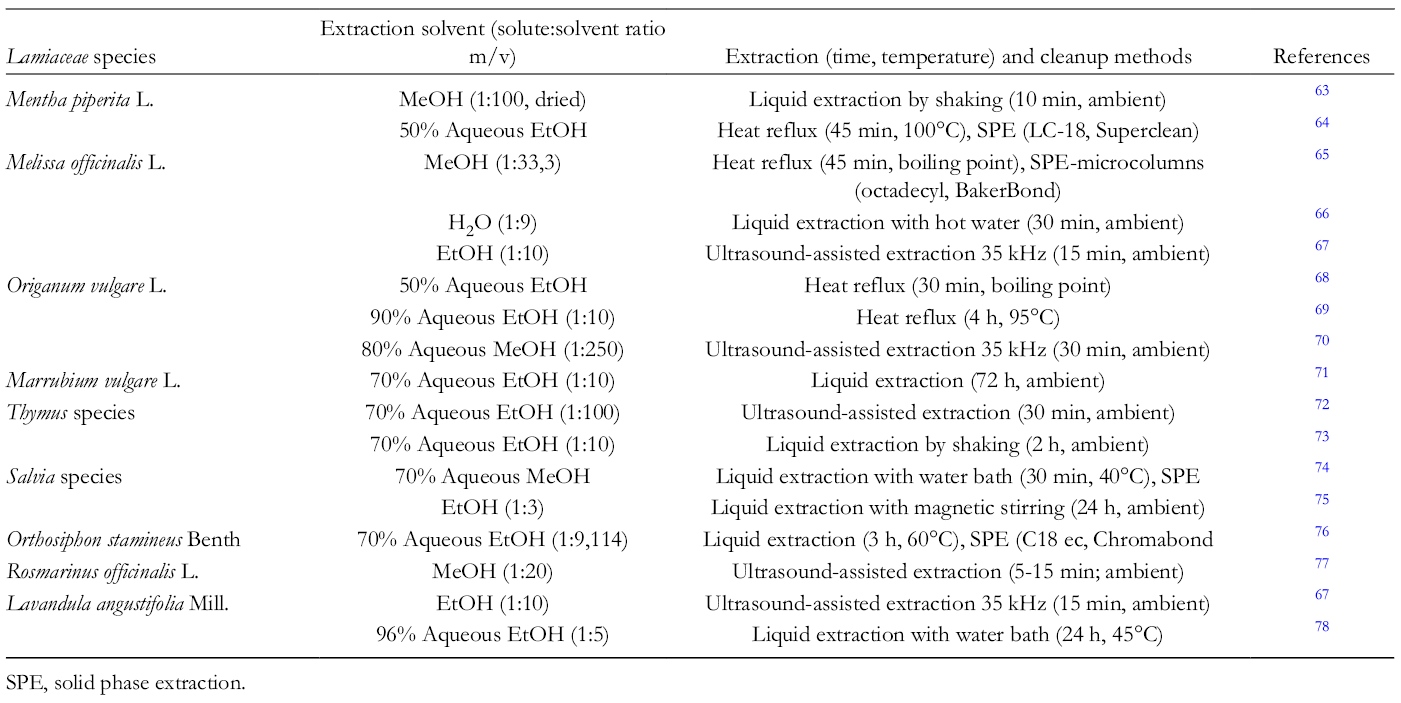
SPE, solid phase extraction.
High-Performance Liquid Chromatography Columns
In almost all cases, reverse-phase (RP) C18 columns are used for the separation of phenolic compounds. Usually, the columns are 100 to 250 mm in length with 3.9 to 4.6 mm internal diameters and have a particle size of 3 to 10 µm. Narrow-bore columns are used, especially for HPLC-MS techniques. These columns have a small internal diameter (~2 mm). When using smaller internal diameter columns, the HPLC has to be adapted to the equipment, eg, UV detection cells with reduced volume, low injection volume, or low flow rate. 79 Monolithic and superficially porous particle columns are used in ultra-high performance chromatography, high-temperature liquid chromatography, and two-dimensional liquid chromatography (LC × LC). These new columns are 3 to 25 cm in length, 1 to 4.6 mm internal diameter, and 1.7 to 10 µm particle size. 56 Hydrophilic interaction chromatography (HILIC) columns are also widely used to determine polyphenolic compounds in plants. This method is essentially normal phase liquid chromatography, using a RP liquid chromatographic solvent. 54 The offline RP-HILIC system proffers the advantage of outstanding peak capacity and resolution. 80 The stationary phase of HILIC has a polar charge and includes silica gel, modified silica gel (diol, amide, aminopropyl, and zwitterionic phase), or ion exchange phase. 81
The temperature of the columns is usually 25°C to 30°C during the measurement of RA, 16,58,82,83 but higher temperatures also have been reported. 23,84,85
Ziaková and Brandšteterová 59 chose several RP columns for separation of RA from various Lamiaceae plants. They tested the following analytical columns: GROM-SIL 100 ODS-0 AB, 120 ODS-3 CP, 120 ODS-4 HE, SEPARON SGX C18, Symmetry Shield C18, Symmetry C18, Develosil ODS), C8 (GROM-SIL 100 OCTYL-4 FE), and CN (GROM-SIL 120 CYAN-3CP). They evaluated and compared a number of chromatographic characteristics, eg, retention time, capacity factor, chromatographic resolution, asymmetry factor, and theoretical plate number. Their results showed that the cyanopropyl stationary phase is not suitable for the separation of RA because a high asymmetry factor was found for the RA peak. The best symmetries of the RA peak were found using Symmetry Shield, Symmetry, and Grom Sil 120 ODS-4 HE columns.
Mobile Phases
Most phenolic acids have a pKa of about 4 (pKa of RA = 3.57), so the recommended pH range for HPLC analysis is 2-4. The pH is controlled by the addition of small amounts of acids. 86 This is very important to avoid the ionization of phenols during identification 56 and helps better separation without tailing. 39
To determine RA in plants, methanol, 87 acetonitrile (ACN), 88 and water with low concentrations of acetic acid, 82 formic acid, 20 phosphoric acid 89 and TFA, 90 or sodium citrate, 91 ammonium acetate, 23 ammonium formate, 75 and phosphate buffers 92 have been used. The acid concentration can vary from 0.01% to 6%, 93 and the buffer salts concentration from 5 to 50 mM. 86 Most commonly, gradient techniques are used to identify RA, 16,83,94,95 but an isocratic method has also been reported. 77,96-99
Detection
Various studies have reported chromatographic techniques for the separation of RA from Lamiaceae plants. Table 2 lists those using HPLC method for qualitative and quantitative analysis.
Summary of High-Performance Liquid Chromatography Analysis of Rosmarinic Acid in Lamiaceae Plants.
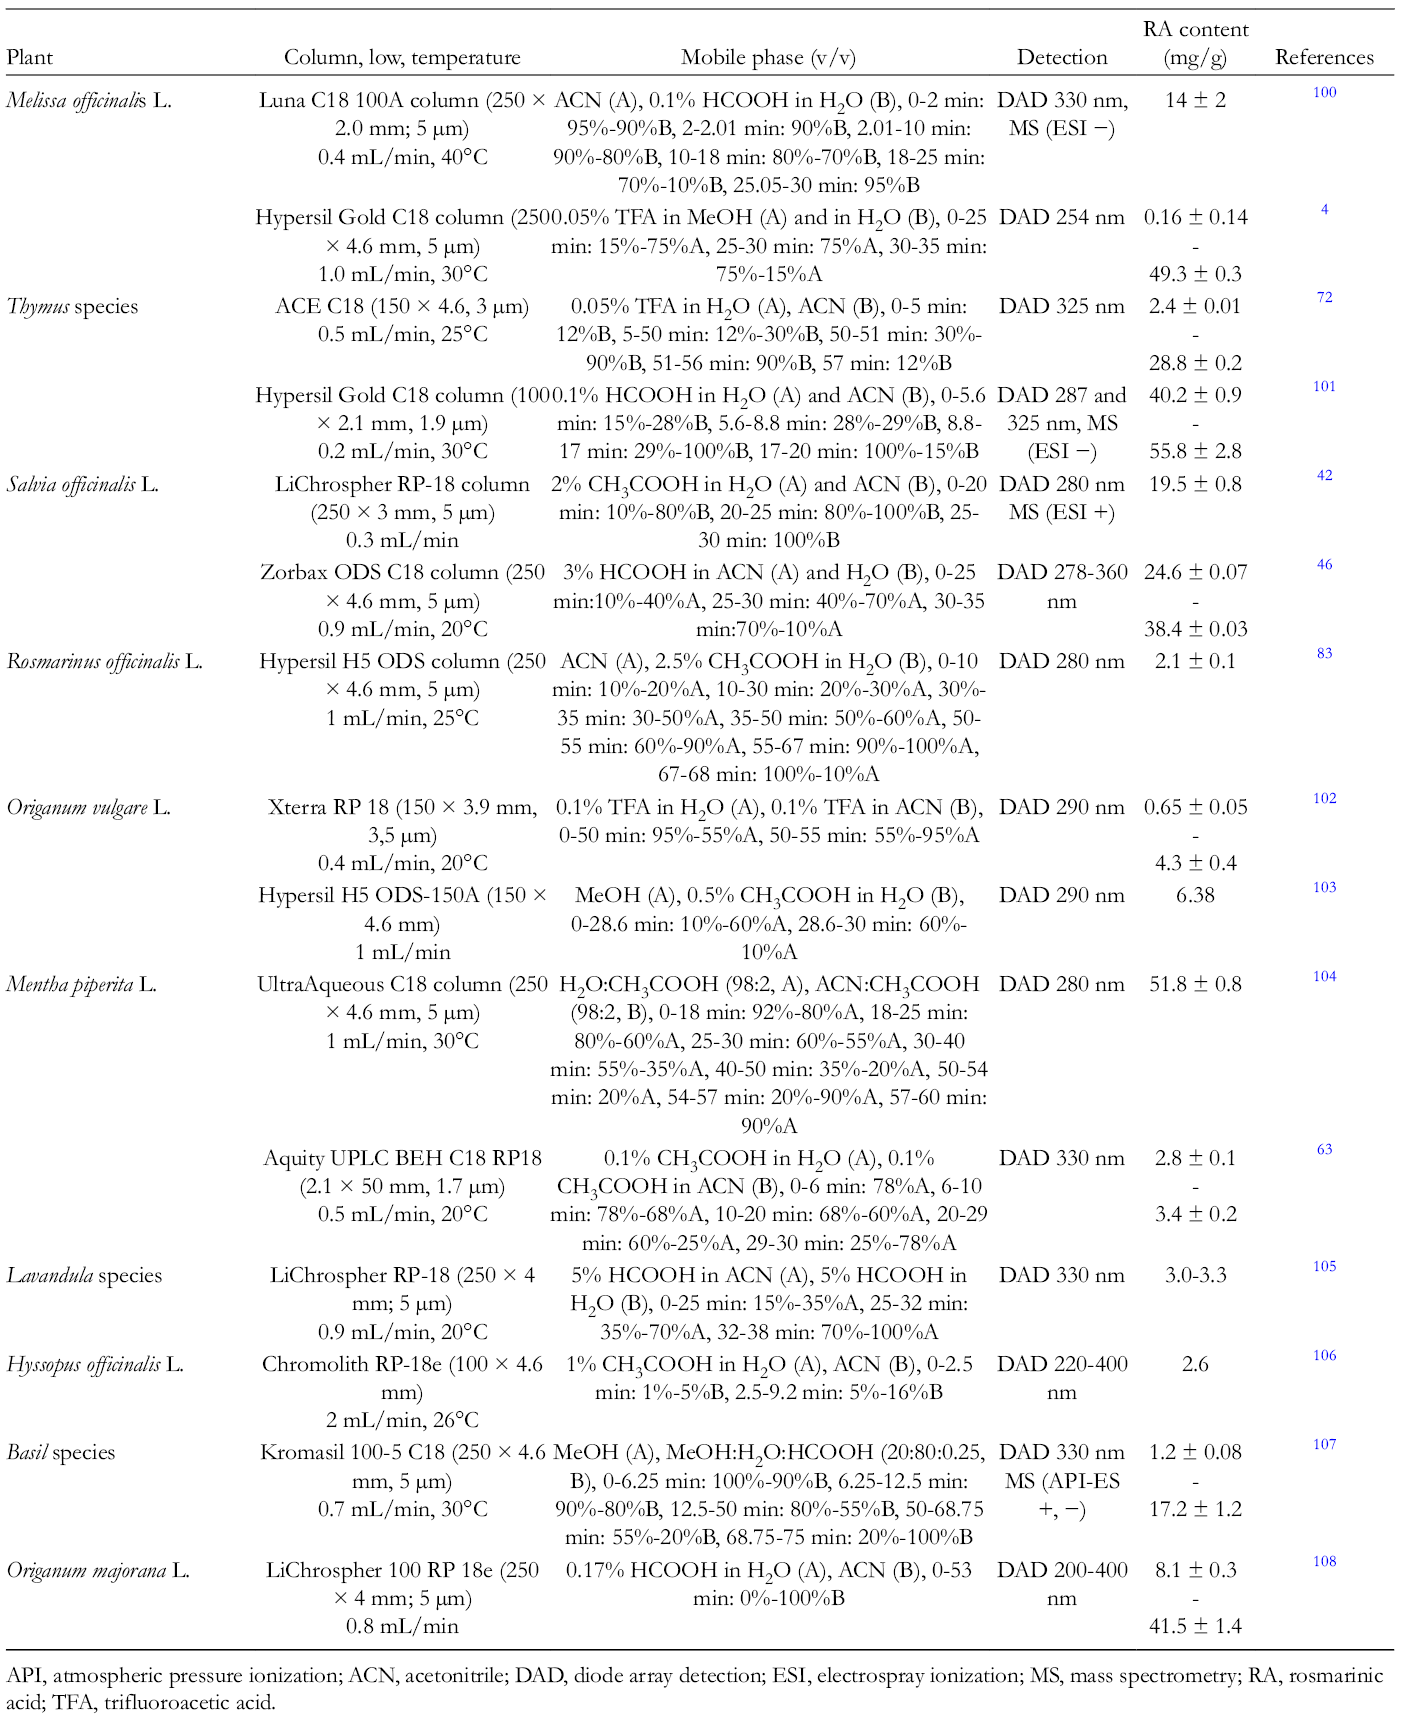
API, atmospheric pressure ionization; ACN, acetonitrile; DAD, diode array detection; ESI, electrospray ionization; MS, mass spectrometry; RA, rosmarinic acid; TFA, trifluoroacetic acid.
The most predominant technique used to detect phenolic compounds is UV-VIS with diode array detectors (DAD) at a wavelength from 190 to 380 nm because this technique is effective and offers the best means of quantifying phenolic compounds. 109,110 However, in many cases, other detectors should be used, eg, for very low concentrations of certain analytes. In this case, the best choice is to combine DAD with fluorescence or electrochemical detectors. 86,98 The coupling of liquid chromatography and NMR has attracted attention as well, as it enables structural characteristics and also gives information about the differentiation of isomers. However, this method is less common for detecting RA, because HPLC with NMR is expensive and can only measure small amounts. 111 Exarchou et al 112 identified and quantified RA in methanolic and ethanolic extracts from plants of the Lamiaceae family by NMR detection. The correlation coefficient (R 2) of RA was 0.984. Quantitative determination of RA can be achieved by a straightforward integration of 1D-NMR spectra. The internal standard was 3-trimethylsilyl-3,3,2,2-tetradeuteriopropionic acid sodium salt (d4-TMSP) of known concentration (0.2 mM). The concentration of RA was determined in the following plants: Origanum vulgare: 9.0 g/kg, Satureja hortensis: 25.2 g/kg, Origanum onites: 18.1 g/kg, Salvia triloba: 41.4 g/kg, and Satureja thymbra: 27.4 g/kg.
The complex bioactive compounds of the plants can be identified by retention time, UV spectrum, reference standards, and literature. 113 The absorption maximum of most of the benzoic acid derivatives is from 246 to 262 nm, with a shoulder from 290 to 326 nm. 114 Rosmarinic acid has a characteristic UV absorption spectrum that provides useful information for structural determination. The studies reported the following absorbance wavelengths for RA identification: 254, 270, 290, 310, 320, 324, and 330 nm. 4,102,115-117 However, detection at 280 nm is most generally used for RA in plant extracts. 42,83,118-120
Skendi et al 121 have developed a simple and reliable RP-HPLC-DAD technique for 24 phenolic compounds, including RA, for Lamiaceae plants. The limit of detection (LOD) for RA was 0.01 µg/mL and the limit of quantification (LOQ) 0.005 µg/mL. In addition, a high correlation coefficient (R2 = 0.9991) was observed for RA in the concentration range studied. The RA contents of 70% methanol extracts from each plant were as follows: oregano: 12.0 g/kg, lemon balm: 8.3 g/kg, satureja: 8.2 g/kg, rosemary: 4.9 g/kg, and thyme: 3.3 g/kg.
In recent years, LC-DAD-MS has been commonly used with electrospray ionization (ESI) to characterize compounds in complex food and botanical materials, as it provides a lot of data (retention time, UV-VIS, and mass spectra). 109 Other important ionization techniques for the identification of RA include atmospheric pressure ionization, 122 atmospheric pressure chemical ionization (APCI), 50 atmospheric pressure photoionization, and matrixassisted laser desorption ionization. Liquid chromatography-tandem mass spectrometry is also widely used for phenolic analysis. 123
Determination by MS is divided into the following 3 steps: ionization, mass analysis, and detection. The sample is ionized when introduced into the mass spectrometer and the molecular weight is calculated on m/z ratio. The mass analyzer is the most important part of the equipment. 113 There are a number of different mass analyzers. The quadrupole mass analyzer, the ion-trap mass analyzer, the high-resolution double-focusing, and tri-sector mass analyzer or the time-of-flight mass analyzer are usually used. 124
Fragmentation patterns of the ions are mostly determined by ESI and APCI. 20 Both positive [M+H]+ and negative [M−H]− ionization modes are used in RA analysis. 49 However, the negative ion mode is more commonly used. Fragmentation of the protonated and deprotonated molecular ions generated from ESI is ordinarily limited and the mass spectra are comparatively simple. In ESI negative ion mode, the common fragments observed for phenolic acids are [M-H-CO2]− . This is due to the removal of the carboxyl group from the deprotonated molecular ions. 20 Figure 2 shows the main mass fragmentation profile of RA, where m/z = 360 is the radical ion of RA (C18H16O8 +), m/z = 198 is the radical ion of 3,4-dihydroxy phenyllactic acid (C9H10O5 +), and m/z = 180 is the radical ion of caffeic acid (C9H8O4 +). Further fragmentation ions are the following: (m/z) =163 (C9H7O3 +) acylonium ion, 134 (C8H6O2 +), 123 (C7H7O2 +) base peak, 78 (C6H6 +), and 77 (C6H5 +). 125
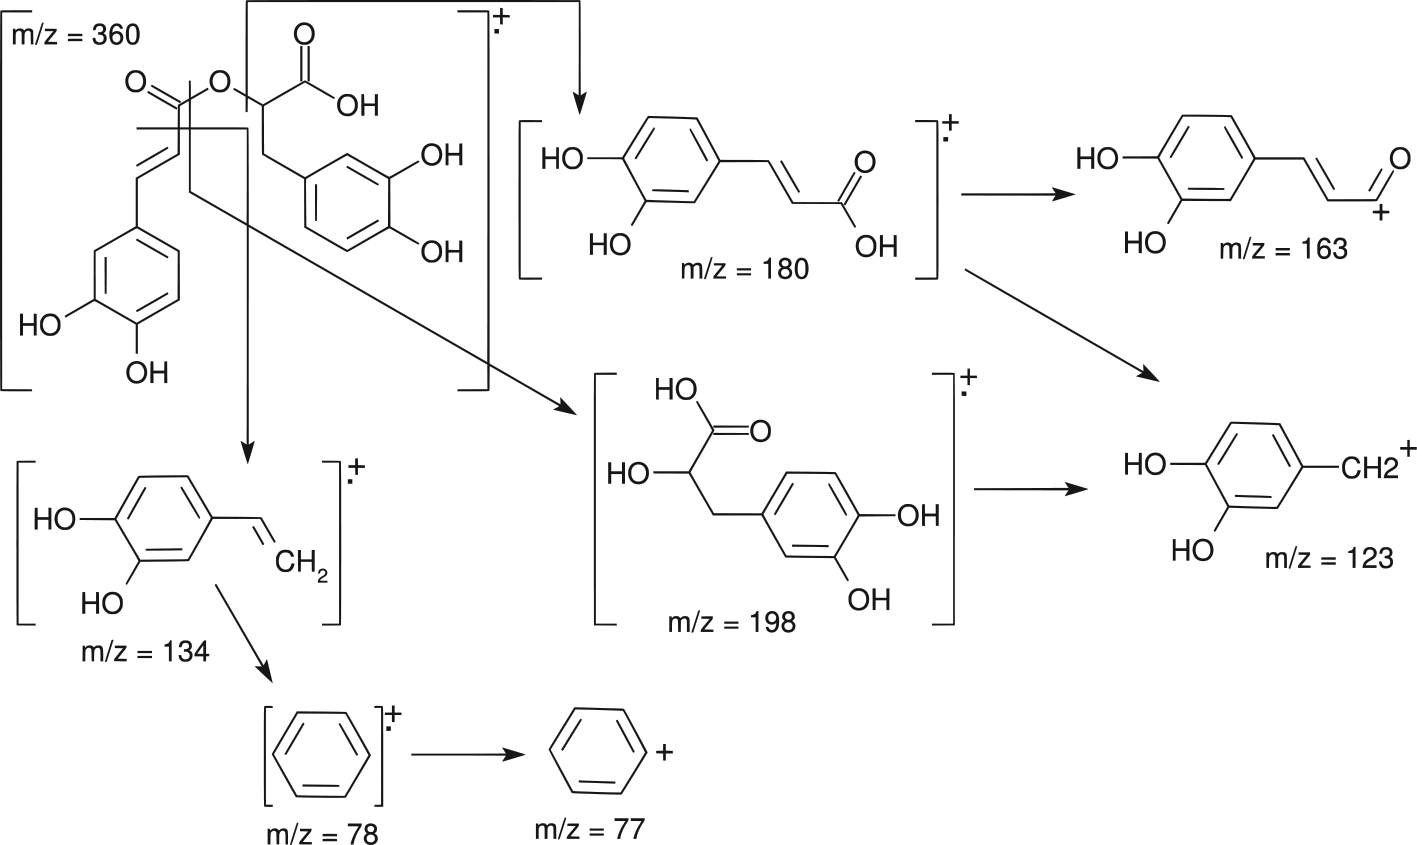
The main fragmentation profile of rosmarinic acid; m/z: mass to charge ratio.
Tohma et al 75 have analyzed the phenolic contents of 3 Salvia L. species. For quantitative and qualitative analysis, a RP-HPLC/MS technique was used. Values for the analytical performance characteristics of RA were LOD/LOQ: 10.4/34.8 µg/L, recovery: 101.7%, and correlation coefficient: 0.9992. A negative ion mode was used for analysis. The main fragmentation profile of RA was at m/z 358.9. The contents of RA were as follows: Salvia brachyantha: 0.0076 g/kg, Salvia aethiopis: 0.0019 g/kg, and Salvia microstegia: 0.0002 g/kg.
Conclusion
In recent years, many researchers have reported on the beneficial effects of RA. There are many studies and much literature on the extraction and fractionation of RA, but we did not find a comprehensive HPLC study of this compound. Therefore, the aim of the present study was to provide an overview of the HPLC analysis of RA in Lamiaceae plants. Either liquid chromatography with spectrometric detectors or LC-MS with ESI are the most widely used techniques for quantification and structural characterization of RA. RP-C18 columns are used for liquid chromatographic separation. The mobile phase contains organic solvents, such as methanol or acetonitrile and acidified water. This review shows that many HPLC methods are available for researchers, and these techniques are indispensable for qualitative and quantitative determination of low concentrations of RA.
Footnotes
Declaration of Conflicting Interests
The author(s) declared no potential conflicts of interest with respect to the research, authorship, and/or publication of this article.
Funding
The author(s) disclosed receipt of the following financial support for the research, authorship, and/or publication of this article: This work was supported by the EFOP-3.6.2-16-2017-00012 Elaboration of functional, healthy and secure food production chain, according to the “from the farm to fork” principle—thematic research network project. The project is co-financed by the European Union and the European Social Fund.