
Abstract
Metabolite profiling can be applied as a reliable quality control (QC) tool for herbal drug preparations, especially if the specifications of the quality markers have not yet been determined. Some herbal drug preparations of Justicia gendarussa (JG), ie acidified dried crude drugs, ethanol extracts, laboratory-made granule preparations, and industrial-scale produced granules, could be clearly differentiated by using a combination of ultra-performance liquid chromatography ultra-high-resolution quadrupole-time-of-flight-mass spectrometry and multivariate analysis; unfortunately, attenuated total reflection-Fourier transform-infra-red spectroscopy could not be applied. The differences in the metabolite profiles were caused mostly by the variations in the concentrations of some fatty acid components. This work showed that classification analysis can be applied for reliable QC purposes of the J. gendarussa herbal drug preparations; the industrial-made granules of JG were located in the correct cluster of the score plot of the training set.
Justicia gendarussa Burm. f. (JG) (family Acanthaceae), also known as Gandarusa, is a traditional drug of Papua that shows an antifertility effect through competitive and reversible inhibition of the spermatozoan hyaluronidase enzyme. 1
In the frame of our long-term research work on JG herbal drugs, we recently reported 35 metabolites of the dried leaves (DS), acidified dried leaf preparations (A), 70% ethanol extract of A (E), laboratory-made granule preparations (GR), and industrial-scale granule preparations (GRK); the main phytochemicals of JG preparations were mostly fatty acids and apigenin glycosides. By visualization and t-test calculation using the Profile Analysis software, the pattern of the base peak chromatograms (BPCs) of GR, GR K, E, and A were almost the same (P = 0.97–0.99). 2
This herbal medicine has the potential to be developed into a phyto-pharmaceutical product as a nonhormonal male contraceptive drug. 3 -5 Preclinical and clinical trials have been conducted on the leaf extract of JG for its development as an herbal drug. 1,3,4,5 As the active markers of JG herbal drugs have not yet been specified, for quality control (QC) purposes a combination of metabolite profiling and multivariate analysis (MVA) was recommended 6 ; in addition, metabolite profiling could provide a better approach in comparison with a marker approach only. 7 For ensuring the reproducibility, efficacy, safety, and quality of the JG herbal drugs, all preparations at each step in the production line (A, E, and GR) must be analyzed and evaluated. As a continuation of our recent work, 2 here we report the metabolite profiling of JG herbal drug preparations using attenuated total reflection-Fourier transform-infra-red spectroscopy (ATR-FT-IR) and ultra-performance liquid chromatography ultra-high-resolution quadrupole-time-of-flight-mass spectrometry (UHPLC-UHR-QTOF-MS).
ATR-FT-IR spectra of samples GR, GR K, E, and A are shown in Figure 1. Some important peaks were observed at wave numbers (cm−1) 3285 (OH), 2916, 2849 (C-H), 1731, 1637 (C = C, C = O), and 1044 (C-O of an alcohol). A quick comparison of the results of the ATR-FT-IR spectra of samples A, E, and GR K with GR using OPUS software yielded very similar results, which were comparable with the t-test of the BPC presented in Figure 2. 2

ATR-FT-IR spectra of JG preparations.

BPC of samples GR, GR K, E, and A (modified from figure 1 of ref. 2). The BPC was evaluated using equivalent concentrations. The numbers refer to metabolites 1 to
The t-test and % correlations did not provide any measure of the size of the effect and cannot be used in isolation for experimental background information, eg the important variables that might cause either the difference or similarity of the chemical profiles. To obtain detailed data, MVA statistical analysis must be carried out (principal component analysis [PCA], partial least squares-discriminant analysis [PLS-DA], hierarchical clustering analysis [HCA]). Unfortunately, the used OPUS software was not able to perform derivative-, 2D infra-red-spectra and MVA analysis, so further evaluations using ATR-FT-IR could not be continued in this work.
PCA analysis of the UPHLC-UHR-QTOF-MS profiles (Figure 3) yielded a discrimination of samples ie Cluster I (A) and cluster II (E, GR, and GR K). The score plot of the PCA showed a closeness in pattern of the metabolite profiles of samples E, GR, and GR K; this separation was confirmed by HCA analysis (Figure 4), which showed that the pattern of metabolite profiles of GR K, GR, and E were almost similar.

PCA: Score plots of samples A, E, GR, and GR K.
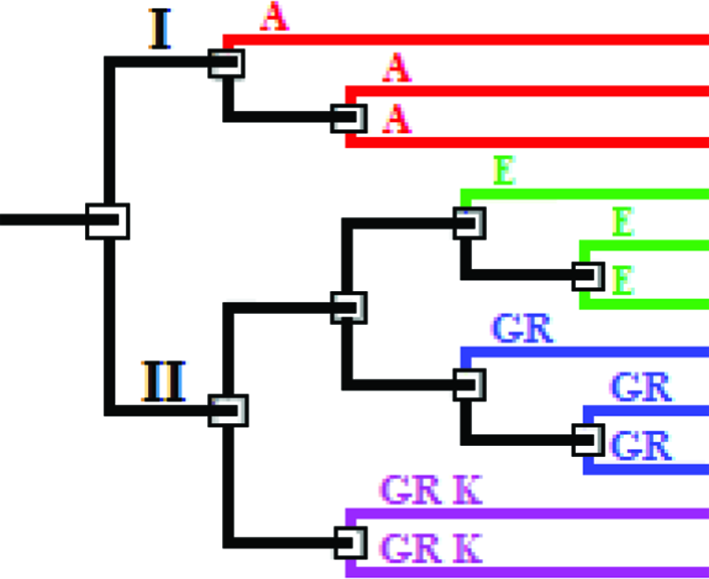
HCA of samples GR K, GR, E, and A.
In order to confirm these 2 groups that were observed in PCA and HCA, a PLS-DA analysis was performed; in this case, the LC HR-MS profiles of the 2 conditions, ie before and after extraction are discriminated (Figure 5). The PLS-DA results show more clear discrimination between the 2 clusters. The PLS-DA score plots (Figure 5a) of all the samples indicated 2 separate groups, which were comprised of cluster I ie the samples before extraction (A), and cluster II, the samples after extraction (E, GR, and GR K). This confirmed the similarity of the liquid chromatography-high resolution mass spectrometry (LC-HR MS) profiles of samples after extraction (E and GR); GR K that was industrially produced showed an identical pattern to that of laboratory-made granules GR. The score plot of PCA and PLS DA confirmed that laboratory-made GR and industrial-made GR K were phyto-equivalent to E. Loading plots (Figure 5b) showed that 9 significant metabolites (mostly fatty acid group) affected the clustering of the samples. The relative intensities or concentrations of these metabolites are presented in Figure 6. It seemed that the differentiation of the 2 clusters was caused by the difference in the intensities or concentrations of these compounds and not due to the dissimilarity of their qualitative compositions (Figure 2). Further work must be carried out to determine whether these concentration differences in fatty acids could affect the antifertility effect of the products.

PLS DA: Score plots of sample A (Cluster I), E,GR,GR K (Cluster II) (a) and loading plots (b). The red circles represent the most influenced variables (compounds).

Relative intensity of some influenced variables (compounds); data calculated by using bucket statistic (Profile Analysis software).
Metabolites
It is well known that metabolite profiling must be performed as a QC tool by the pharmaceutical industry, if quality markers have not yet been specified. 6 For this purpose, the application of classification analysis as a QC tool has been evaluated in this work. Classification of results using samples DS1, A1, E1, GR1, and GR K are summarized in Table 1 and Figure 7. The classification analysis shows that DS1.1, DS1.2, and A3 are significant off component models, while GR K1.1, GR K1.2, GR1, E1 are in model (yielding green code and group zero). The different values of distance to model (d) and distance to center (t2) are also shown in Table 1. The score plot of the classification analysis could differentiate samples of E and GR; industrial made GR K and GR1 were located in the GR cluster, while E1 was located in the E cluster. Figure 7 also confirmed that GR and E were relatively stable during 2 months of storage at room temperature. This showed that GR1 and GR K have the same chemical profiles as GR (used as standard).

Score plots of the classification analysis of samples DS1, A1, E1, and GR1 (see experimental). Red circles represent the training samples, which were used as a model.
Classification Results.

d: distance to model.t2: distance to center. Group 0 = in model; 1 = not in confidence ellipsoid; 2 = significant off model components; 3 = outside model.1,2* = number of replications of extract
These results demonstrated that classification analysis can be applied as a reliable QC tool for the herbal drug preparations, including in process QC samples, ie A and E. A metabolite profiling approach could also be applied for the QC tool of the incoming crude herbal drugs, if the quality markers are not specified. Soft Independent Modeling of Class Analogy (SIMCA), which generally is included in some MVA software, can be well applied for this classification purpose. 6,7 For determining the quality markers and their detailed specification, metabolite profiling of blood, urine, and sperm specimens of volunteers in new clinical trials should be evaluated 7 ; this work is in progress.
Experimental
Materials
JG fresh leaves were collected at Gempol-Surabaya (East Java) in the first week of July 2018. Samples were randomly collected from wild plants. Scientific identification was performed in the Department of Pharmacognosy and Phytochemistry, Airlangga University, Surabaya. A voucher sample (22/H3.1.5/DT/2018) was deposited in the department. Ammonium acetate (Sigma-Aldrich, St. Louis, Missouri, USA), formic acid (Merck, Darmstadt-Germany), methanol (Merck, Darmstadt-Germany), ultra pure water (MiliQ-Merck, Darmstadt-Germany), and pure water were of LCMS grade. Capsules of Gendarusa were provided by PT. Konimex, Solo, Indonesia. Methanol, ethanol, and formic acid (analytical reagent grade [Merck, Darmstadt-Germany]). Citric acid anhydrate (Weifang Ensign Industry, Weifang, Shandong, China), lactose monohydrate (Leprino Foods, Denver, USA), corn starch (Amylum Maydis, Cargill Bio-Chemical China, Songyuan, Jilin, China, Cab-o sil (Pluronic F-68, Sigma Life Science, St. Louis, Missouri, USA), and sodium lauryl sulfate (PT Hawwari Trading Apriansyah, Bogor, Indonesia) were of pharmaceutical grade.
Preparation of Samples
Five kilogram fresh JG leaves were sorted, washed, air-dried (DS), powdered, acidified (A), extracted using 70% ethanol, concentrated in a rotary evaporator, dried in an oven (E), and then granulated (GR). Details of the preparation of samples had already been described. 2 A, E, and GR were stored at room temperature (29 ± 3°C)
ATR-FT IR Analysis
A few milligrams of A, E, GR, and GR K samples were analyzed using ATR IR Alpha II (Bruker, Bremen, Germany). Absorption mode FTIR was applied. Correlation percentages were calculated by the quick comparison of the FT IR spectra using OPUS version 8.1. At least 3 replicates were used for each sample.
UHPLC-UHR-QTOF-MS Analysis
A Dionex Ultimate 3000 RSLC UHPLC (Dionex, Thermo Scientific, Garmening, Germany) was used, coupled with a QTOF Bruker Maxis Impact HD (BrukerDaltonik, Bremen, Germany), equipped with electrospray ionization operating in negative ion mode. Chromatographic separation was carried out using an Acclaim RSLC 120 C18 column (2.2 µm 120 Å 2.1 × 100 mm) (Dionex, Thermo Fischer Scientific, Sunnyvale, CA, USA). Mass calibration was performed using 1 mM sodium formate/acetate in 50% isopropanol with 0.2% formic acid, HCOO (NaCOOH)1 (m/z 112.9856), Ac(NaAc)1 (m/z 141.0169), and Ac(NaF)1 (m/z 127.0013). The detailed experimental conditions have been recently reported. 2
Sample Extraction and Metabolites Identification
Extraction of samples A1, E1, and GR1 was performed in the fourth week of July 2018, while extraction of samples DS and GR K (2 replications, respectively), and A, E, and GR (3 replications, respectively) was carried out in the first week of October 2018. All dried extracts were stored in a refrigerator prior to analysis. The dry extract from each sample was dissolved in an equivalent amount of MeOH, vortexed for 30 seconds, ultra-sonicated for 1 minute until dissolved completely, filtered, and 1 µL injected into the UHPLC-UHR-QTOF-MS. DS1 and A1 were obtained by diluting solutions of DS and A 10 times using MeOH. Identification of metabolites
Multivariate Analysis
PCA, PLS DA, and classification analysis were performed using Profile Analysis version 2.1 software (Bruker Daltonik). Automatic time alignment was made on retention time (RT) - m/z pairs of 1.0 to 20 minutes, mass range 100 to 1000 Da. Data were grouped automatically into buckets with RT-m/z pairs of 0.0551 minutes and m/z 24.3815 Da, with a mass tolerance of 0.05 Da, normalized with the sum of bucket values, pareto-scaled (P = 0.95), and a bucket filter of 2%, as described before. 10,11 The validation was performed using QC samples that were made by mixing 75 µL each of sample solutions A, E, and GR in one series analysis; 4 QC samples were injected for each series (2 times at the beginning, once at the middle, and once at the end of the series). The very tight clustering of QC samples in the score plot of the PCA proved the validity of this method (data not shown).
Classification Analysis
Evaluation was performed using Profile Analysis software. Samples A, E, and GR were used as the training set model. PCA-based classification was performed at a probability of α = 0.05. The results of the analyzed samples by classification analysis were grouping into 4 categories by this software (Table 2). The classification and prediction of analyzed samples were determined by using the category and its location in the score plot of the PCA of the model; the distance to model (d) and distance to center (t2) could also be determined.
Interpretation of Classification Results.

The validity of the classification was demonstrated by using cross validation. One sample of GR was removed from the model, and the new training set of PCA models was constructed without the removed sample; the removed GR sample was then used as the analyzed sample. The result showed that the analyzed sample was directly in model (Green color code, Group 0) and located in the GR cluster sample of the PCA model. This cross validation was repeated using A and E (data not shown).
Footnotes
Acknowledgments
Dr Sabu Sahadevan (Bruker, Taiwan) for technical LCMS consultation; Mr Kustiawan (Faculty of Pharmacy, Airlangga University) for performing the ATR-FT-IR; and PT. Konimex, Solo, Indonesia for providing JG capsules.
Declaration of Conflicting Interests
The author(s) declared no potential conflicts of interest with respect to the research, authorship, and/or publication of this article.
Funding
The author(s) disclosed receipt of the following financial support for theresearch, authorship, and/or publication of this article: This work “Penelitian Unggulan Fakultas SK Rektor No 886/UN3/2018” was supported by Faculty of Pharmacy, Airlangga University, Surabaya, Indonesia.