
Abstract
Thirty-five metabolites of Justicia gendarussa (JG) leaves and its preparations were identified using LC-HR-MS/MS. Although alkaloids were detected in the leaves they were not identified in JG preparations using Smart Formula 3D software. This showed that an acidified extraction process used at the first stage of the purification procedure is able to remove the toxic alkaloids from the crude drug. The LC-MS/MS analyses showed that the main components of JG preparations were fatty acids and apigenin glycosides; it seemed that the fatty acids can be used for enhancing the dissolution of the polar glycosides. T-test calculation using Profile Analysis software showed that the acidified crude drugs, extract, granules of JG, and gendarussa capsules showed very similar LC-MS/MS profiles, which means that the biochemical components of JG are relatively stable during processing. Due to the lack of quality markers for these JG preparations, the application of metabolite profiling is recommended as the QC tool for commercial production by the pharmaceutical industry.
Justicia gendarussa Burm.f. (JG), family Acanthaceae, known as Gandarusa, is found in Indonesia and also in several other countries in Asia such as Sri Lanka, India, and Malaysia. 1 JG was used in Indian folk medicines for treating many diseases such as rheumatism, bronchitis, fever, eczema, and jaundice. 2 JG has been known and used as a traditional male antifertility drug in Papua, Indonesia. 3 In vitro and in vivo antifertility tests of n-butanol fractions of JG showed that the possible mechanism was through competitive and reversible inhibition of spermatozoa hyaluronidase. 4 The anti-fertility effects might be caused by the C-glycosyl flavone group with an apigenin base structure. Apigenin and its glycoside vitexin in JG can be used for their anti-inflammatory and antitumor activities. 5 Thus, JG herbal drug has the potential to be developed into a phyto-pharmaceutical product as a nonhormonal male contraceptive. 6 -8 Capsules of JG leaf extracts have already been studied in clinical trials. 8
Four new alkaloids {brazoides A, B, C (
It is well known that variability in the constituents of herbal medicines is influenced by various external factors. It has been reported that JG leaves grown in different places show different metabolite profiles using LC-MS/MS.
10
Metabolites
JG capsules contain ethanol extracts of the crude drug, and so contain numerous compounds (primary and secondary metabolites), but unfortunately the complete identification of the metabolites in the crude drug and its preparations has not yet been reported. The therapeutic and toxicological effects of herbal drugs depend on all chemical compounds in the preparations, and that is why it is important to identify all the metabolites of JG preparations, both qualitatively and quantitatively. This present work reports the qualitative identification, using an UHPLC-UHR-QTOF-MS, of all metabolites from each stage in the production process of JG capsules, that is, dried gandarusa leaves (DS), acidified dry leaves (A), ethanol extract (E), and granules (GR).
Base peak chromatograms (BPCs) of samples of DS, A, E, GR, and granules from Konimex capsules (GR K) are shown in Figure 1. The BPCs were evaluated from equivalent concentrations of all samples, based on either sample DS or A (see the Experimental section). Based on the visual examination of the BPCs and t-test results, DS showed a very different profile pattern of metabolites, while profiles of other samples (A, E, and GR) were similar (Table 1).

Base peak chromatograms of samples. Numbers (1–36) refer to metabolites as listed in Table 2. Red numbers represent alkaloids.
. P-Value of Samples.
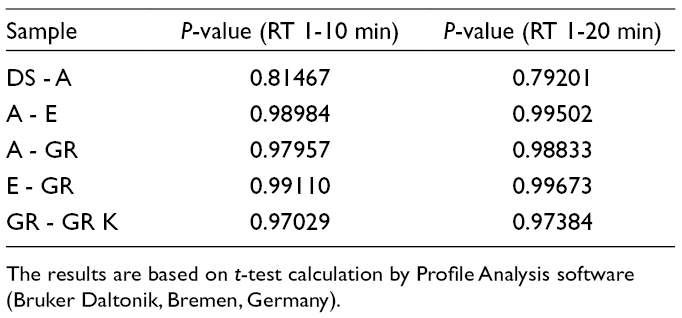
The results are based on t-test calculation by Profile Analysis software (Bruker Daltonik, Bremen, Germany).
Identified Metabolites.

Smart Formula 3D (elemental formulas were confirmed from their isotope patterns).
MetFrag (KEGG database).
MetFrag (Pubchem database).
Metfrag (Chemspider database).
DS contained either alkaloids or other nitrogen containing compounds
The presence of alkaloids
Apigenin glycosides
Although metabolites
In summary, 35 metabolites could be well identified in JG crude drugs and its preparations; chemical structures of some identified metabolites were presented in Figure 2 and metabolites

Chemical structures of some identified compounds. Numbers refer to metabolites as listed in Table 2.
Experimental
Materials
JG fresh leaves were collected at Gempol-Surabaya (East Java) in July 2018. Samples were randomly collected from wild plants. Scientific identification was performed in the Department of Pharmacognosy and Phytochemistry, Airlangga University, Surabaya. A voucher sample (22/H3.1.5/DT/2018) of the leaves was deposited in the departement. Ammonium acetate (Sigma-Aldrich, St. Louis, Missouri, USA), methanol (Merck, Darmstadt, Germany), and pure water were of LCMS grade. Capsules of Gendarusa were provided by PT. Konimex, Solo, Indonesia. Methanol, ethanol, and formic acid {analytical reagent grade (Merck, Darmstadt, Germany)}, citric acid anhydrate (Weifang Ensign Industry, Weifang, Shandong, China), lactose monohydrate (Leprino Foods, Denver, USA), corn starch (Amylum Maydis, Cargill Bio-Chemical China), Cab-O-Sil® (Pluronic F-68, Sigma Life Science, St. Louis, Missouri, USA), and sodium lauryl sulfate (PT Hawwari Trading Apriansyah, Bogor, Indonesia) were of pharmaceutical grade.
Moisture Content Determination
Moisture content (MC) of each sample was measured using a Moisture Analyzer HB43-S (Mettler Toledo, Columbus, OH, USA). The MC values listed are the average value (n = 3).
Preparation of Granules
Sample Preparation for UHPLC-UHR-QTOF-MS Analysis
Two mL MeOH containing 0.1% formic acid was added to each sample (circa 250.0 mg for DS and A; circa 100.0 mg for E; circa 200.0 mg for GR and GR K, respectively; accurately weighed). The samples were vortexed for 15 seconds, sonicated for 10 minutes, and then centrifuged at 4000 rpm for 10 minutes. The extraction process was repeated 3 times. Supernatants were collected and dried using N2. The residue (extract) was dissolved in a calculated equivalent of MeOH (for DS and A 200 µL), vortexed for 30 seconds, and ultrasonicated for 1 minute until dissolved completely, filtered and 1 µL injected into the UHPLC-UHR-QTOF-MS. Each sample was replicated at least 3 times.
Example: Calculation of the amount of MeOH for dissolving A and E that have equivalent concentrations.
For 250.0 mg DS (MC 8.36%), dry weight DS = 229.0 mg, extract DS dissolved in 200 µL MeOH (using Socorex micropipette, Ecublens, Switzerland).
Equivalent volume of MeOH for dissolving A (weight = 258.9 mg, MC 11.55%):

100.8 mg E (MC 4.68%), total weight E = 10.5307 g; total weight A = 652.0 g.
Equivalent weight of E to A:

Equivalent volume of MeOH for dissolving E:

Liquid Chromatography-Mass Spectrometry
A Dionex Ultimate 3000 RSLC UHPLC (Dionex, Thermo Scientific, Garmening, Germany) was used, coupled with a QTOF Bruker Maxis Impact HD (Bruker Daltonik, Bremen, Germany), equipped with electrospray ionization operating in negative ion mode. The capillary voltage was 2500 V, dry N2 gas flow of 8.0 L/min (200 C), nebulizer pressure 2.0 bars, end plate offset 500 V. The MS/MS analysis was performed by auto fragmentation (auto MS/MS), where the 3 most intensive peaks were fragmented. Mass Range m/z 50-1000; Quadropole ion energy was 5 EV and collision energy 10 EV (80-120%); Spectra rate: 2 Hz (MS), 2 Hz (MS/MS low), 8 Hz (MS/MS, high) total time cycle 0.9-2 s; Mass calibration was performed using 1 mM sodium formate/acetate in 50% isopropanol with 0.2% formic acid, HCOO (NaCOOH)1 (m/z 112.9856), Ac(NaAc)1 (m/z 141.0169), and Ac(NaF)1 (m/z 127.0013). Chromatographic separation was carried out using an Acclaim RSLC 120 C18 column (2.2 µm 120 Å 2.1 × 100 mm) (Dionex, Thermo Fischer Scientific, Sunnyvale, CA, USA). The mobile phase consisted of (A) 5 mM ammonium acetate in methanol (10:90 v/v), and (B) 5 mM ammonium acetate in methanol under a gradient program and flow (Table 3).
. The Mobile Phase Program and Flow.

Data Analysis, Processing, and Identification of Metabolites
Data analysis was performed using the following software: Data Analysis 4.1 (Smart Formula, Smart Formula 3D, Isotope Pattern, and Fragmentation Explorer), Profile Analysis 2.1 (t-test), Metabolite Detect 2.0 (Bruker Daltonik, Bremen, Germany), and Chemdraw Ultra 12.0.2.1047 (CambridgeSoft, Perkin Elmer Inc, Akron, OH, USA); online MS databases: MetFrag (version 2010),
15
METLIN,
17
MassBank of North America (MoNA),
18
CFM-ID.
16
The 3 most intensive molecular ions were automatically selected by auto MS/MS from each BPC peak. Only molecular ions that could be observed and detected by Smart Formula 3D were further analyzed. The proposed molecular formula was predicted using Smart Formula based on the exact mass (<5 ppm measured to calculated) and was confirmed using isotopic pattern; the fragmentation of the compound was generated using Smart Formula 3D. Verification of the MS/MS ion fragments (daughter ions) were based on their EIC. The fragmentation patterns of the compounds were evaluated by using MetFrag,
15
METLIN,
17
and MoNA.
18
All compounds (except
Footnotes
Acknowledgments
Dr Sabu Sahadevan (Bruker, Taiwan) for technical LCMS consultation; and PT. Konimex, Solo, Indonesia, for providing JG capsules.
Declaration of Conflicting Interests
The author(s) declared no potential conflicts of interest with respect to the research, authorship, and/or publication of this article.
Funding
The author(s) disclosed receipt of the following financialsupport for the research, authorship, and/or publication of this article: This work “Penelitian Unggulan Fakultas SK Rektor No 886/UN3/2018” was supported by Faculty of Pharmacy, Airlangga University, Surabaya, Indonesia.