
Abstract
Propolis is a natural material collected by honeybees, containing bioactive compounds that exhibit biological activity. The aim of this study was to assess the chemical composition of Polish propolis extracted with two different concentrations of ethanol, namely 70% and 96%, and to evaluate their antioxidant activity depending on extraction conditions. Samples of Polish propolis were extracted with 70% and 96% ethanol in order to obtain the ethanolic propolis extracts EEP70 and EEP96, respectively. Concentrations of 10 flavonoids and 6 phenolic acids were determined using the UPLC-PDA-TQD system. The antioxidant properties were determined based on the DPPH· free radical scavenging activity, Fe3+ reducing power assay, and ferrous ions (Fe2+) chelating activity assays. Moreover, the effects of the propolis extracts on human red blood cell morphology , the selective permeability of their membrane, as well as on free radicals-induced hemolysis were also assessed. Qualitative and quantitative analyses of both propolis extracts indicated that 70% ethanolic extract contained higher amounts of phenolic compounds than 96% ethanolic extract. The levels of antioxidant activity indicated that both Polish propolis extracts exhibited a high and comparable antioxidant power. The concentration of ethanol used for extraction had no effect on the antioxidant potential of propolis. The presented results indicate that the extracts of Polish propolis are rich in phenolic compounds and are very effective as antioxidant agents. Therefore, they may be applied as a constituent of products used in phytotherapy regardless of the concentration of ethanol used in propolis extraction.
Propolis is a bee product collected by them from leaves and buds of various trees and herbaceous plant species. Literature data indicate that propolis extracts from different regions possess pharmacological activity, including antifungal, antibacterial, antioxidant, antiviral, hepatoprotective, and anticancer properties. 1-7 These beneficial biological properties enable the propolis extracts to be used in traditional medicine since ancient times for the cure of many diseases. 5,8 The chemical composition of raw propolis is very complex and depends on numerous factors, including botanical origin, solvent used in extraction, and the time of collection. 1,4,9-12 More than 300 different chemical compounds have been identified in propolis samples collected from various geographical regions. 7 Among all the groups of chemical compounds, phenols (flavonoids, phenolic acids, and their esters) are regularly determined in propolis samples collected from different sources and are major bioactive constituents of this material. 1,13-23 Phenols possess biological properties including ability in scavenging reactive oxygen species, which are responsible for majority of the diseases, such as various types of cancer, diabetes, or cardiovascular diseases. 24,25 The chemical composition and biological activities of propolis have been determined in its extracts obtained using diverse solvents, including methanol, acetone, chloroform, or ethanol in different concentrations. 10,11,13,26 Literature date indicate that the concentration of ethanol used in propolis extraction has influence on phenolic profile and antimicrobial and antioxidant activities. 1,10,11,27 Moreover, the scientific reports described results of studies carried out in order to correlate content of phenolic compounds in propolis with its antioxidant potential. 11,12,27
The aim of this study was to assess the chemical composition of Polish propolis extracted with two concentrations of ethanol, namely 70% and 96%, and to evaluate their antioxidant activity in both cell-free and cell-based systems, depending on extraction conditions.
Concentrations of flavonoids and phenolic acids in the propolis extracts prepared in ethanol applied at two different concentrations (70% and 96%) are presented in Table 1. The EEP70 contained higher amounts of all examined phenols than the EEP96, which was confirmed by statistical analysis, also shown in Table 1. Pinocembrin was the most abundant compound among flavonoids found in both propolis extracts. Its concentration in both Polish propolis extracts was higher than in extracts of propolis collected from Italy, Argentina, or Spain. 28,29 High concentrations, especially in EEP70, were also recorded for galangin, chrysin, apigenin, and kaempferol, previously reported in propolis samples collected from various regions of Poland. 14,16,19,30 The concentration of apigenin and kaempferol in both examined extracts was higher than in propolis extracts from Italy, Spain, and China. 28,29 The concentration of chrysin in Italian propolis extracts (4.38-4.56 mg/mL) was higher than in EEP96 and comparable to concentration in EEP70. 29 Among the examined phenolic acids coumaric acid was found in the largest amounts in both extracts, amounting to 2.11 mg/mL in EEP70 and 1.81 mg/mL in EEP96, respectively, and its concentration was higher in both extracts than in propolis extracts from Italy (0.21 mg/mL). 28 Cinnamic acid was also found in considerable amounts in both propolis extracts. All the examined acids were previously identified in propolis samples collected from Poland and other European countries, for example Greece, Slovenia, or Italy. 2,14,16,17,19,30 The chemical composition of Polish propolis extracts prepared in 70% and 96% ethanol suggests that aqueous ethanol is a better solvent for extraction of phenolic compounds, especially flavonoids from raw propolis, which was confirmed by statistical analysis. Mavri et al 2 stated that propolis extract obtained using 70% ethanol as the extraction solvent contained higher amounts of flavonoids and phenolic acids than the propolis extract prepared by extracting the material with 96% ethanol. Also, other literature data confirmed that the concentration of ethanol used in propolis extraction influences its phenolic profile. 10,11
Concentration of Phenols in Propolis Extracts.

nd, not detected.
Values in the same row followed by the same letter are not significantly different by Tukey’s honest significant differences test (P < 0.05).
The results of antioxidant properties of the propolis extracts obtained from the material extracted with 70% and 96% ethanol using three different cell-free antioxidant assays and in vitro red blood cell (RBC)-based assays are presented in Tables 2 and 3, respectively.
The Results of Antioxidant Activity of the Propolis Extracts at the Concentration Equal to 0.1 mg/mL.

Ab, absorbance; BHT, butylated hydroxyltoluene.
Values in the same column followed by the same letter are not significantly different by Tukey’s honest significant differences test (P < 0.05).
The Effect of Propolis Extracts on Hemolysis and Oxidative Hemolysis Protection at the Concentration Equal to 0.01 mg/mL.

x, no hemolysis activity according to 31 ; hemolysis value less than 5% means no hemolytic activity. Values in the same column followed by the same letter are not significantly different by Tukey’s honest significant differences test (P < 0.05).
Both propolis extracts exhibited scavenging activity comparable to the standard antioxidant butylated hydroxyltoluene (BHT). Moreover, the extracts were characterized by similar reducing potential equivalent to approximately 80% value obtained for BHT and around 65% of that determined for Trolox. The propolis extracts possessed the ability to chelate Fe2+ equal to approximately 50% value of the standard chelator EDTA. The presented results are in line with those obtained by other that propolis collected from different regions (eg, Argentina, Greece, or China) possesses the high antioxidant activity. 3,13,17 Both extracts exhibited a similar antioxidant potential, which was confirmed by statistical analysis presented in Table 2. In contrast to the presented results, literature data indicate that the concentration of ethanol used for extraction influences the DPPH· free radical scavenging activity and Fe3+ reducing power assay of propolis extracts. 2,10,11
Neither hemolysis (Table 3) nor significant changes in the shape of discoid human RBCs (Figure 1) were observed for the extracts at a concentration up to 0.1 mg/mL. Moreover, effective protection of RBCs against AAPH-induced hemolysis was detected (Table 3). It should be stressed that both propolis extracts exhibited statistically similar antioxidant activities in three cell-free assays and in the cell-based AAPH assay. Additionally, the capacity of both extracts to protect RBCs from AAPH-induced oxidative hemolysis was higher than observed for standard BHT and comparable to Trolox.
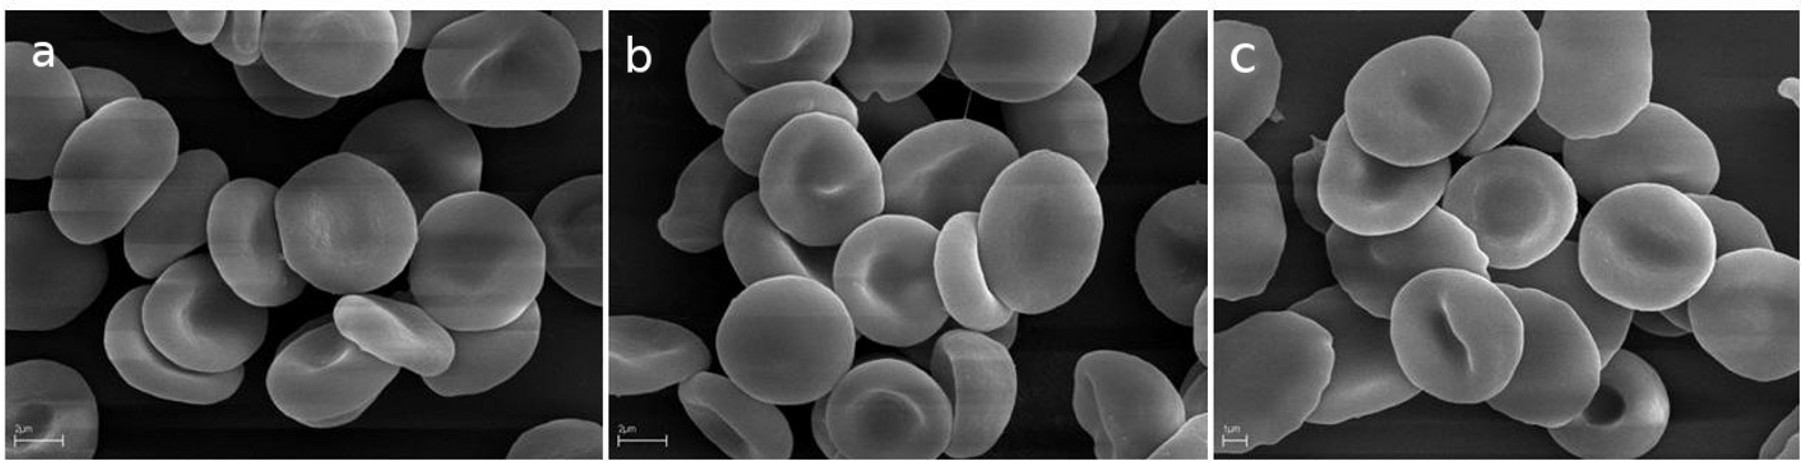
The effect of (a) phosphate-buffered saline (control), (b) EEP70, and (c) EEP96 at 0.1 mg/mL for 1 hour at 37°C on human RBC morphology as observed by scanning electron microscope. The microphotographs show representative data for four independent experiments. Scale bars indicate 2 µm (a and b) and 1 µm (c), respectively. RBC: red blood cell.
The results presented in this study showed that the concentration of phenolic compounds (flavonoids and phenolic acids) in propolis extracts depends on the concentration of ethanol used in the extraction process. Extraction in 70% EtOH was more efficient than in the less polar 96% EtOH. On the other hand, the presented results did not confirm the statement described in the literature that the antioxidant activity of propolis extracts depends on the ethanol-water ratio in the extraction solvent. Both propolis extracts (EEP70 and EEP96) possessed high and similar antioxidant potential. Nevertheless, the results suggest that the propolis compounds are very effective as antioxidant agents. It may be concluded that Polish propolis may be applied as a constituent of products used in phytotherapy, which can protect RBCs against free radicals’ detrimental effects.
Experimental
Propolis Sample and Preparation of Propolis Extracts
Raw propolis was collected in June 2014 from an apiary located in the protected area of the Landscape Park in Wielkopolska Province, Poland. The sample was harvested from propolis traps and was frozen at −20°C until processing. Next the propolis sample was cut into small pieces and extracted with a 10-fold volume of 70% ethanol (v/v) or 96% ethanol, under shaking (Biosan, Riga, Latvia) for 5 days, in order to obtain two ethanolic propolis extracts, namely EEP70 and EEP96, respectively. After extraction each solution was concentrated on a rotary evaporator (BUCHI Labortechnik AG, Flawil, Switzerland) until constant weight and stored at -20°C until chemical and biological analyses.
Reagents
The reagents for preparation of propolis extracts and in antioxidant assays (ethanol, dimethyl sulfoxide, phosphate-buffered saline (PBS) buffer compounds [NaCl, KCl, Na2HPO4 and KH2PO4], glucose, glutaraldehyde, paraformaldehyde, glycerol, FeCl2, K3Fe(CN)6, FeCl3, and OsO4) were purchased from Avantor Performance Materials Poland SA (Gliwice, Poland). The water used in the study was of Milli-Q quality. The solvents for chromatographic analysis (formic acid, acetonitrile, and methanol) were of high-performance liquid chromatography grade and purchased from Sigma Aldrich Chemie GmbH (Steinheim, Germany). The standards of phenolic compounds for Ultra Performance Liquid Chromatography (UPLC) analysis (apigenin, chrysin, galangin, kaempferol, myricetin, naringenin, pinobanksin, pinocembrin, quercetin, rutin, caffeic acid, coumaric acid, ferulic acid, cinnamic acid, chlorogenic acid, and vanillic acid) and the standard antioxidants, Trolox, BHT and 2,2-diphenyl-1-picrylhydrazyl (DPPH), 2,2'-azobis(2-methylpropionamidine) dihydrochloride (AAPH), ferrozine, poly-L-lyzine, EDTA, and trichloroacetic acid, were purchased from Sigma Aldrich Chemie GmbH (Steinheim, Germany). The gases (argon and nitrogen) used in chromatographic analysis above 99% purity.
Identification of Phenolic Compounds in Propolis Extracts
In the propolis extracts the concentrations of selected flavonoids and phenolic acids were determined using a UPLC-PDA-TQD system. The analytical system consisted of the Aquity UPLC chromatograph (Waters, Manchester, MA, USA) equipped with a photodiode detector (PDA eλ Detector) (Waters, Manchester, MA, USA) and coupled to an electrospray ionization triple quadrupole mass spectrometer (TQD) (Waters, Manchester, MA, USA).
All samples of propolis extracts were filtered through a 0.20 µm syringe filter (Chromafil, Macherey-Nagel, Duren, Germany) before analyses. The compounds were separated at 25°C on the analytical column—a Waters ACQUITY UPLC HSS T3 (150 × 2.1 mm/ID, with 1.8 µm particle size) (Waters, Manchester, MA, USA). Gradient elution was applied using water containing 0.1% HCOOH (a) and acetonitrile containing 0.1% HCOOH (b) with the flow rate 300 µL/min. The solvent gradient was modified as follows: 0-5 minutes 25% B, 5-20 minutes 40% B, 20-30 minutes 60% B, 30-35 minutes 90% B, 35-40 minutes 100% B followed by the return to the initial conditions. The collision-induced decomposition was run using argon as the collision gas, with a collision energy of 25-40 eV. Multiple reaction monitoring was used for quantitative analysis of compounds. The analytes were identified by comparing the retention times and m/z values obtained by MS and MS2 with the mass spectra of the corresponding standards tested under the same conditions (Table 4). All samples were injected in triplicate.
Mass Spectrometry Parameters for Multiple-Reaction-Monitoring Transmisions in the Positive and Negative Ion Mode Monitoring.

Antioxidant Assays
The antioxidant potential of the propolis extracts at a concentration of 0.1 mg/mL was determined based on three cell-free assays, namely the DPPH· free radical scavenging activity, Fe3+ reducing power assay, and ferrous ions (Fe2+) chelating activity, according to method described by Malczewska-Jaskóła et al. 31
DPPH· Free Radical Scavenging Activity
The solution of DPPH· at a concentration of 0.1 mM (0.2 mL) was mixed with propolis extracts and after incubation in the dark for 30 minutes at room temperature (RT), the absorbance (Abs) was measured at 517 nm in an EPOLL 2000 ECO spectrophotometer (PZ EMCO, Warszawa, Poland). The percentage DPPH· scavenging effect was calculated using the following equation:

where Abs0 is absorbance of the control sample and Abs1 is the absorbance in the presence of samples tested. Each sample was made in triplicate and three independent experiments were performed. Trolox and BHT were used as the reference compounds.
Fe3+ Reducing Power Assay
The propolis extracts were mixed with 0.1 mL of 0.2 M PBS and 0.1 mL of 1% K3Fe(CN)6. After incubation (20 minutes at 50°C) 10% trichloroacetic acid (0.1 mL) was added to the examined samples. Finally, 0.6 M FeCl3 (0.04 mL) was mixed with the propolis extracts and the absorbance at 700 nm in an EPOLL 2000 ECO spectrophotometer (PZ EMCO, Warszawa, Poland) was measured. Each sample was made in triplicate and three independent experiments were performed. Trolox and BHT were used as the reference compounds.
Ferrousion (Fe2+) Chelating Activity
The propolis extracts (0.2 mL) were mixed with 0.6 mM FeCl2 (0.05 mL). After addition of 5.0 mM ferrozine (0.05 mL), the examined samples were stored for 10 minutes at RT and following the absorbance at 562 nm in an EPOLL 2000 ECO spectrophotometer (PZ EMCO, Warszawa, Poland) was measured. Each sample was made in triplicate and three independent experiments were performed. EDTA was used as the standard metal chelator. The percentage of inhibition of ferrozine-Fe2+ complex formation was calculated using the following equation:

where Abs0 is absorbance of the control sample and Abs1 is absorbance in the presence of the samples tested. Each sample was tested in triplicate and three independent experiments were performed.
In Vitro Effects of Propolis Extracts on Human Red Blood Cells
The hemolytic activity of propolis extracts up to a concentration of 0.1 mg/mL and their effects on RBC shape in vitro were evaluated according to the method described by Malczewska-Jaskóła et al. 31 Briefly, RBCs (1.65 × 10⁸ cells/mL, ~1.5% hematocrit) were incubated in PBS (7.4 pH) supplemented with 10 mM glucose, and containing the propolis extract in different concentrations (up 0.1 mg/mL) for 60 minutes at 37°C in a shaking water bath. Samples with RBCs incubated in PBS without compounds tested were taken as the controls. Each sample was repeated three times and the experiments were repeated four times with RBCs from different donors. After incubation, RBC suspensions were centrifuged (3000 rpm, 10 minutes) and the degree of hemolysis was estimated by measuring the absorbance of the supernatant at 540 nm in a spectrophotometer. The results were expressed as percentage of hemolysis. Hemolysis 0% was taken as the absorbance of the supernatant of erythrocyte suspensions in PBS only, while the total hemolysis (100%) was determined when PBS was replaced by ice-cold distilled water. To analyze the RBC shape under compounds treatment, cells were fixed in 0.1% glutaraldehyde for 1 hour at RT. Fixed cells were washed by exchanging the supernatant with PBS. The samples were gently vortexed and cells were fixed with 2% glutaraldehyde for another hour at RT. After washing as above, RBCs were postfixed with 1% OsO4 for 30 minutes at RT. The supernatant was exchanged with PBS and samples were very gently vortexed. Fixed RBCs were dehydrated in a series of ethanol solution (50%, 60%, 70%, 80%, 90%, 95%, and 100%), gold-sputtered, and examined in a EVO 40 (ZEISS, Germany) scanning electron microscope.
The protective activity of propolis extracts at the concentration of 0.01 mg/mL, against AAPH-induced hemolysis was evaluated according to the method described by Malczewska-Jaskóła et al. 31 Briefly, RBCs (1.65 × 10⁸ cells/mL, ~1.5% hematocrit) were preincubated in PBS (pH 7.4) supplemented with 10 mM glucose in the presence of compounds tested at the concentration equal to 0.01 mg/mL for 20 minutes at 37°C in a shaking water bath. After preincubation, 2,2′-azobis(2-methylpropionamidine) dihydrochloride (AAPH) was added at the final concentration equal to 60 mM. Samples were incubated for next 4 hours at 37°C in a shaking water bath. RBCs incubated in PBS only and in the presence of AAPH were taken as the controls. After incubation, RBC suspensions were centrifuged (4000 rpm, 5 minutes, +4°C), and the degree of hemolysis was determined by measuring the absorbance (Abs) of the supernatant at 540 nm in a spectrophotometer. The percentage of inhibition was calculated using the following equation:

where Abssample is the absorbance value of the supernatant obtained from samples incubated with samples tested, Absblank is the absorbance of supernatant obtained from samples without sample tested and AAPH, and Abscontrol is the absorbance of supernatant obtained from samples with AAPH and in the absence of sample tested. Each sample was made in triplicate and the results are presented as a mean value (±SD) of four independent experiments with RBCs from different donors.
Statistical Analysis
The results were analyzed using one-way analysis of variance (ANOVA) applying Tukey’s honest significant differences test. Statistical significance was defined as P < 0.05. All the statistical analyses were performed using TIBCO Software Inc. Statistica version 13 (Palo Alto, CA, USA).
Footnotes
Declaration of Conflicting Interests
The author(s) declared no potential conflicts of interest with respect to the research, authorship, and/or publication of this article.
Funding
The author(s) declared no financial support for the research, authorship, and/or publication of this article.