
Abstract
Propolis is a natural product derived from plant resins collected by honeybees and used in the beehive as a construction and defensive material. The broad spectrum of biological activities is dependent on the chemical diversity of its composition which is determined by the floral sources at the site of collection. For the first time, the chemical composition of Guinean propolis as well as its physicochemical properties, phenolic composition, and antioxidant activity was assessed. Eight compounds were identified through LC/DAD/ESI-MS n , mostly isoflavonoids, resembling Nigerian and Brazilian red propolis from the genus Dalbergia.
Propolis is a chemically complex resinous substance collected by honeybees from tree buds, comprising plant exudates, secreted substances from bee metabolism, pollen, and waxes. 1 This product is widely used in traditional medicine and as a health food supplement. 2 The chemical composition is highly variable, depending strongly on the phyto-geographic conditions at the site of collection. In temperate regions the most frequently reported components in propolis are flavonoids and phenolic acid esters, 3 whereas p-coumaric acid prenylated derivatives and isoflavonoids are abundant in Brazilian green and red propolis, typical of tropical areas. 1,4 The territory of Guinea-Bissau, situated on the west coast of Africa, contains different types of natural vegetation with emphasis on the rich forest, dry forest, mangroves, and savanna, distributed throughout the country, 5 which could be a rich source of resins for the production of propolis. The increased use of propolis in preparations for therapeutic purposes as well as biological activity studies makes the qualitative and quantitative characterization of its constituents a priority. 6
This work presents the chemical composition and antioxidant activity of Guinea-Bissau propolis, produced under modern beekeeping technologies. Until now, only honey has been described for this western African country, 7 and so, this is the first study ever on Guinea-Bissau propolis. Therefore it is relevant to identify the quality and authenticity parameters, and so contribute to the improvement of the production procedures. 7
Propolis color is an important parameter for the commercialization, which can be different according to its botanical origin and age. 8 The CIELAB color system is a rapid methodology which was previously developed for the determination of the color index in propolis. 8 Analyzing the different components, lightness (L*) showed a value of 36 which is considered high, revealing a lighter sample. The chromatic component a* pointed to a red tone, with a value of 5, whereas the component b* with a positive value of 15 revealed a yellow tone. The color density C*ab, which determines the brightness of the sample showed a lower value of 20, which means a fade coloration of Guinean propolis. Overall, the results indicated a light brown color, in accordance with the visual observation (Table 1).
Physicochemical Parameters, Phenolic Content, and Bioactivity in the Hydro-Ethanolic Extracts of Guinea-Bissau Propolis.

DPPH, 2,2-diphenyl-1-picrylhydrazyl.
The water content, which is affected by manipulation conditions and length of storage, showed a result of 4%, below the 8% suggested for tropical propolis 9 and even the 5% maximum recommended for temperate propolis. 8 The ash content reflects the sample mineralization and the presence of impurities resulting from the production process. This propolis present a content of 4%, which is above the maximum recommended for raw Brazilian green propolis 9 or the 2% described for the temperate poplar type propolis. 9,10 Regarding the wax content, the sample showed a value of 38%, above the maximum proposed for both poplar and green propolis. 10
The amount of wax can be related not only to the bee specie and plants found around the hive but also with the collection method (which was through conventional scraping), the state of the bee colony, and the production season. 8 This higher content of waxes, which are biologically inert, indicates lower percentage of bioactive compounds and thus affecting the commercial value of the product. The full results for the physicochemical parameters of propolis can be checked on Table 1.
The commercial value of propolis is often associated with its balsamic content which links to the phenolic composition of the sample after the hydro-alcoholic extraction. Propolis from Guinea-Bissau showed a value less than 30%, below the minimum value of 45% proposed for poplar propolis or the minimum of 35% defined for tropical propolis, 8,10 probably justified by the high percentage in waxes. The phenolic content, determined by spectrophotometric procedures, showed a low value of 2.5%, much below the minimum defined for poplar and green propolis 10 and below the 6% proposed for Portuguese propolis with poor phenolic content. 8 Also the flavones/flavonols and flavanones/dihydroflavonols present low values of 0.07% and 1.8%, respectively, well below those defined for poplar and green propolis (Table 1). 8,10 It is evident that this Guinean propolis pattern is different from other propolis samples described in the literature and is indicative of a different typology of bioactive compounds. Substances such as terpenes found in Mediterranean propolis, 11,12 sugar, and organics acids may account for the composition of the balsamic extract. 13 The antioxidant activity of the Guinean propolis was evaluated through 2,2-diphenyl-1-picrylhydrazyl free radical (DPPH·)-scavenging activity and reducing power, with the sample presenting an EC50 value and reducing power of 0.14 mg mL-1 and 90 mg eq g-1, which reflects the low content of phenolic compounds.
Following the differences observed on the phenolic composition accessed by the spectrophotometric analysis, a more exhaustive characterization was made through liquid chromatography/diode array detector/electrospray ionization-mass spectrometry (LC/DAD/ESI-MS n ) of the hydro-ethanolic extract, which allowed the elucidation of the phenolic compounds by comparison of their chromatographic behavior, UV spectra, and MS information with reference compounds. When standards were not available, the structural information was confirmed with UV data combined with MS fragmentation patterns previously reported in the literature. For MS analysis, ESI negative ion mode was selected because it easily provided extensive information for the different polyphenol classes. 8 The LC-MS data and chromatographic profile are shown in Table 2.
Identification and Quantification of Phenolic Compounds From Guinea-Bissau Propolis by LC/DAD/ESI-MS n .

LC/DAD/ESI-MS, liquid chromatography/diode array detector/electrospray ionization-mass spectrometry.
aConfirmed with MS n fragmentation.
bConfirmed with references: 15.
c16.
d17.
eExpressed as chrysin equivalent.
fExpressed as pinocembrin equivalent.
Overall, through this analysis it was possible to tentatively identify 8 compounds, all of which are isoflavonoids. Isoflavonoids are mostly found in the subfamily Papilionoideae of the Leguminosae. Four different subclasses were found in this sample, including isoflavones, pterocarpans, isoflavans, and isoflavanones. The comparison of the ESI-MS/MS data with that described in the literature allowed the identification of 4 isoflavones: isoflavone-C-glycoside (
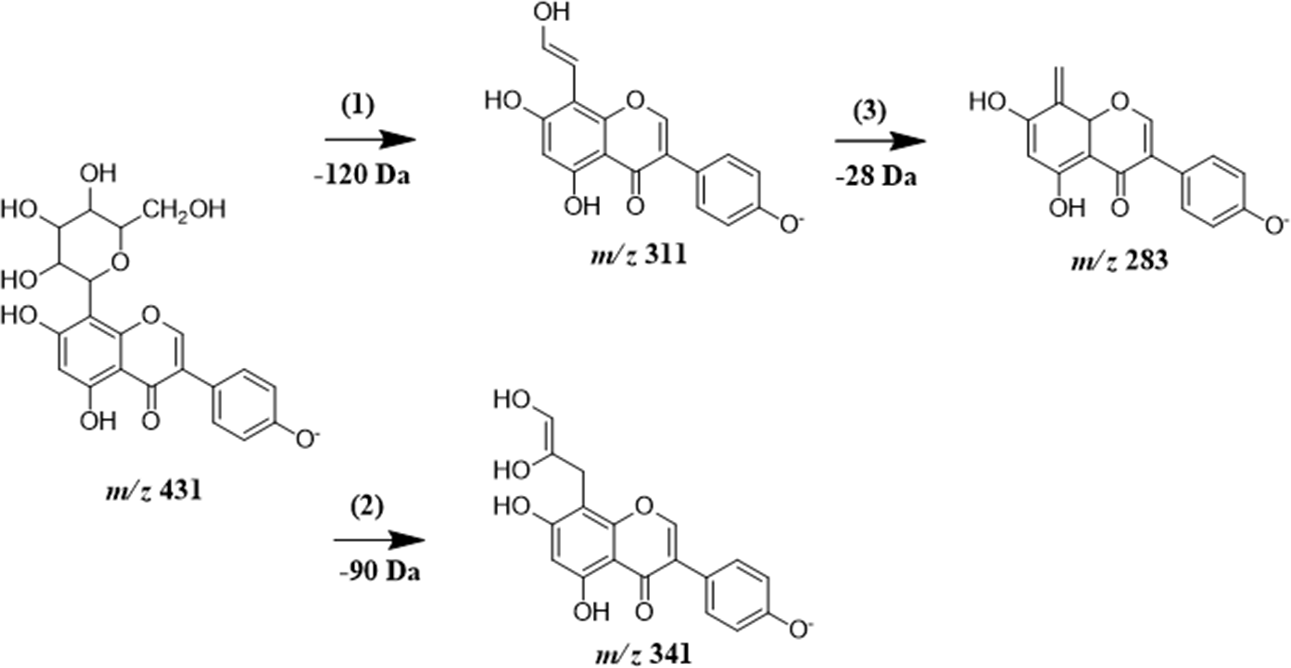
Proposed fragmentation pathways of deprotonated genistein-C-glycoside.
The UV spectrum was equivalent to that of isoflavones with a UVmax in the 257 to 262 nm range arising from the location of the B-ring at C3 preventing the conjugation of the phenyl group with the pyrone carbonyl group.
14
The isoflavone-C-glycosides demonstrated a common fragmentation pattern, with a main product ion resulting from the loss of 120 Da, which is indicative of a sugar substituent bonded to a carbon of the aglicon, generally at position C6 or C8.
15
This was observed for compounds
Finally, compound
For quantification and considering the unavailability of the specific compounds, the amount was achieved using calibration curves of structurally closest phenolic compound, with similar UV spectrum: chrysin for compounds
Overall, Guinean propolis revealed a rich composition of isoflavones, isoflavanones, isoflavans, and pterocarpans, in which some compounds are similar to that of Nigerian propolis 18 and Cuban and Brazilian red propolis, 19 with origin in plants from genus Dalbergia. Phytochemical research of this genus has isolated different groups of compounds including isoflavonoids, neoflavonoids, glycosides, cinnamylphenols, quinones, furans, and other compounds. 20 This plant source is found in Guinea-Bissau, mostly Dalbergia boehmii and Dalbergia saxatilis, and thus is probably a contributor for this bee glue. Furthermore, for a complete characterization of Guinean propolis, more samples and the use of more advanced techniques of structural analysis such as NMR would be needed.
Experimental
General
Folin-Ciocalteu’s reagent was from Panreac (Barcelona, Spain). Aluminum chloride, potassium ferricyanide, ferric chloride, trichloroacetic acid, and DPPH were from Sigma Chemical Co. (St Louis, MO, USA) and 2,4-dinitrophenylhydrazine from Fluka (Buchs, Switzerland). All chemical standards were high-performance liquid chromatography (HPLC)-grade pure, and the common phenolic compounds were obtained from Sigma Chemical Co. HPLC-grade methanol, ethanol, and acetonitrile were purchased from Fisher Scientific (Leics, UK). Water was treated in a Milli-Q water purification system (TGI Pure System, Houston, TX, USA).
Propolis Origin
Propolis was obtained by scratching the frames and walls of Kenyan top-bar hives from local beekeepers in Bula region, located in the Western part of Guinea-Bissau. After reception at the laboratory, propolis was stored at –20°C.
Physicochemical Parameters
Physicochemical parameters such as water, ash, wax content, and color parameters (L*, a*, b*) were determined according to the methods described in the literature. 8 Colors were measured on a Minolta colorimeter CR-400 (Osaka, Japan) with a standard white plate used to calibrate the colorimeter (L* = 94.56, a* = -0.31, b* = 4.16, C∗ ab = 4.18, and hab = 94.3). CIE 1931 2° observer and illuminant C were considered as references in the measurements.
Phenolic Compounds Extraction
The phenolic compounds were obtained through a hydro-ethanolic extraction procedure. 4 Briefly, 1 g of sample was mixed with 10 mL of 80% of ethanol/water and kept at 70◦C for 1 hour under stirring. The resulting mixture was filtered and the extraction was repeated in the same conditions. Finally, the resulting extracts were combined, concentrated, and freeze-dried. The result was expressed in percentage as propolis balsamic content.
Spectrophotometric Determination of Phenolic Compounds
The total phenolics, flavone/flavonol, and flavanone/dihydroflavonol contents were measured by spectrophotometry according to previously described methodology, 8 using as calibration standards the mixture caffeic acid:galangin:pinocembrin (1:1:1) (0.01-3 mg mL–1; y = 4.7439x + 0.0737; R2 = 0.999), galangin (0.002-0.05 mg mL–1; y = 18.144 x +0.0112; R2 = 0.995) and pinocembrin (0.2-6 mg mL–1; y = 0.1169x + 0.0176; R2 = 0.998), respectively.
Antioxidant Activity
The antioxidant activity of the propolis extract was determined by the ability to block DPPH free radical and its reducing power, evaluated according to the methods described previously in the literature. 8
LC-DAD-ESI-MS n Analysis
The LC/DAD/ESI-MS n analyses were performed on a Dionex Ultimate 3000 UPLC instrument (Thermo Scientific, San Jose, CA, USA) equipped with a diode array detector and coupled to a mass detector. The HPLC was run on a Macherey-Nagel Nucleosil C18 column (250 mm × 4 mm id; 5 mm particle diameter, end-capped) and its temperature was maintained at 30°C. The LC conditions used were according our previous work. 4 The flow rate was 1 mL min–1, with an injection volume of 20 µL. Spectral data for all peaks were accumulated in the range 190 to 600 nm.
The mass spectrometer was operated in the negative ion mode using Linear Ion Trap LTQ XL mass spectrometer (Thermo Scientific) equipped with an ESI source. Typical ESI conditions were nitrogen sheath gas 75 psi, spray voltage 5 kV, source temperature 325°C, and capillary voltage. The full scan covered the mass range from m/z 50 to 1000. The MS n data were simultaneously acquired for the selected precursor ion. The collision-induced decomposition–MS-MS and MS n experiments were performed using helium as the collision gas, with a collision energy of 25 to 35 (arbitrary units). Control and data acquisition was carried out with Xcalibur® data system (Thermo Scientific).
The quantification was achieved using calibration curves of structurally closest phenolic compound, with similar UV spectrum. For compounds
Footnotes
Acknowledgements
Soraia I. Falcão thanks FCT for the Post-Doc grant SFRH/BPD/118987/2016. The authors thank project EuropeAid/128139/L/ACT/GW “Valuing Beekeeping in the regions of Bafatá and Gabú: production, processing and marketing.” They also thank the “Associação de Apicultores do Leste da Guiné Bissau” for the propolis.
Declaration of Conflicting Interests
The author(s) declared no potential conflicts of interest with respect to the research, authorship, and/or publication of this article.
Funding
The author(s) disclosed receipt of the following financial support for the research, authorship, and/or publication of this article: Foundation for Science and Technology (FCT, Portugal) and FEDER under Programme PT2020 for financial support to CIMO (UID/AGR/00690/2013).