
Abstract
Background:
Suboptimal inpatient glycemia is associated with adverse outcomes, including infection, length of stay, and hospitalization costs. Interventions to improve inpatient glycemia may benefit from standardization of in-hospital glycemic measurement and reporting.
“Glucometrics,” as coined by Goldberg et al (2006), proposes models and metrics that allow quantitative inpatient glycemic data analysis. This systematic review investigates the actual use of “glucometric” terminology and its derivations since conception.
Methods:
Original research articles on “glucometrics” and its derivations in inpatient contexts, published between 2006 and 2023, were searched in five databases. Studies were screened and extracted through PRISMA-compliant review software (Covidence®) and systematically reviewed.
Results:
Of 767 studies identified, 44 were included for final review. Study settings included non-critical care wards (n=19), critical care (n=6), and both (n=13). Of the Goldberg models, “patient-day” was most used (n=33). Most studies (n=30) referred to “glucometrics” per the original description. An increase in the introduction of new metrics (e.g., time-weighted averages, adverse glycemic days, and glucose excursions) was seen over the study period, as well as an increase in the use of “glucometric” to refer to glycemic measurement/reporting in general.
Significant variation in thresholds defining hyperglycemia/hypoglycemia existed between studies, where hyperglycemia ranged between 140 and 432 mg/dL (most commonly 300 mg/dL), while the hypoglycemia ranged between 40 and 70 mg/dL (most commonly 70 mg/dL).
Conclusion:
This systematic review provides insights into contemporary use of glucometric terminology, highlighting the lack of consensus on a standardized approach toward analyzing inpatient glycemia, and the need for glucometric harmonization to improve inpatient glycemia and diabetes care.
Introduction
In the United States, approximately a quarter of hospitalized adults have diabetes, with prevalence rising by 2.5% annually between 2000 and 2018. 1 Blood glucose (BG) abnormalities increase risks of infection, mortality, and longer hospital stays, driving up costs.2-5 Certain groups, such as those with acute coronary syndrome, strokes, community-acquired pneumonia, or undergoing surgery, are at higher risk of hyperglycemia. 6 Diabetes and hyperglycemia prolong hospital stays and increase costs.7,8 Effective hospital glucose management improves clinical outcomes, and reduces diabetes-related morbidity and costs to health care systems.8,9
Optimizing inpatient diabetes care requires effective methods for monitoring and reporting glycemia. While outpatient monitoring with hemoglobin A1c (HbA1c) and continuous glucose monitoring (CGM) is well-established,10-12 no universal metric exists for assessing inpatient glycemic status during short hospital stays. This limits quality assessments, evaluation of inpatient quality improvement initiatives, and benchmarking between institutions.2-4,11,13-16
In 2006, Goldberg et al proposed “glucometrics,” which refers to standardized methods of analyzing inpatient blood glucose data and tracking glycemia over time. 13 Such methods, once validated and widely used, allow objective comparisons between institutions, as well as within institutions over time. 13
For glucometric comparisons, Goldberg et al proposed three distinct units of analysis pertaining to mean glucose metrics, each with advantages and disadvantages. The first is by “population,” where all BG levels of an inpatient population are grouped, but heavily influenced by the frequent BG testing in cases with hyperglycemia or hypoglycemia. The second, the “patient-stay” model, aggregates BG results for individual patients over their hospital stay into a single mean value. Lastly, the “patient-day” model groups BG results by each patient and for each calendar day of the admission, minimizing the impact of length of stay and testing frequency.
The potential of glucometrics has been extensively explored, and its meaning has expanded since the original description, especially with increase in evidence for the negative effects of in-hospital adverse glycemia. The increased use of terminology in different contexts and the variability in meanings complicate efforts for more widespread use of glucometrics in the hospital setting.
The primary aim of this systematic review was to evaluate how “glucometric” concepts and terminology have been used in the published literature between 2006 and 2023 compared to the original description by Goldberg et al.
Methods
This qualitative systematic review was conducted according to the Preferred Reporting Items for Systematic Reviews and Meta-Analyses (PRISMA) 2020 guidelines. 17 The review protocol was prospectively registered (https://doi.org/10.17605/OSF.IO/5TNMR). The PRISMA checklist is provided in the Supplementary Materials (Supplementary 1).
Eligibility Criteria
This review included studies applying glucometric concepts in the inpatient setting. The types of studies included were original research articles, including interventional and observational studies. Reviews, perspective articles, conference abstracts or other non-experimental papers were excluded. The search was limited to papers published in English, with full text articles obtained through institutional access methods.
Information Sources and Search Strategy
To identify eligible studies, we performed a search of five electronic databases (PubMed, OVID, Medline, Web of Science, and Cochrane Library) from January 1, 2006, to August 15, 2023. Free-text keyword search terms were combined with the Boolean operators “OR” and “AND.” The final search strategy used was: (inpatient OR in-patient OR ward) AND (glucometric OR glucometrics OR gluco-metric OR gluco-metrics OR “patient-day mean glucose” OR “patient-days mean glucose” OR “patient-stay mean glucose” OR “patient-stays mean glucose” OR “patient-day-weighted mean glucose” OR “mean glucose” OR “adverse glycaemic day” OR “adverse glycemic day”). The detailed search strategy is presented in the Supplementary Materials (Supplementary 2).
Selection Process
Two investigators (JWSY and RW) independently reviewed studies using PRISMA-compliant eligibility forms in Covidence software (Veritas Health Innovation, Melbourne, Australia). Any discordance was resolved through seeking consensus, involving a third investigator (RDB) when necessary. Duplicate records were removed, and the remaining study titles and abstracts were screened before retrieving and reviewing full texts to identify eligible studies.
Data Extraction
Data were extracted independently in Covidence software by two investigators (JWSY and RW), who then verified accuracy through simultaneous comparisons. Extracted data included article title, first author, publication year, full journal title, study country, study design, study population of interest, study purpose, total number of patients, glucometric terms used, usage of “glucometric,” glucose testing methods, brand of glucose meter or analyzer, and thresholds for hyperglycemia and hypoglycemia.
Data Synthesis
Extracted data were assessed for the frequency of glucometric terminology use over time and its use compared to the original description by Goldberg et al. Additionally, glucose measurement methods and threshold criteria for defining hyperglycemia and hypoglycemia were assessed.
Results
A total of 767 studies were identified, of which 44 studies were included in the final review (summarized in Table 1).3,4,8-11,13,18-54 The PRISMA flow diagram detailing the study selection process is depicted in Figure 1. A significant number of studies were excluded due to duplicate records, conference abstracts, or being conducted in outpatient settings.
Summary of key features for included studies.
1—As a general term for reporting inpatient glycemia.
2—Reporting on a Goldberg glucometric as a study outcome.
3—Proper Noun-Term used as the title of the software program.
4—Used to describe the glucose monitoring process/glucose measurement analysis.
5—Comparing differing glucometric models of both Goldberg and non-Goldberg models.
6—“Glucometric” term is not used.
7—Validating a glucometric measure.
8—Used non-Goldberg performance metrics.
PRISMA flow diagram.
Study Characteristics
Of the 44 studies included, there were 16 pre- vs post-intervention observational studies,18-3314 cross-sectional studies,3,4,8,10,13,34,35,37-43six cohort studies,36,44-48four qualitative studies,11,49-51three randomized controlled trials,9,52,53 and one case–control study. 54 The studies were primarily from North America (n=31),4,10,11,13,18,19,22-25,27,29-36,39,41-48,51-53 with 11 from the Asia-Pacific region3,8,9,20,21,26,28,38,40,50,54 one each from Israel 37 and Ireland. 49 Regarding hospital settings, 22 studies focused on non-critical care wards,3,8-10,13,18,19,22,25,27-29,32,34,37,39,42,45,46,48,52,54 14 on both critical and non-critical wards,4,11,21,30,31,33,35,36,38,41,43,47,49,51 seven on critical care wards,18,23,24,26,40,44,53 with one unspecified. 50 The yearly distribution of studies is shown in Figure 2.
Number of included studies by publication year.
Patient population size ranged from 26 to 2 612 966, with 11 studies including <500 patients,3,13,20,21,38-40,45,46,52,53 four studies between 500 and 1000 patients,8,25,34,45 11 studies 1000-10 000 patients,9,10,22,26,27,30,32,35,37,44,54 eight studies 10 000-100 000 patients,18,19,28,29,33,36,42,47 and two studies with >100 000 patients.41,43 Two studies reported the patient population size in “patient-days,”23,42 two studies did not report any patient population size as they were not the target population of the study,24,51 and four studies did not report patient population size,11,31,49,50 even though they reported glucometric data from the target population.
Glucometric Utilization and Reporting
Glucometric models
Of the three glucometric models described by Goldberg et al, 13 the “patient-day” model was utilized in 33 studies,3,4,8-11,13,18-23,25,27-32,34,35,39-43,46,47,50,52-54 the “patient-stay” model in 19 studies,3,4,8,11,13,21-23,27,28,32,35,36,38,40,45,48,50,53 and the “population” model in 11 studies (Figure 3(a)).3,8,11,13,21,23,26,29,32,40,50 A single glucometric model was used in 22 studies;9,10,18-20,25,26,30,31,34,36,38,39,41-43,45-48,52,54 two models in seven studies;4,22,27-29,35,53 and all three models in nine studies.3,8,11,13,21,23,32,40,50 Six studies did not use any models but simply used the term “glucometrics.”24,33,37,44,49,51 Figure 3(b) demonstrates comparable use of the three models in the first vs second halves of the time period assessed in this review.
(a) Included studies, organized by the type of glucometric models used. (b) Included studies organized by models used between 2006-2014 and 2015-2023.
Glucometric reporting and metrics
Figure 4(a) depicts the variability in metrics being reported. “Mean glucose” was reported in 32 studies,3,8-10,13,18,19,21-23,25-30,32,35,36,39-43,45-48,50,52-54 “proportion of hyperglycemia/hypoglycemia” in 18 studies,3,8,10,13,20,28,30-32,34,38-41,43,47,53,54 while new metrics were reported in seven studies (“adverse glycemic days” [n=3];3,8,9 “time-weighted average glucose” [n=3];32,36,44 and “glucose excursion rate” [n=1]). 35 When comparing both halves of the examined time period (Figure 4(b)), new performance metrics not introduced by Goldberg et al increased in prevalence from 2015 to 2023.
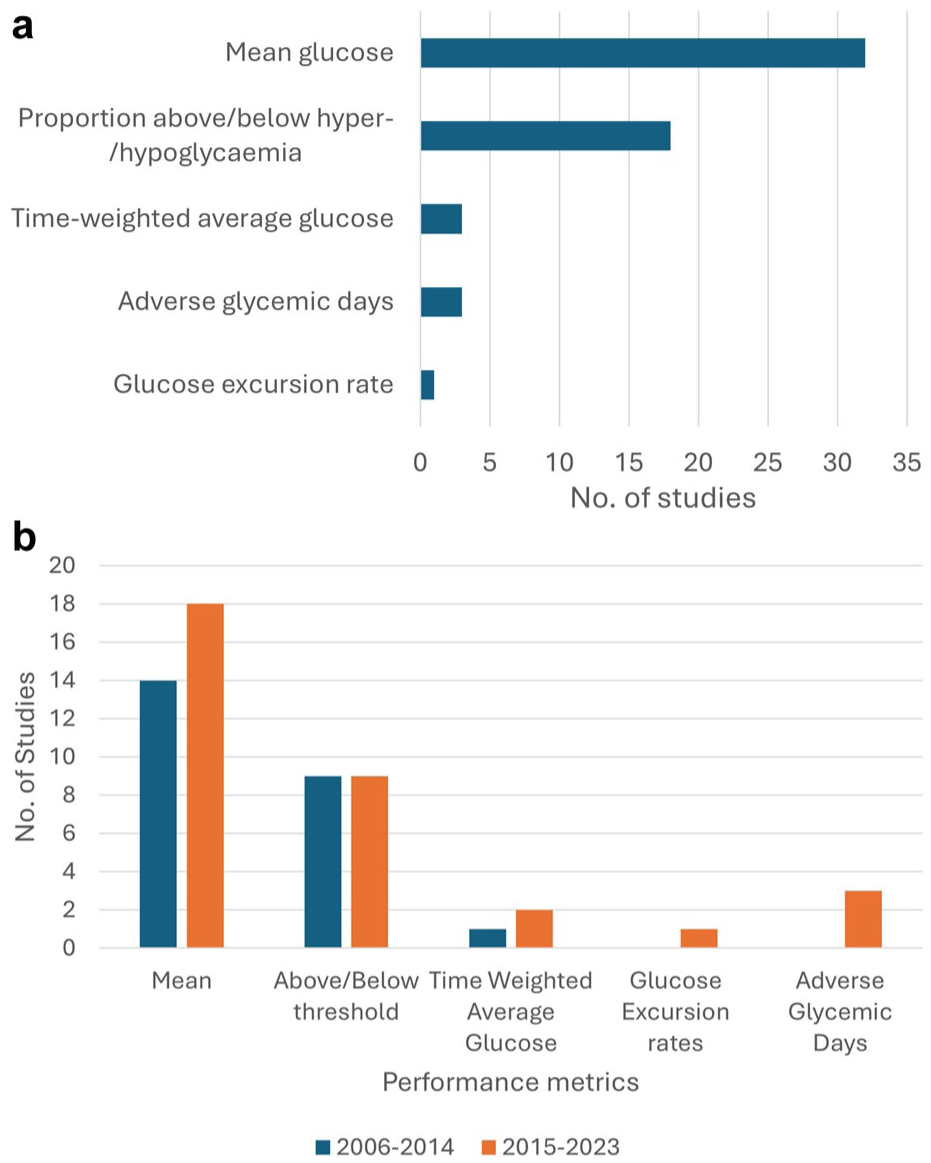
(a) Included studies, organized by performance metrics reported. (b) Included studies organized by metrics used between 2006-2014 and 2015-2023.
Studies’ main purpose of glucometric terminology usage
Some of the included studies utilized glucometric terminology in more than one way. The concept of glucometrics was utilized in 24 studies to assess intervention effectiveness;9,18-33,39,44,47,51-54 12 studies to measure inpatient glycemia quality;3,8,34,36-38,40,41,43,45,46,48 and four as the subject matter in developing calculation software.4,11,49,50 Eight studies proposed new performance metrics (“adverse glycemic days,” “time-weighted average glucose,” and “glucose excursion rates”).3,10,13,32,35,36,42,44
Analytic modalities and devices
Capillary fingerprick glucose measures were utilized in 37 studies (Roche Accu-Chek in eight studies,25,30,37,41,45,48-50 Nova Statstrip in 5,3,8-10,54 Lifescan SureStep in 2,13,35 Abbott Optium in 1, 21 and device not stated in the remaining 21)4,18,19,22,23,27-29,31-33,34,36,38,39,42,43,46,47,52,53. Blood gas measures were used in three studies,4,26,38 and plasma glucose measures in seven.4,25,30,33,36,38,48 Of the 44 studies, 31 reported a single glucose modality,3,8-10,13,18,19,21-23,26-29,31,32,34,35,37,39,41-43,45-47,49,50,52-54 seven reported multiple combinations of capillary point-of-care (POC), blood gas, and plasma glucose,4,25,30,33,36,38,48 while six did not specify the glucose modality used.11,20,24,40,44,51
Glucometric Thresholds
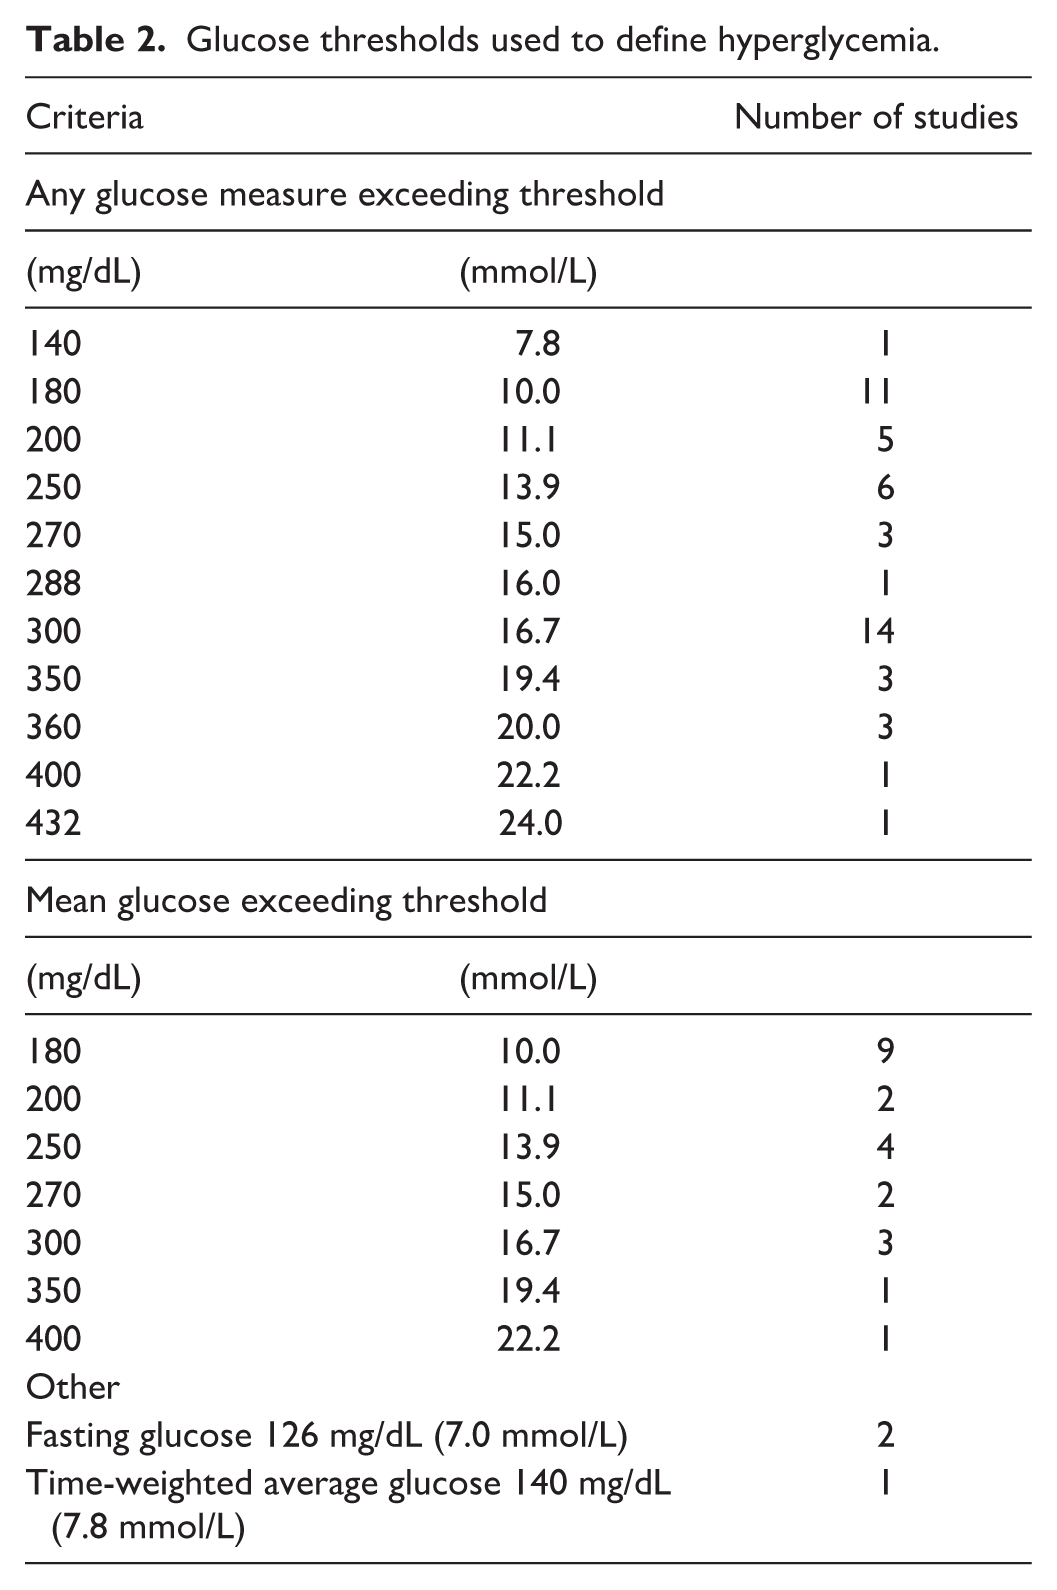
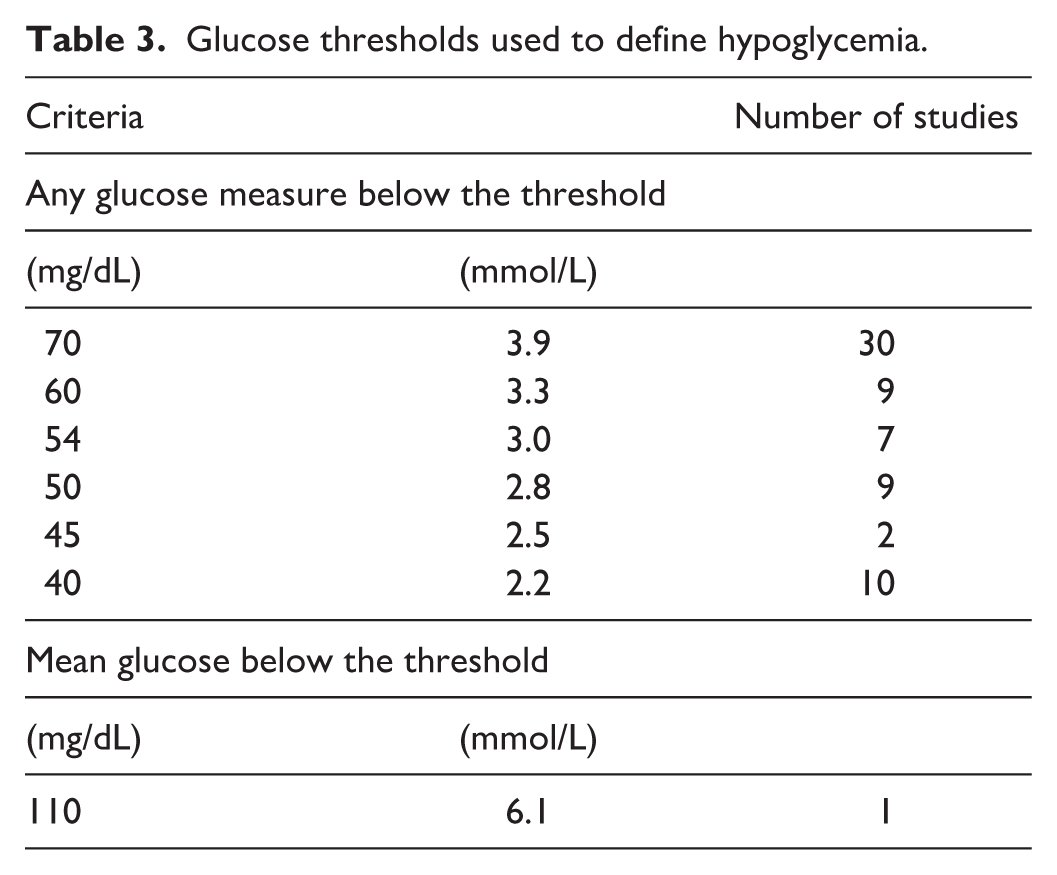
Glucose thresholds used to define hyperglycemia (Table 2) and hypoglycemia (Table 3) varied between different studies.
Glucose thresholds used to define hyperglycemia.
Glucose thresholds used to define hypoglycemia.
Thresholds used to define hyperglycemia included any single BG measure above 140-432 mg/dL (7.8-24.0 mmol/L), or a mean glucose above 180-400 mg/dL (10.0-22.2 mmol/L). Rarely, studies defined hyperglycemia using fasting glucose or time-weighted mean glucose. The most commonly used hyperglycemia criteria were any glucose exceeding 300 mg/dL (16.7 mmol/L) (n=14)4,11,13,18-20,23,29,31,32,39-41,52 or 180 mg/dL (10.0 mmol/L) (n=11),3,8,21,30,33,35,39,41,46,49,54 or a mean glucose exceeding 180 mg/dL (10.0 mmol/L) (n=9).3,8,9,23,25,27,43,47,54 Multiple levels of hyperglycemia severity were reported in 17 studies,3,8,9,21,23,28-30,32,39,41,43,44,47,49,50,54 while a single threshold was used in 23.4,11,13,18-20,22,24-27,31,33,34-37,40,45,46,48,52,53
Hypoglycemia was variably defined as any BG measure below 40-70 mg/dL (2.2-3.9 mmol/L). In one study, a mean glucose level was used to describe hypoglycemia. 36 The most commonly reported hypoglycemia criteria were any glucose measure below 70 mg/dL (3.9 mmol/L) (n=30)3,4,8-11,18-21,23,24,28-33,35,38-41,43,44,47,49,50,53,54 or 40 mg/dL (2.2 mmol/L) (n=10).4,8,23,24,27,29,32,41,43,52 Multiple levels of hypoglycemia severity were reported in 19 studies,3,4,8,9,23,24,27-30,32,38,39,41,43,44,50,52,53 while a single threshold was used in 21.10,11,13,18-22,25,26,31,33,34-37,40,46,47,49,54
Discussion
This systematic review assessed the use of glucometric principles and terminology over time since 2006. 13 Despite evolution in the use of glucometric as a term and as a concept over the two decades, we found that the majority of included studies still used “glucometrics” terminology consistent with the original description. Interestingly, direct reference to Goldberg’s study decreased over time, and more studies began to use “glucometrics” as a general concept. This suggests increasing familiarity and understanding of “glucometric” terminology in the literature, decreasing the need for direct reference to the original paper. There was also an increase in the introduction of new glucometric reporting in the latter half, adding further heterogeneity.
The concept of glucometrics is gaining more importance in inpatient settings, and reaching consensus is crucial for its wider application, as there are currently no standardized methods of monitoring diabetes care in inpatient settings, unlike well-established measurements such as HbA1c used for outpatient settings. In the United States, the Centers for Medicare & Medicaid Services, through the electronic clinical quality measures of hypoglycemia (<40 mg/dL in a patient-stay model) and hyperglycemia (>300 mg/dL in a patient-day model), 55 has been using glucometric data for institutional funding since 2021. 14 The U.S. Centers for Disease Control and Prevention’s National Healthcare Safety Network are leading the efforts in developing digital quality measures for inpatient glucometrics, and are poised to generate standardized reportable metrics. In addition, further studies are required to identify which glucometric models best correlate with clinical outcomes such as mortality and health care-associated infections. Each glucometric model and performance metric has its unique advantages, and current glucometric reports include combination of models and performance metrics providing comprehensive understanding of specific glycemic trend. However, to maximize the value of glucometric analysis and benchmarking, consensus on reporting methods is essential, similar to advancements made for CGM devices in the ambulatory glucose profile. 56 Our review highlights sources of glucometric heterogeneity, affecting models, performance metrics, glucose thresholds, measurement methods, and exclusion criteria.
Glucometric Models and Performance Metrics
In our review, there was variability in the usage of glucometric models. While the majority (n=33) of studies preferred the “patient-day” model, highlighting preference for this more balanced model, 13 many studies also used “patient-stay” and “population” models. While some heterogeneity is to be expected given the different uses, relying solely on less commonly used glucometric models can hinder comparison with other cohorts and studies. To enable direct comparisons between studies, we recommend that researchers report the more commonly used “patient-day” and “patient-stay” models as a bare minimum, in addition to other specific models as appropriate.
Further challenges arise from variability in performance metrics affecting how glucometric analyses are reported. Performance metrics used by Goldberg et al were “mean glucose” and “proportion above and below hyper- and hypoglycemia,” which were the most popular choices. 13 Choice of performance metrics is further complicated by studies using novel metrics (i.e., adverse glycemic days, time-weighted average glucose, and glucose excursion rates) that provide valuable insights into minimizing hospital-acquired complications in patients with dysglycemia. However, these novel performance metrics present another source of heterogeneity limiting comparison across different cohorts and studies.
“Time-weighted average glucose” assesses the duration of time over which a patient experiences adverse glycemia, evaluating whether the length of each episode of adverse glycemia has greater prognostic value and a stronger association with mortality than existing metrics. 57 On the other hand, “adverse glycemic day” (AGD), defined as any patient-day with BG >270 mg/dL (>15 mmol/L) or <72 mg/dL (<4 mmol/L), 3 indicates prevalence of the extreme ranges of BG to be avoided in hospital patients. 3 AGDs can be considered the inverse of the “good diabetes day,” a term coined in the National Diabetes Inpatient Audit–England nationwide benchmarking study, and defined as a patient-day without hypoglycemia and with no more than one BG measurement exceeding 196 mg/dL (11 mmol/L). 58
Glucose Thresholds
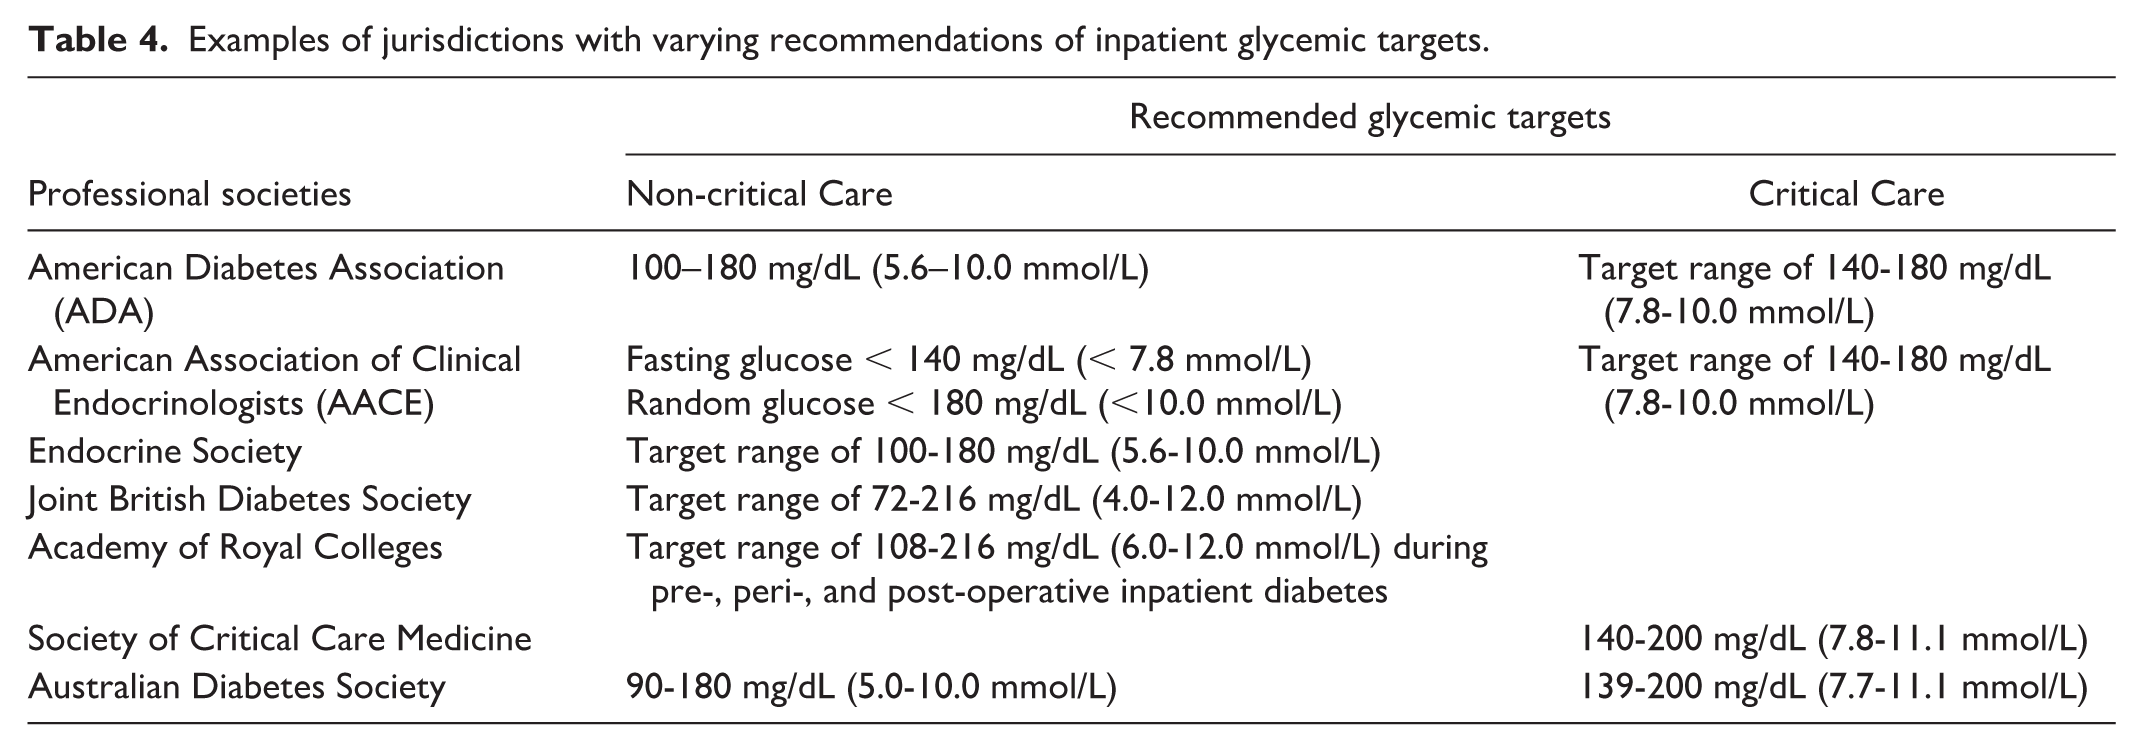
A further barrier to glucometric harmonization is variation in glucose thresholds defining hyperglycemia and hypoglycemia. Our review shows that hypoglycemia thresholds range between 40 and 70 mg/dL (2.2-3.9 mmol/L) and hyperglycemia between 140 and 432 mg/dL (7.8-24.0 mmol/L). Some of this discrepancy may relate, in part, to different glucose targets in non-critical care and critical care settings, as well as differing targets between jurisdictions (Table 4).57-61,64
Examples of jurisdictions with varying recommendations of inpatient glycemic targets.
Additionally, measurement units also contribute to this variability, with mg/dL often using multiples of 10 or 50, while mmol/L uses multiples of 0.5 and 1.0. The optimal glucose level for treating hyperglycemia has not been established through prospective randomized controlled trials in either non-critical or critical care settings, contributing further to variability. Recent studies indicate that while excessively tight glycemia in hospital between 80-110 mg/dL (4.4-6.1 mmol/L) may not be beneficial,62,63 there is no consensus on which hyperglycemia level necessitates intervention.
The patient clinical context may further complicate glycemic treatment thresholds. For instance, the management of those experiencing new hyperglycemia may differ from those with long-standing diabetes and multiple comorbidities. For the former group, clinicians generally aim for stricter target glucose levels, while the presence of significant medical comorbidities and frailty may necessitate more liberal glucose targets.
Given the numerous factors influencing treatment decisions, it is crucial to standardize definitions of thresholds of adverse glycemia and graded thresholds for hypo- and hyperglycemia to enable direct comparisons between studies and to benchmark institutions. We recommend establishing minimum standard metrics when reporting glucometrics that is consistent with target ranges for BG set out by guidelines for inpatient diabetes care.59,64
We propose reporting patient-day mean glucose levels exceeding 180 mg/dL (10 mmol/L), along with proportion of patient-days with any level 1 (54-69 mg/dL [3.0-3.8 mmol/L]) and level 2 hypoglycemia (<54 mg/dL [<3.0 mmol/L]) 20 Moreover, < 40 mg/dL (<2.2 mmol/L) is also a worthwhile consideration as it represents “never event” values, but, given the low event frequency, may be better reported within a patient-stay model. These represent the most commonly used glucometric model and thresholds, respectively, that reflect a balance between strict and liberal glycemia.
Glucose Acquisition Method
A further source of variability in the reporting of glucometrics is the method used to obtain glucose measurements. Capillary POC BG measures were utilized in the majority of studies included in this systematic review, with some using plasma glucose or whole blood. Plasma and blood gas glucose samples are typically collected irrespective of diabetes status, while capillary POC BG measures, performed predominantly in those with diabetes, better capture symptomatic hyperglycemia and hypoglycemia. 13 Therefore, in glucometric analyses using POC measures, the addition of plasma measures may lead to artificially lower reported glucose concentrations. Additionally, some studies indicate overall capillary POC BG measures to be typically 0.5-1.0 mmol/L lower than plasma glucose results. 65 Most studies reviewed did not address these potential biases resulting from combining POC with plasma glucose.
Even the use of POC capillary glucose poses challenges. The accuracy of POC results with blood samples is lower in the intensive care unit, 4 and different POC instruments can produce dissimilar results, impacting data quality when dual devices are used. 66 Additionally, hospitals vary in their practices of BG testing frequencies and thresholds. 4 A promising glucose acquisition method to consider for future glucometry is measurement of interstitial fluid glucose concentration via CGM.67,68 However, while CGM technology seems promising and consensus statements regarding harmonized reporting of CGM data exist,11,69 it is not currently ready to be widely deployed in hospitals due to cost, staff training, inconsistent trial efficacy, and lack of regulatory approval for in-hospital use. 2 Additionally, it will be important for future studies to differentiate between interstitial fluid glucose from CGM and capillary BG from POC testing. 70
Exclusion Criteria
Finally, there is also a need for consensus on exclusion criteria for target populations. Typically, data from patients with diabetic ketoacidosis, hyperosmolar hyperglycemic state, critical care patients, pediatric patients, and pregnant individuals should be analyzed separately, due to skewed data that results from these patient populations having different glycemic measures in hospital or separate guidelines on target glycemic ranges. 14 Additionally, data from palliative patients or patients with less than 24-hour hospitalizations should be excluded. 14 Furthermore, including repeat glucose values after a hypoglycemic episode can skew results, as noted by Weinberg et al. 34 Therefore, it is essential to accurately report the specific exclusion criteria used. Despite the recommendations from Weinberg et al. 34 , only three studies explicitly applied these exclusions.3,5,9
Strengths and Limitations
The methodological strengths of this review include a comprehensive search strategy covering an extensive time period and a detailed review of multiple glucometric aspects. Although many studies were observational, given the descriptive nature of this review, this did not significantly impact our conclusions. An important limitation of our review is potential bias from including studies from institutions with greater access to glucometric data collection tools, including electronic medical records and connectivity-enabled glucose meters. Additionally, this study did not assess indices of glycemic variability, such as standard deviation, coefficient of variation, or mean amplitude of glycemic excursions. There is also growing interest in “insulinometrics,” which associates glucometrics with insulin use to assess inpatient glycemic management.2,14 However, its accuracy and use rely on first achieving harmonization of glucometrics.
Conclusion
Harmonizing glucometrics enables direct performance comparisons within and between institutions, driving quality improvement in inpatient diabetes care. Key challenges include large data requirements, inconsistent glucose thresholds, and varied models and metrics, making comparisons difficult.
This review underscores the need to harmonize glucometric reporting to improve research comparability, enable benchmarking across hospitals, and support quality improvement initiatives.
Supplemental Material
sj-docx-1-dst-10.1177_19322968261427437 – Supplemental material for “Mellitus Metrics”—Systematic Review of Glucometric Reporting within Hospital-Based Diabetes Studies (2006-2023)
Supplemental material, sj-docx-1-dst-10.1177_19322968261427437 for “Mellitus Metrics”—Systematic Review of Glucometric Reporting within Hospital-Based Diabetes Studies (2006-2023) by Ji Won Susie Yoo, Ray Wang, Mervyn Kyi, Spiros Fourlanos and Rahul D Barmanray in Journal of Diabetes Science and Technology
Footnotes
Acknowledgements
none
Abbreviations
AGD, adverse glycemic day; BG, blood glucose; CGM, continuous glucose monitoring; HbA1c, hemoglobin A1c; POC, point-of-care; PRISMA, Preferred Reporting Items for Systematic Reviews and Meta-Analyses
Declaration of Conflicting Interests
The authors declared the following potential conflicts of interest with respect to the research, authorship, and/or publication of this article: RB chaired an educational meeting sponsored by an independent educational grant from Boehringer Ingelheim. MK has received honorarium from Astra Zeneca. SF contributes to the advisory panel for Viatris Inc. and Pfizer Inc; has contributed to the speaker’s bureau for Novo Nordisk, Astra Zeneca, and Boehringer Ingelheim and Eli Lilly Alliance; and has received research funding from Dexcom Inc. RW has received research funding from Dexcom Inc.
Funding
The authors disclosed receipt of the following financial support for the research, authorship, and/or publication of this article: RW is the recipient of an Australian Commonwealth Government RTP Scholarship, ACADI PhD Grant, Fred Knight Research Scholarship, Rowden White Scholarship, and Gordon P Castles Scholarship.
Supplemental Material
Supplemental material for this article is available online.