
Abstract
The Oral Minimal Model (OMM) analysis offers unique measures of glucose–insulin regulation during glucose challenges. However, its manual test-by-test implementation limits scalability in large studies. We introduce the Automated Oral Minimal Model (AOMM), a tool that streamlines and automates the entire OMM workflow while preserving analytical fidelity, enabling efficient batch processing of large datasets. Built on SAAM II software, AOMM was validated against manually extracted results from Sunehag et al (Obesity (Silver Spring), 2008), accurately reproducing key parameters such as insulin sensitivity (Si) and beta-cell responsivity (Φ) with high precision and substantial time savings. AOMM, with its user-friendly interface, facilitates broader application of minimal modeling in research and clinical studies.
Keywords
Introduction
Metabolic health is determined by effective blood glucose regulation, a process primarily managed by insulin. Key (dynamic) metrics, such as the insulin sensitivity (Si) and beta-cell responsivity (Φ) indices, are derived from oral glucose tolerance tests (OGTT) or meal tolerance tests using the Oral Minimal Model (OMM) analysis. These indices provide unique insights into how well insulin is functioning and its overall effectiveness in maintaining blood glucose levels. 1
OMMs are mechanistic (first-principles) mathematical models designed to analyze the glucose-insulin-C-peptide system. 1 The glucose OMM estimates insulin sensitivity (Si), which reflects how efficiently the body manages external glucose. The C-peptide OMM provides beta-cell indices (Φ), quantifying the efficiency of insulin secretion in response to external glucose. 1 OMMs have proven to be reliable predictors compared to the more labor-intensive intravenous glucose tolerance test (IVGTT), 2 and potentially, more informative than other oral glucose tolerance metrics. 3
The minimal model analysis has been in use for over 40 years, with more than 500 publications. 4 Initially focused on pathophysiological studies in clamps, it later expanded to oral tests (OMM), with or without tracers (e.g., Sunehag et al 5 ). Its applications now encompass nutrition research (e.g., Smith et al 6 ), clinical trial evaluations (e.g., Galderisi et al3,7 and Liu et al 9 ), and diabetes progression studies (e.g., Galderisi et al 10 ). In essence, whenever metabolic status assessment via a meal or OGTT is required, OMM metrics can be applied. 11 As tolerance test data collection becomes more widespread, the demand from stakeholders for an efficient software program to support the OMM analysis has grown substantially.
Unlike other indices that can be calculated using simple spreadsheet computations, OMM analysis requires specialized software. Only a few software tools have been validated by the community for minimal model analysis.12,13 Among these, SAAM II gained popularity for its proven reliability in analyzing minimal models, including the oral minimal model analysis and the user-friendly graphical interface. All users can perform OMM analyses eliminating the need for coding.12,14,15
Despite its intuitive interface and established role in OMM, previous versions of SAAM II still required users to manually create two separate files per tolerance test—one for glucose and one for C-peptide and run model identification on a one-by-one basis. This involved entering various parameters, including glucose dose, sampling times, plasma concentrations, and patient characteristics such as body weight and age, and at times, tuning modeling variables on an individual basis to optimize the accuracy of the parameters estimates. While manageable in small studies, this “manual” setup can become tedious, slow, and error-prone in larger cohorts, significantly limiting the scalability and usability of OMM, for example, in clinical trials, diabetes progression studies, or prevention research. As a result, groups using minimal model analysis would benefit significantly from the adoption of an automated tool, the Automated Oral Minimal Model (AOMM).
To support AOMM, we expand on the original manual OMM setup in SAAM II and upgrade the software to allow high-throughput parameter extraction. First, a new preprocessing tool is introduced to automatically convert spreadsheet data into SAAM II format, eliminating the time-consuming steps of manual copying, pasting, and formatting. A key addition in preprocessing is the automatic calculation of the glucose first derivative, which is required for the OMM analysis. Previously, this step was left to the users who relied on external, non-standard scripts and used various methods, leading to numerical errors when computing secretion Φ parameters. Now, the derivative is computed within the preprocessing stage using the regularized deconvolution method, 16 ensuring consistency and good practice with OMM theory. 1
Second, the built-in batch processor is made more flexible for AOMM. Earlier versions of the SAAM II’s batch processor were designed for strict pharmacokinetic models, where the process would stop if any warning or error occurred. 14 For instance, in OMM analysis, estimation issues arose when insulin sensitivity (Si) approached zero in subjects with severely impaired glucose utilization. Previously, SAAM II would flag Si as imprecise and therefore the test was skipped or halted; AOMM accommodates these cases as physiologically valid and either accepts the result or reassigns it using the GEZI method. 17 Finally, postprocessing is now streamlined: AOMM generates a single spreadsheet with results from all subjects, avoiding the need to open and extract each file manually.
In this paper, we show that AOMM gives the same results as the manual method, with the same level of accuracy, but much faster, effectively leading to a validation for usage at a larger scale.
Methods
The streamlined workflow for automated minimal model (AOMM) analysis is illustrated in Figure 1. Assuming N tolerance tests (e.g., OGTT here) are recorded in a spreadsheet (e.g., in .csv or .xls format), the process involves the following steps:
To validate the AOMM implementation, we compared its outcomes with reference data from Sunehag et al, 5 who conducted OGTT studies on 11 healthy participants, collecting 25 samples from -30 to 420 minutes, per test (more details in Supplemental Material S1). Notably, these reference data had been validated using triple-tracer studies and anchored on IVGTT, ensuring approximation to “true” insulin sensitivity and insulin secretion. Mathematical derivation of insulin sensitivity Si and insulin responsivity (Φ) indices are reported in the Supplemental Material S2. Beta-cell responsivity Φ is an umbrella term that includes the (beta-cell) response to a change in glucose concentration Φd (dynamic), the response to a given glucose concentration Φs (static), and the total response to the glucose stimulus Φtot, as defined in equations in Supplemental Material S2 and illustrated in Supplemental Figure S1. AOMM’s estimation precision, calculated using SAAM II’s asymptotic parameter precision based on the Fisher Information Matrix method, 14 was expressed as coefficient of variation (CV) and evaluated against the 25% threshold established in the reference work. 5 To assess agreement between two methods, manual OMM vs AOMM, we performed Bland–Altman analyses for each index. For each participant, the average and difference between methods were calculated and plotted. Bias (mean difference) and 95% limits of agreement (mean ± 1.96 SD) were derived to evaluate systematic and random discrepancies.
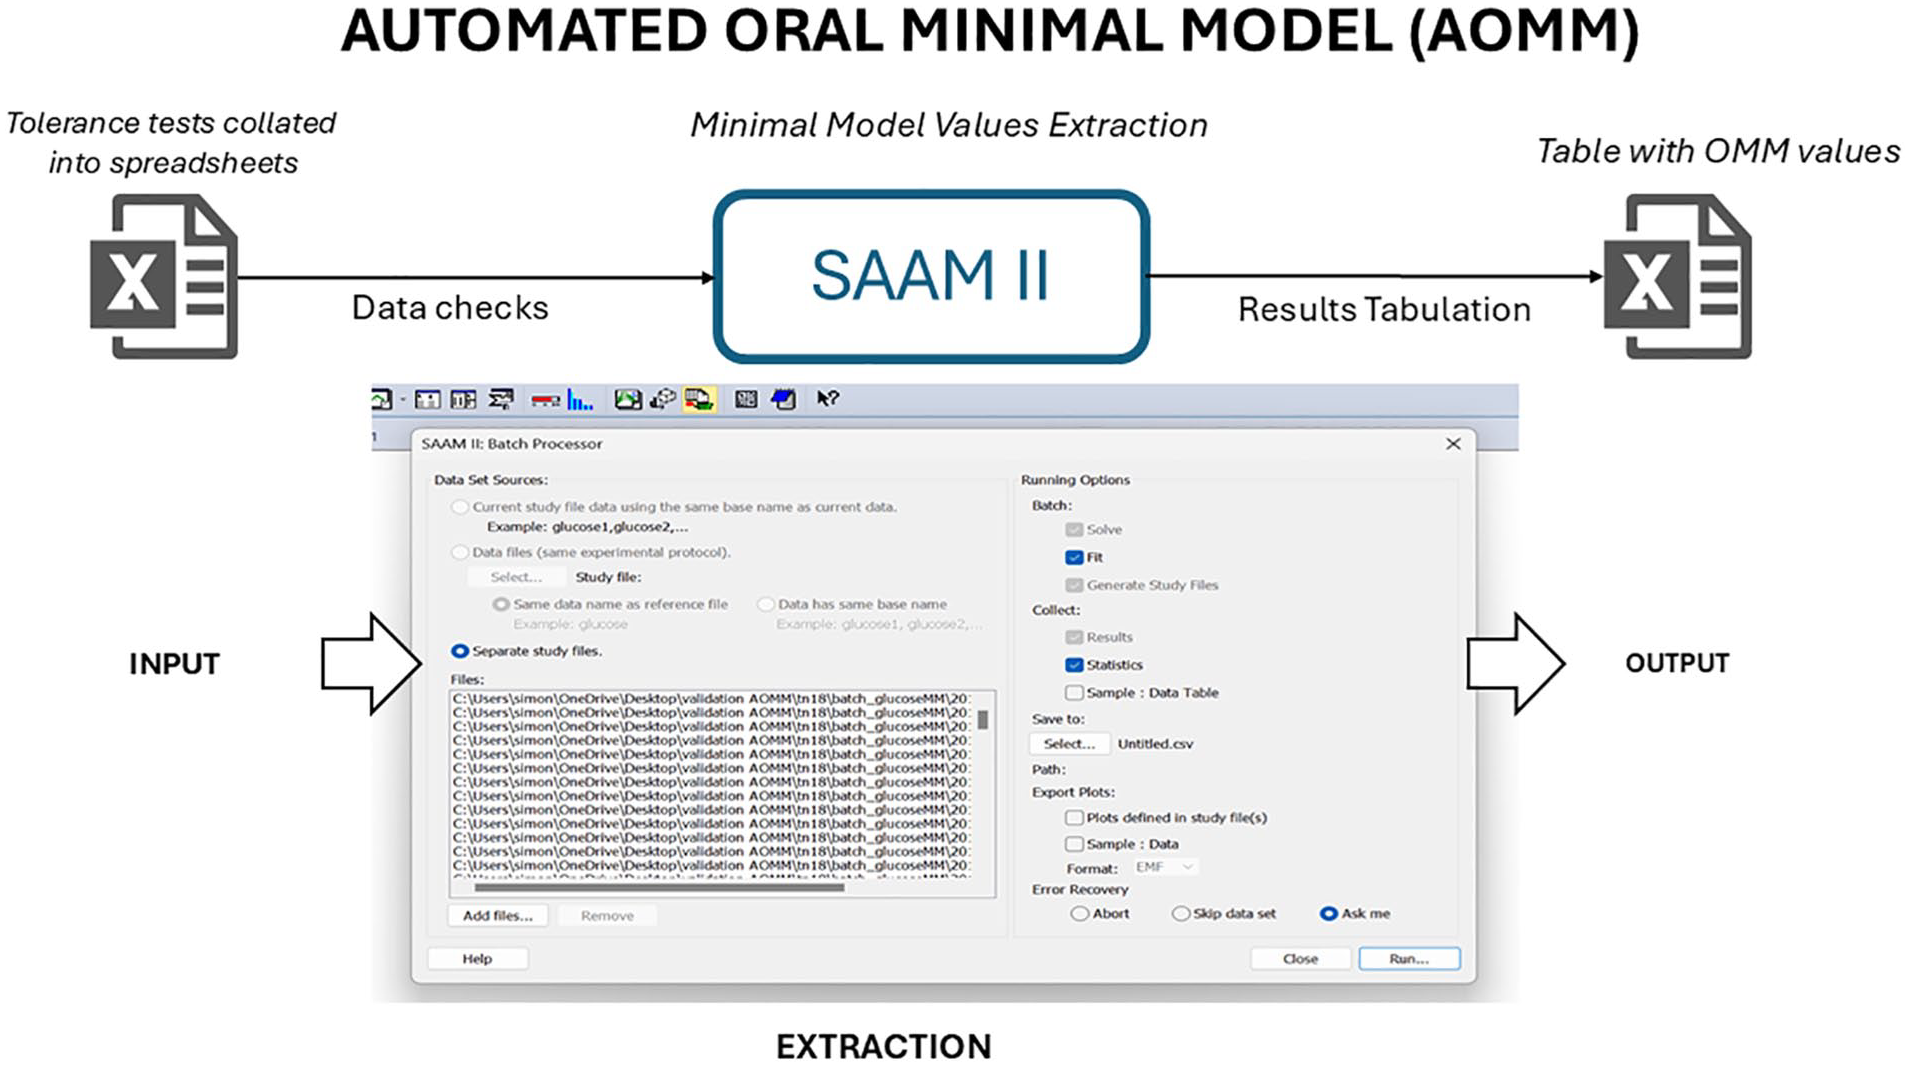
The Automated Oral Minimal Model (AOMM) framework enables fast and automated extraction of Oral Minimal Model values. Tolerance test datasets (e.g., OGTT) are organized into spreadsheets and processed in the SAAM II batch function (snapshot), which automatically extracts parameters and compiles them into spreadsheets for further analysis.
Both automated and manual methods used the same modeling conditions, where sometimes not fully stated in Sunehag et al., 5 we retrieved additional assumptions and initial/boundary conditions from references cited therein.18,19 Briefly, basal values were averaged from −30, −20, −10, and 0-minute samples; population parameters such as glucose effectiveness were set to 0.035 min−1, and glucose volume to 2.40 dl/kg; 5 The dynamic rate of insulin action p2 was set to Bayesian conditions (prior mean 0.002 with CV = 20%); Measurement errors were assumed independent and normally distributed with zero mean: 2% for glucose, and 2000 + 0.001 × [C-peptide]² for C-peptide. AOMM was run and validated using SAAM II v2.4 (Nanomath LLC, Spokane, WA, www.nanomath.us/saam2) on a Windows 11 laptop (Alienware M15 R7, Intel i9 14-core CPU, 32 GB RAM).
Results
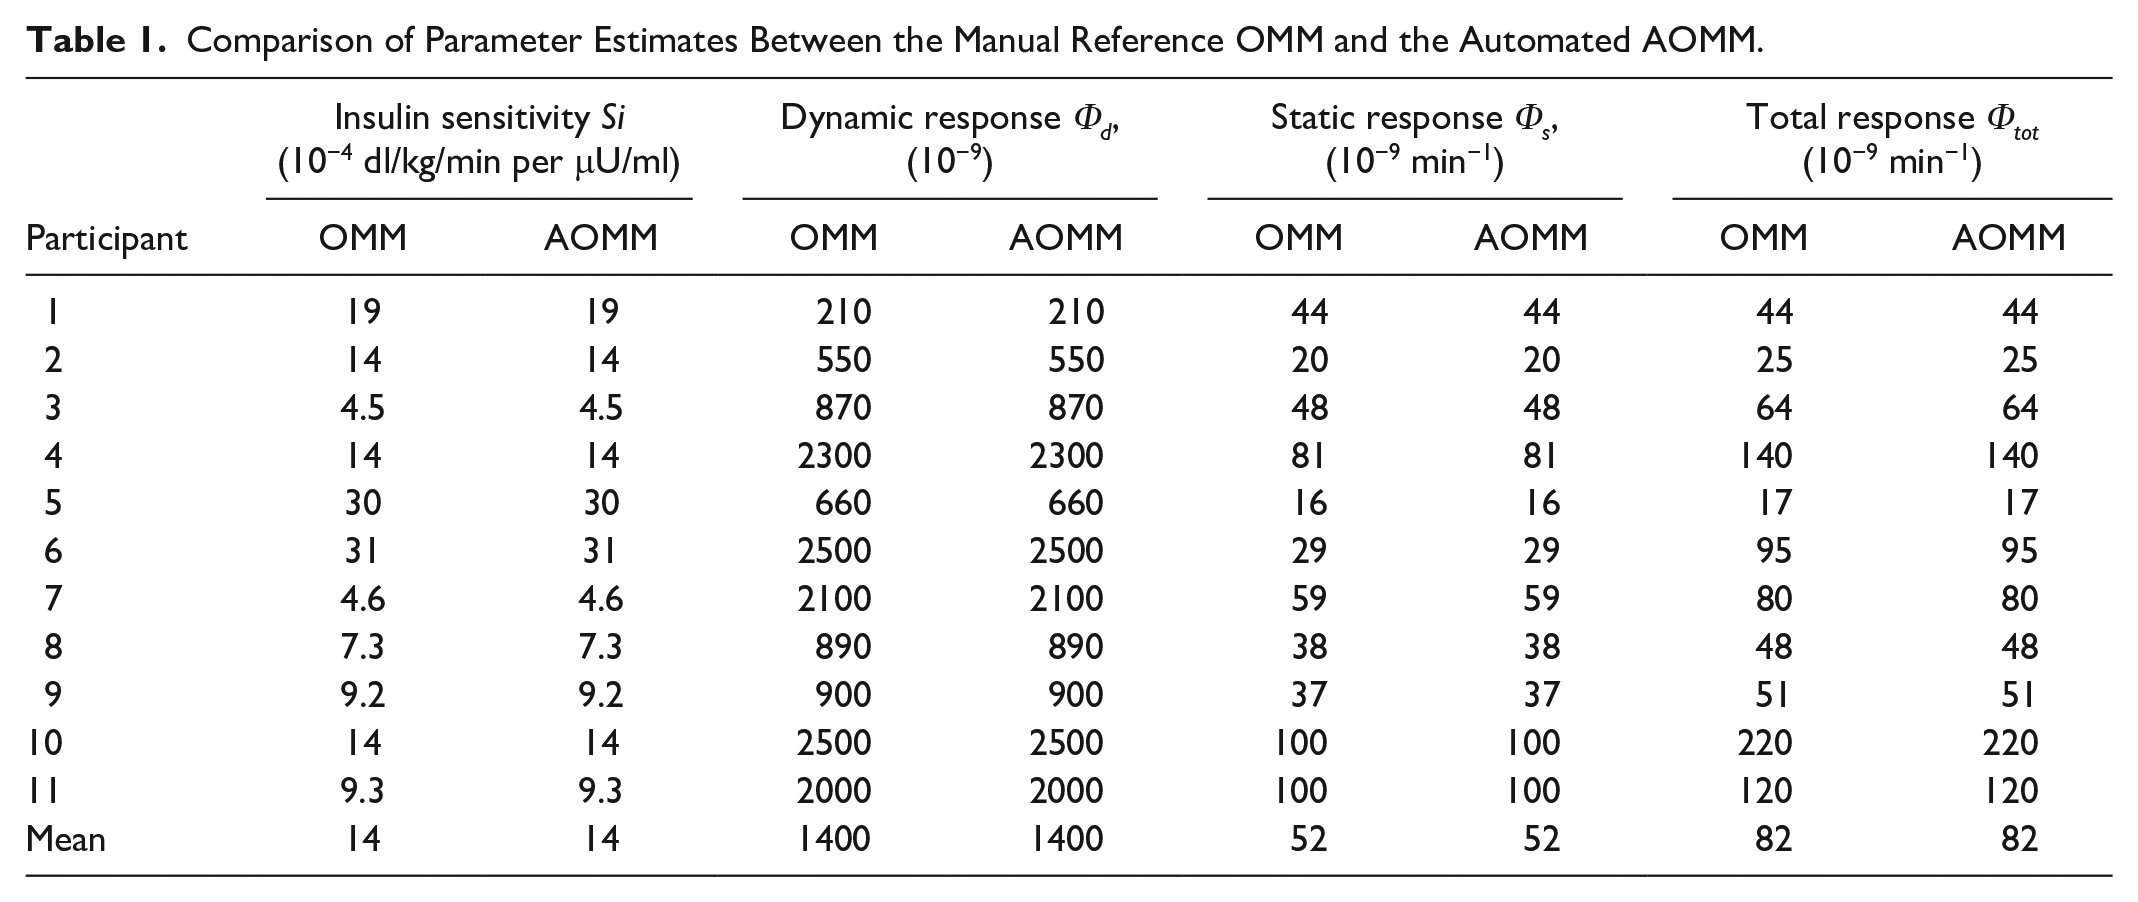
AOMM ran successfully on the entire cohort, with no fitting issues and good parameter precision. AOMM indices were compared with the manual reference OMM and summarized in Table 1. Insulin sensitivity (Si) and beta-cell responsivity parameters (Φ) showed identical estimates, supporting AOMM’s validity. The Bland–Altman analysis across all parameters, insulin sensitivity (Si), dynamic response (Φd), static response (Φs), and total response (Φtot), showed zero bias, with all differences equal to zero. This indicates agreement between OMM and AOMM. (Bland–Altman plots in Supplemental Figure S2). No fitting errors or warnings were returned.
Comparison of Parameter Estimates Between the Manual Reference OMM and the Automated AOMM.
In terms of precision, AOMM consistently achieved CV below the reference threshold of 25%, for all the parameters (Figure 2). On average, CV was 7.5%, 7.5%, 3.8%, and 3.3% for Si, Φd, Φs, and Φtot, respectively.
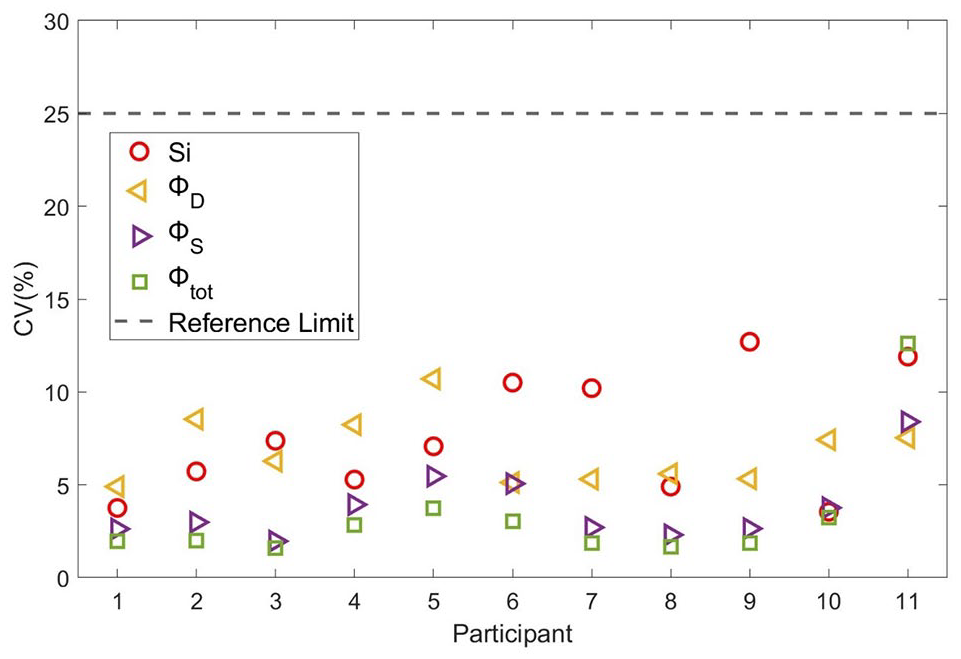
AOMM estimate precision expressed as coefficient of variation (CV%), compared to the 25% threshold defined by the reference OMM study (Sunehag, Man, Toffolo, Haymond, Bier and Cobelli, 2009). Symbols indicate CVs for different parameters: circles for Si; left-pointing triangles for Φd, right-pointing triangles for Φs, and squares for Φtot.
In terms of computational performance, AOMM extracted Si and Φ parameters in a fraction of a second on the test machine—approximately 5 Si and 3 Φ estimates per second—compared with the weeks usually required by a manual OMM analysis on the same data (personal communication).
In summary, AOMM produced results identical to the manual method with good precision, confirming that automation did not introduce errors. All components of the AOMM workflow—preprocessing (including automatic derivative computation), upgraded batch processing, and postprocessing tabulation—were thus successfully validated.
Discussion
Despite the use of tools like SAAM II, minimal model analysis remains time-consuming due to manual steps such as data cleaning, derivative calculation, and parameter extraction. Consequently, OMM analysis may be limited to small cohorts (tens of participants), posing a major barrier to large-scale or longitudinal studies. In settings such as clinical trials with hundreds of participants, manual analysis is impractical and may take months. The need for automation is clear and driven by stakeholder demand.
In this study, we present AOMM, the first automated tool for OMM analysis at scale. Users need only prepare spreadsheets with their tolerance tests and feed them into AOMM (Figure 1), which then returns a parameter table for analysis. Based on the results here, parameters from 100 tests can be extracted within minutes with validated accuracy and precision.
SAAM II was chosen to develop AOMM, not only for continuity with its established use in manual OMM analysis, but also for its unique advantages: the Bayesian Maximum A Posteriori (MAP) estimator, the forcing function method, and a modified extended least squares algorithm, all of which support fast and reliable parameter identifiability in OMM.14,15,20
Nevertheless, automation introduces challenges that must be continuously addressed to sustain the performance reported here. It can amplify minor issues typically corrected manually, such as unit mismatches, outliers, missing data, tolerance tests with fewer time points, misreported demographics (e.g., implausible BMI), and variability in baseline values. A fully automated AOMM system must be capable of handling edge cases, such as Si ≈ 0, which could occur in large datasets. Consequently, future updates may be necessary to address additional automation issues that did not emerge during this validation. Moreover, since the reference data used for validation involved young adults without diabetes, further optimization may be required when applying AOMM to other populations, such as individuals at different stages of diabetes.
Conclusion
The first fully automated OMM analysis (AOMM) was successfully developed, delivering accurate, validated results against reference data. AOMM enables extraction of minimal model parameters at scale, in a fraction of the time needed for manual analysis. This advancement should facilitate broader use of OMM in larger studies, where its physiological insights may be especially valuable.
Supplemental Material
sj-docx-1-dst-10.1177_19322968251365274 – Supplemental material for Automated Oral Minimal Models for Rapid Estimation of Insulin Sensitivity and Beta-Cell Responsivity in Large-Scale Data Sets: A Validation Study
Supplemental material, sj-docx-1-dst-10.1177_19322968251365274 for Automated Oral Minimal Models for Rapid Estimation of Insulin Sensitivity and Beta-Cell Responsivity in Large-Scale Data Sets: A Validation Study by Simone Perazzolo, Alfonso Galderisi, Alice Carr, Colin Dayan and Claudio Cobelli in Journal of Diabetes Science and Technology
Footnotes
Abbreviations
AOMM, automated oral minimal model; IVGTT, intravenous glucose tolerance test; OGTT, oral glucose tolerance test; OMM, oral minimal model; Si, insulin sensitivity; Φ, beta-cell responsivity.
Declaration of Conflicting Interests
The author(s) declared the following potential conflicts of interest with respect to the research, authorship, and/or publication of this article: SP has the official rights to distribute and develop the SAAM II program. CD consulted for Sanofi, Provention Bio, MSD, Immunocore, Amgen, Horizon, Vielo Bio, Avotres, Novartis, Phaim, Vertex, Dompe, and Diamyd. Joint patents with Sanofi and Midatech plc. AG, AC, and CC declare nothing to disclose.
Funding
The author(s) disclosed receipt of the following financial support for the research, authorship, and/or publication of this article: Breakthrough T1D (formerly JDRF) 3-SRA-2023-1422-S-B
Supplemental Material
Supplemental material for this article is available online.
References
Supplementary Material
Please find the following supplemental material available below.
For Open Access articles published under a Creative Commons License, all supplemental material carries the same license as the article it is associated with.
For non-Open Access articles published, all supplemental material carries a non-exclusive license, and permission requests for re-use of supplemental material or any part of supplemental material shall be sent directly to the copyright owner as specified in the copyright notice associated with the article.