
Abstract
While current systems for continuous glucose monitoring (CGM) are safe and effective, there is a high degree of variability between readings within and across CGM systems. In current CGM performance studies, device readings are compared with glucose concentrations obtained with a comparator (“reference”) measurement procedure (usually capillary or venous glucose). However, glucose concentrations from capillary and venous samples can systematically differ, often by as much as 5 to 10%. Different comparator methods have shown biases of up to 8%, and comparator devices of the same brand can systematically differ by more than 5%. To address these issues, the Working Group on CGM of the International Federation of Clinical Chemistry and Laboratory Medicine (IFCC WG-CGM) recommends standardizing study procedures and the comparator measurement process in CGM performance studies. The majority of IFCC WG-CGM members recommend the use of capillary samples as reference, mainly because CGM readings will then be aligned better with results from self-monitoring of blood glucose (SMBG). Even with factory-calibrated CGM systems, manufacturers require CGM users to perform SMBG in some situations, eg, manual calibration, confirmation of extreme readings, discordance between CGM readings and symptoms of hyper- or hypoglycemia, or intermittent signal loss. Comparator devices should meet defined analytical performance specifications for bias and imprecision. Comparator bias can be reduced by retrospective correction of comparator values based on measurements with a method or materials of higher metrological order. Once manufacturers align CGM readings of their systems with comparator results using standardized procedures, variability across CGM systems will be reduced.
Keywords
Introduction
Continuous glucose monitoring (CGM) is an essential tool for many people with diabetes. Studies have shown the clinical benefit of CGM systems in persons with type 1 diabetes, independent of being used as a stand-alone device or integrated with sensor-augmented pumps or systems for automated insulin delivery, and there is growing evidence for potential benefit in persons with type 2 diabetes.1,2
Continuous glucose monitoring systems can display markedly different readings when used in parallel, even if they show good performance results in their pivotal study.3-10 As a result, variability between CGM systems can be substantial enough that 2 systems may give sufficiently different results to affect clinical decisions.
The Working Group on CGM of the International Federation of Clinical Chemistry and Laboratory Medicine (IFCC WG-CGM) aims to standardize procedures for assessing the performance of CGM systems. A standardized study design with harmonized measurement procedures will allow better direct comparisons of CGM performance, and readings from different CGM systems will be better aligned. The IFCC WG-CGM acknowledges that procedures may have to be modified for specific populations (eg, people <18 years of age) or for specific indications (eg, intensive care units).
Specific characteristics for comparator data have been recommended before: 11 Comparator data should be obtained at 15-minute intervals for 6 to 8 hours during the beginning, the middle, and the end of sensor lifetime. Furthermore, the comparator data distribution should cover the clinically relevant concentration ranges and rates of change, eg, by inducing glucose changes after meal challenges.
To ensure comparability, the procedure for comparator (“reference”) measurements must be standardized. A recent review indicates that this has not been the case in the past. 12 The complete description of a comparator measurement procedure comprises the type of comparator device (eg, laboratory analyzer, blood gas analyzer, and handheld analyzer), the brand of the device, the device’s analytical methodology (eg, glucose oxidase and hexokinase), its traceability to a higher order reference method (eg, isotope dilution mass spectrometry [IDMS]), the specific consumable batches/reagent lots used, and the type of sample (sample origin and pre-analytical handling). The choice of sample type and comparator method can affect each other, as not all methods are intended to be used with all sample types.
This article reports recommendations by the IFCC WG-CGM for standardized study procedures. With these recommendations, the IFCC WG-CGM intends to initiate scientific discourse regarding design of and procedures in CGM performance studies. Ultimately, the IFCC WG-CGM aims to support the establishment of an international standard regarding the performance evaluation of CGM systems.
Sample Origin and Handling
Background Information on Sample Origin
In CGM performance studies, 3 blood sample types are commonly used for comparator measurements: capillary, venous, and “arterialized-venous..” 12 Glucose concentrations are physiologically different between these venous and capillary samples, with past studies showing differences between capillary and venous glucose concentrations of, on average, 5 to 10% that can vary depending on the glucose rate of change. While arterialized-venous samples are also drawn from the vein, they undergo different pre-analytical handling by warming the arm or hand where the blood is drawn. In a recent study, 13 the difference between capillary and venous glucose concentrations was +5.9%, which could be reduced to +4.2% by applying heat to the arm. As a result, the observed CGM performance was different when using venous, arterialized-venous, or capillary glucose concentrations. 13 The bias of the investigated CGM system was approximately +2% when comparing against venous comparator samples, +0% against arterialized-venous comparator samples, and -4% against capillary comparator samples. This resulted in mean absolute relative difference (MARD) results of approximately 7.5% (venous comparator samples), 7% (arterialized-venous comparator samples), and 8% (capillary comparator samples).
It is, therefore, imperative to standardize the origin of samples for comparator measurements in CGM performance studies. Table 1 summarizes advantages and disadvantages of the different sample origins. It should be noted that the selection of sample origin and the selection of comparator measurement method affect each other.
Summary of Sample Origins With Associated Advantages and Disadvantages.
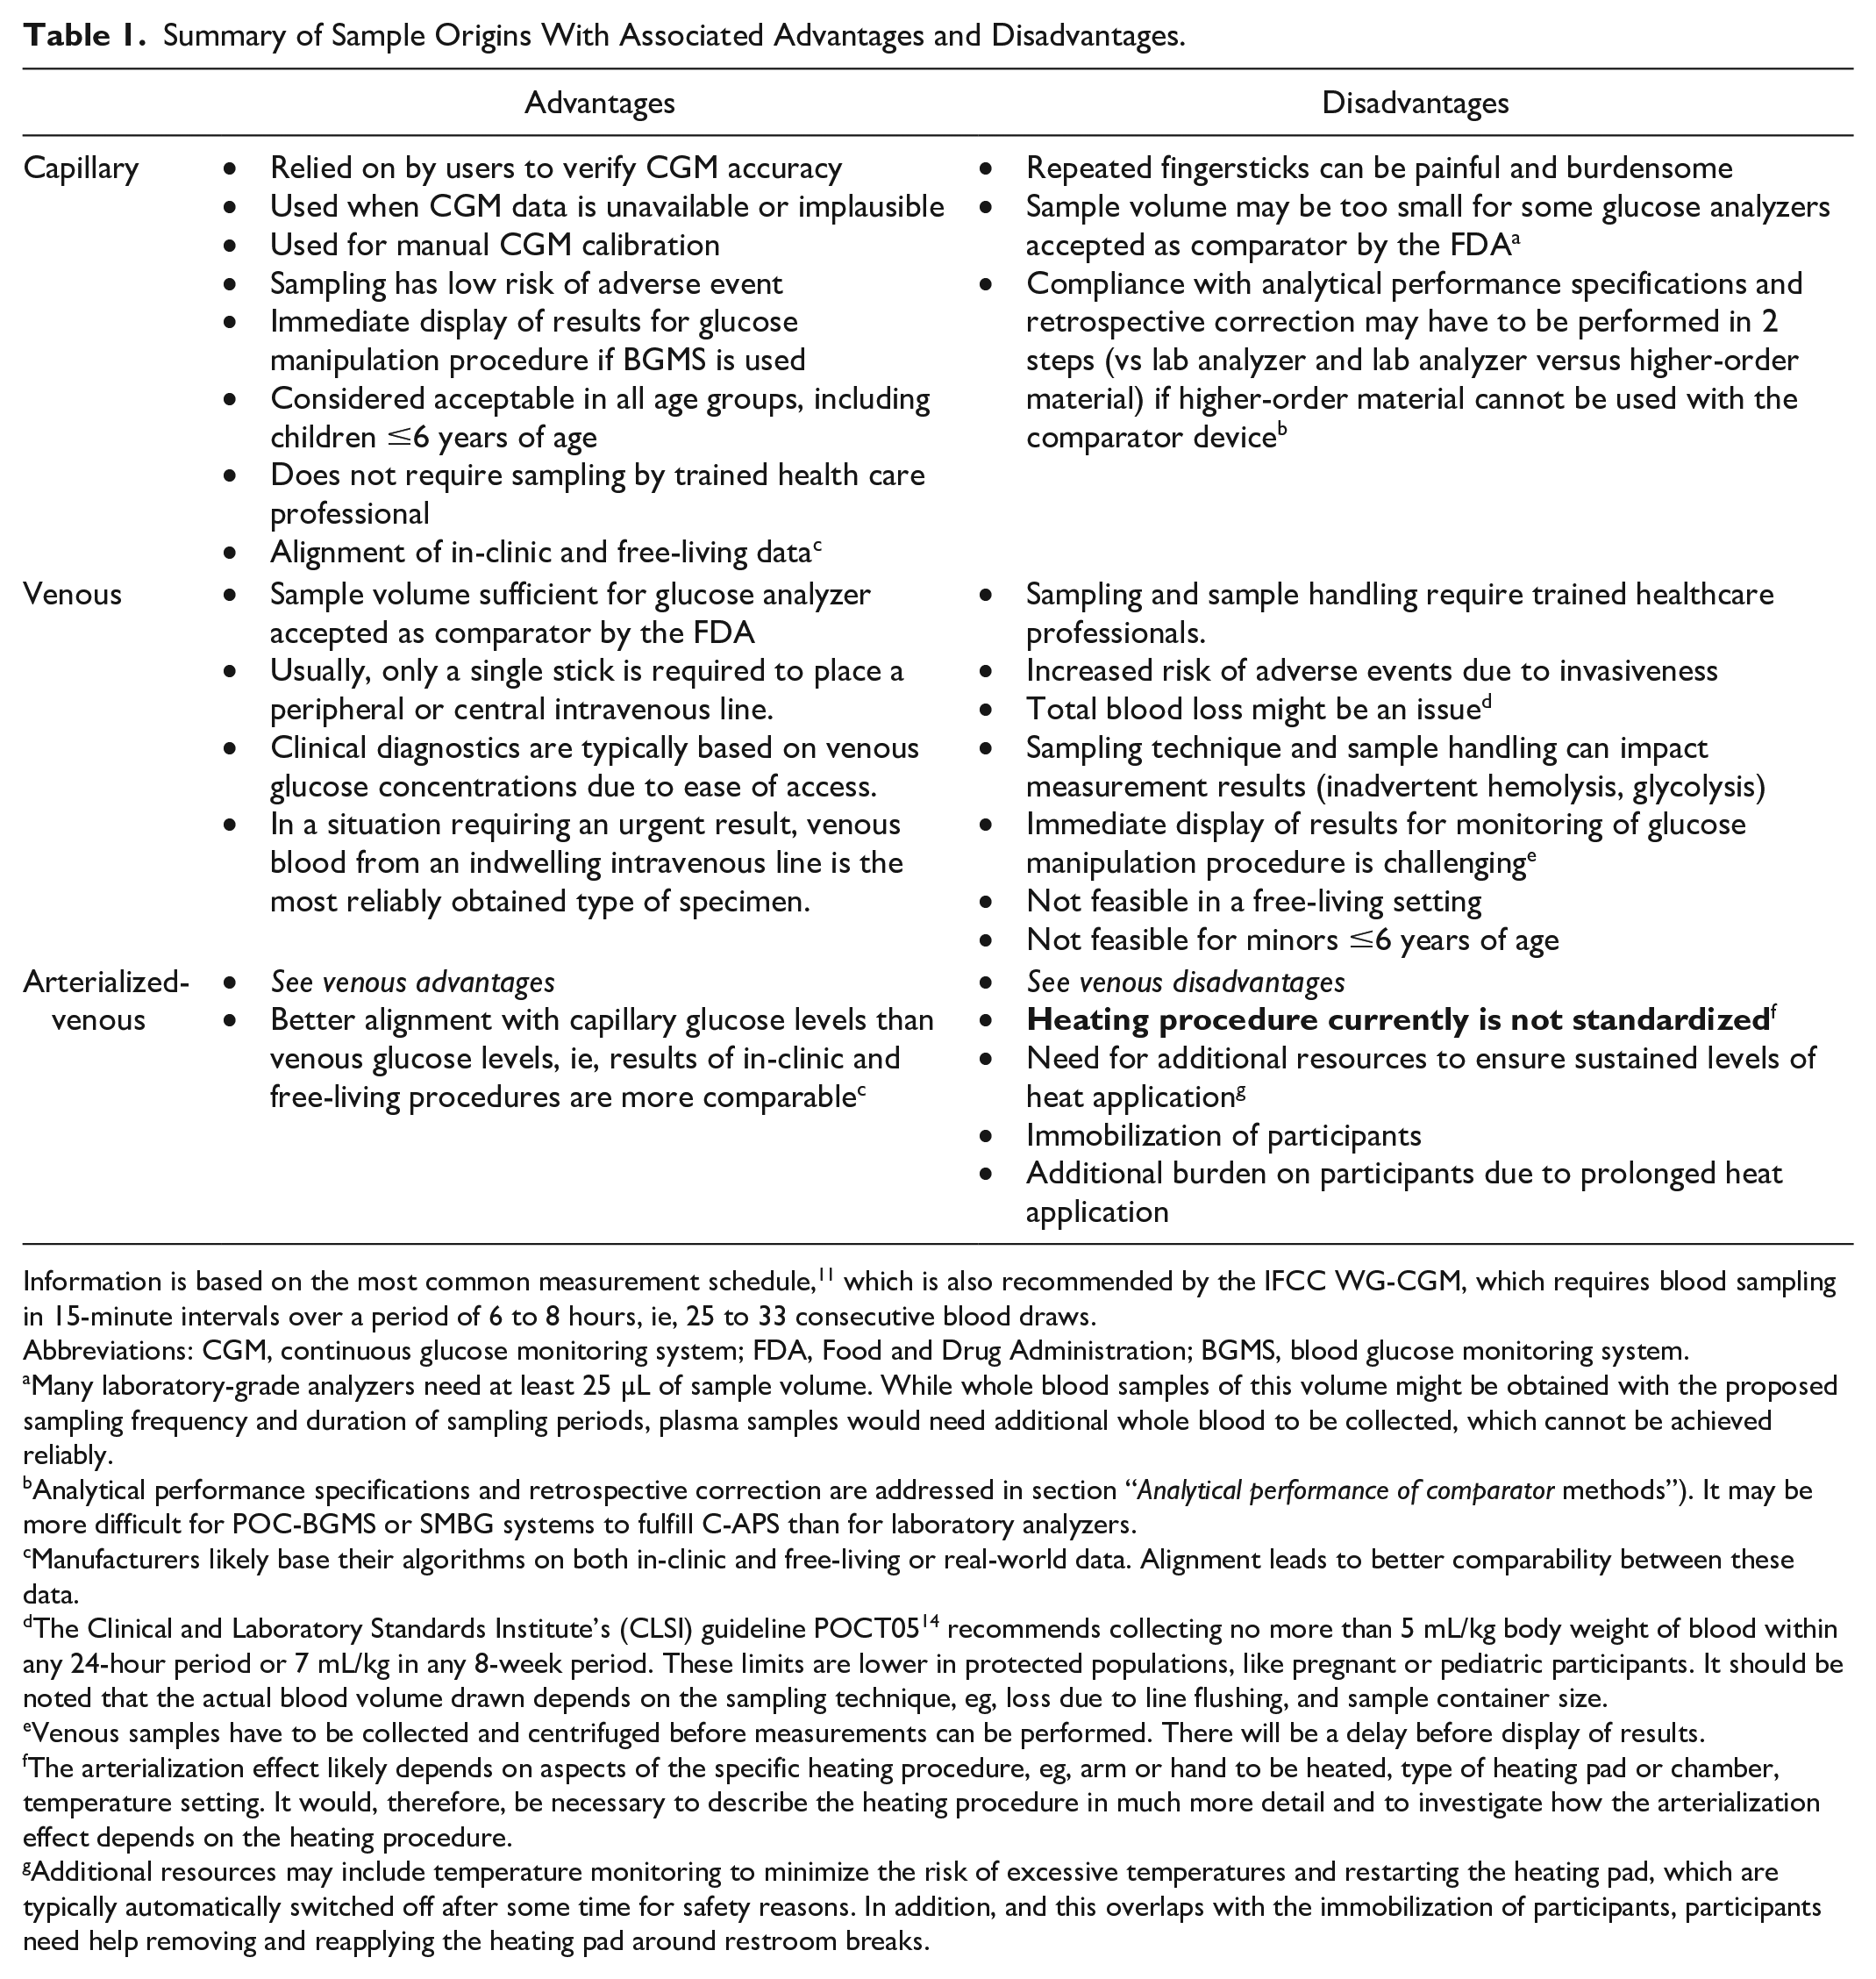
Information is based on the most common measurement schedule, 11 which is also recommended by the IFCC WG-CGM, which requires blood sampling in 15-minute intervals over a period of 6 to 8 hours, ie, 25 to 33 consecutive blood draws.
Abbreviations: CGM, continuous glucose monitoring system; FDA, Food and Drug Administration; BGMS, blood glucose monitoring system.
Many laboratory-grade analyzers need at least 25 µL of sample volume. While whole blood samples of this volume might be obtained with the proposed sampling frequency and duration of sampling periods, plasma samples would need additional whole blood to be collected, which cannot be achieved reliably.
Analytical performance specifications and retrospective correction are addressed in section “Analytical performance of comparator methods”). It may be more difficult for POC-BGMS or SMBG systems to fulfill C-APS than for laboratory analyzers.
Manufacturers likely base their algorithms on both in-clinic and free-living or real-world data. Alignment leads to better comparability between these data.
The Clinical and Laboratory Standards Institute’s (CLSI) guideline POCT05 14 recommends collecting no more than 5 mL/kg body weight of blood within any 24-hour period or 7 mL/kg in any 8-week period. These limits are lower in protected populations, like pregnant or pediatric participants. It should be noted that the actual blood volume drawn depends on the sampling technique, eg, loss due to line flushing, and sample container size.
Venous samples have to be collected and centrifuged before measurements can be performed. There will be a delay before display of results.
The arterialization effect likely depends on aspects of the specific heating procedure, eg, arm or hand to be heated, type of heating pad or chamber, temperature setting. It would, therefore, be necessary to describe the heating procedure in much more detail and to investigate how the arterialization effect depends on the heating procedure.
Additional resources may include temperature monitoring to minimize the risk of excessive temperatures and restarting the heating pad, which are typically automatically switched off after some time for safety reasons. In addition, and this overlaps with the immobilization of participants, participants need help removing and reapplying the heating pad around restroom breaks.
While glucose concentrations also depend on the sample matrix (ie, whole blood, plasma, serum), whole-blood glucose concentrations can be converted to plasma-equivalent values so that any remaining differences are negligible. 15 However, it must be noted that a conversion factor is only an approximation and the individual association between whole-blood and plasma glucose may be influenced by other factors, like hematocrit and illness.16,17 Measurement of glucose concentrations in serum is inadequate in the context of comparator data in CGM performance studies due to glycolysis.
Recommendation for Sample Origin
The majority of WG-CGM members recommend capillary samples to be the preferred sample origin in CGM performance studies. Since capillary self-monitoring is supplemented by adjunctive CGM systems and the fallback/verification option for nonadjunctive CGM systems, using capillary comparator samples would optimize the clinical alignment of CGM readings and self-monitoring of blood glucose (SMBG) concentrations. The IFCC WG-CGM viewed this alignment as more important for end-users than the alignment of CGM readings to venous glucose concentrations, which are used in the diagnosis of diabetes and for diabetes management in healthcare settings. However, the IFCC WG-CGM acknowledges that during the development of a future international standard, which is an aim of the IFCC WG-CGM, the sample type must be discussed with different stakeholders like diabetologists, regulatory authorities, and CGM manufacturers.
Analytical Performance of Comparator Methods
Background Information
The consistent analytical performance of comparator methods is essential in CGM performance studies not only to optimize comparability of results between studies, but also because the comparator is assumed to be free from error. For an accuracy metric like measurement bias between a CGM system and a comparator to be meaningful, there is an assumption that the comparator indicates the “true” glucose value. In reality, however, any measurements, including comparator measurements, are affected by different sources of error. Untangling comparator and CGM error is not feasible. Any inaccuracies of the comparator will affect the performance of a CGM system as observed in a study, and so will any differences in comparator method across different studies.
Of course, comparators must be used in compliance with device labeling and applicable legal requirements. Still, comparators can exhibit measurement bias of up to 8% depending on the measurement method.18,19 In addition, more than 5% bias between individual devices of the same brand can exist.20,21 Analytical performance of comparators can be optimized by requiring that comparator methods have established metrological traceability with defined analytical performance specifications. These specifications are called “analytical performance specifications for comparators” (C-APS) here to avoid confusion with minimum requirements for CGM performance. C-APS comprise bias and imprecision. C-APS can be defined based on biological variation.22,23
It may be more difficult for POC-BGMS or SMBG systems to fulfill C-APS than for laboratory analyzers, although it has been shown that they can satisfy the C-APS.20,24 Furthermore, they may not be recognized by all regulatory bodies. The FDA, eg, stated in the past that they only recognize “laboratory-based methods.” 25 In the European Union, however, a CGM system gained CE marking based on capillary comparator data obtained with an SMBG system. 26
As long as the comparator is used within the intended use and performs within C-APS, the specific brand or type of device (laboratory analyzer, POC-BGMS or SMBG system) is irrelevant, especially if bias is minimized through retrospective correction. It should be noted that compliance with C-APS does not reflect potentially interfering substances. The effect of interfering substances on laboratory analyzers, POC-BGMS, and SMBG systems typically increases in that order, although it depends on the specific brand. This could limit the choice of the comparator in CGM performance studies.
Assessment of Measurement Bias
Bias is defined as the estimate of a systematic difference between methods. In the context of comparators, bias should be assessed using a method or materials of higher metrological order. The higher metrological order associated with these methods and materials implies that corresponding measurement results and assigned target values, respectively, are closer to the “true” glucose concentration than the measurement results obtained with the comparator. An IDMS-based method could constitute a method of higher metrological order if a laboratory analyzer is selected as comparator, and bias could be verified with a split-sample approach, where comparator samples are split into 2 aliquots, 1 for the comparator and 1 for the higher-order method. If professional-use point-of-care (POC) blood glucose monitoring systems (BGMS) or “over the counter” systems for SMBG are used as comparator, then an additional step by way of, eg, a laboratory analyzer may be required if materials of higher order are used to assess bias, but do not fall within the intended use of the POC-BGMS or SMBG system. In case higher-order materials are used, they are ideally independent from the manufacturer of the selected device. For example, the serum-based Standard Reference Material 965 (National Institute of Standards and Technology, Gaithersburg, MD) could serve as a material of higher metrological order if the samples are commutable when measured with the specific comparator. The steps associated with bias verification are shown in Figure 1.
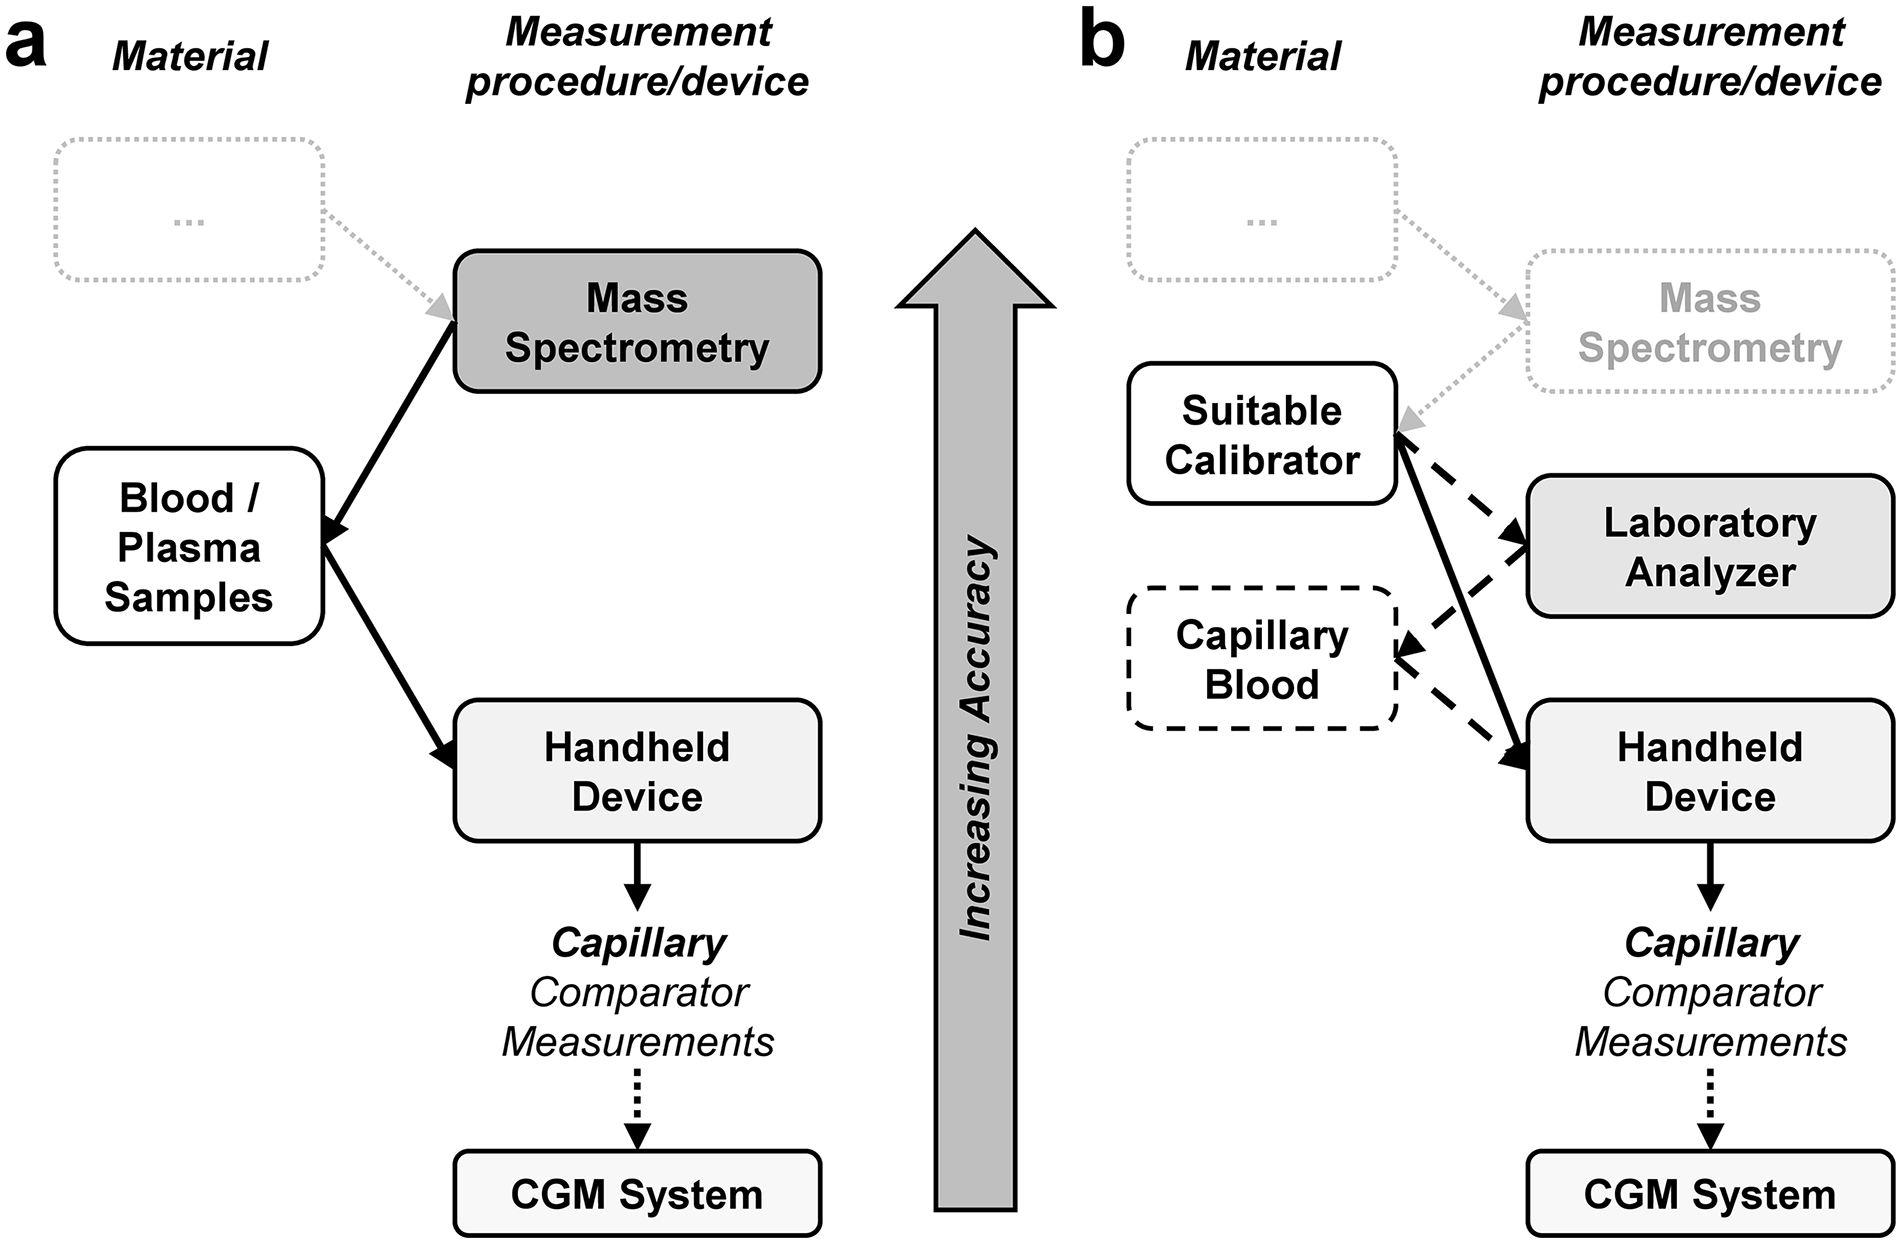
Example of a traceability chain when estimating bias. Panel (a) Estimation based on methods of higher metrological order. If participant blood/plasma samples are used to verify the comparator method bias, potential commutability issues can be avoided. Panel (b) Estimation based on materials of higher metrological order (“suitable calibrator”). When using capillary comparator measurements, an additional step (indicated by dashed lines and boxes) by way of, eg, a laboratory analyzer (or other suitable analyzers) may be required if the comparator device is not labeled for use with the sample type of the higher-order materials. The “suitable calibrator” is any material with sufficiently well-characterized assigned target concentrations, eg, secondary certified reference materials as defined by ISO 17511. Light gray boxes and dotted lines indicate parts of the traceability chain that are outside of the purview of bias estimation in a CGM performance study. Device types in the columns “measurement procedure/device” are based on what is often used in CGM performance studies. 12 Note that the step between the comparator and the CGM systems is missing because CGM systems measure glucose concentrations in interstitial fluid, where comparator or reference measurements are currently not feasible. Similar traceability chains can be established for other sample origins.
Commutability of the samples used for bias verification is important. In lay-person’s terms, commutability means that the higher-order materials behave like participant samples (whole blood or plasma) in both the method used to assign the target concentrations and the comparator method used in the performance study. Therefore, participant samples in a split-sample approach are commutable by definition, whereas commutability of other samples may have to be verified in advance.
Recommendations for the Assessment and Correction of Bias
Bias toward the higher-order method’s measurement results or assigned concentrations of the higher-order materials is used to verify the C-APS. Due to potential variation of bias over time, measurements with higher-order methods or materials should be performed sufficiently often, eg, on every in-clinic day of a CGM performance study. They should cover the relevant glucose concentration range. Calibrator or reagent batch changes should be scheduled outside of the performance study’s timeframe; otherwise, bias should be assessed using a sufficient amount of data for each combination of calibrator and reagent batch. The C-APS requirement for bias is defined as bias ≤2.1%. 23 Retrospective correction of comparator bias (sometimes also called “recalibration”) should be used if the bias criterion is not met. 20 The IFCC WG-CGM recommends retrospective correction even if the bias criterion is met to further minimize differences between individual studies and between individual devices, if more than 1 comparator device is used in a study (eg, in a multi-center study).
Assessment of Measurement Imprecision
Imprecision can, eg, be measured as the coefficient of variation (CV) of replicates from the same sample and pooled across all samples when there is no device drift, there are no changes in the device (like reagent or calibrator batch changes), and when the samples do not contain varying levels of interfering substances. In contrast to bias, it is not possible to minimize CV retrospectively. Imprecision of a potential comparator should, therefore, be assessed beforehand to minimize the risk of using an inadequate comparator. Imprecision of the comparator in a CGM performance study can be estimated from measuring replicates, eg, duplicates, in each participant sample, and the average of these replicates can be used as comparator value. For a series of duplicate measurements, calculation of SD or CV is outlined using the “Dahlberg” formula by Kallner and Theodorsson. 27 The Dahlberg formula calculates the repeatability within series. Repeatability is different from the reproducibility between series, which is obtained by repeated measurements over many days of the same sample. Staying with the example of duplicate measurements, the effective imprecision of the comparator results when using averages of these duplicates can then be estimated from the standard error of the mean, ie, CV is divided by the square root of the number of replicates.
For duplicate measurements, the effective imprecision, expressed as effective CV, can be estimated as

where xi,1 and xi,2 are the measurement results of the first and second replicate, respectively, and N is the total number of duplicates.
Imprecision can also be estimated from measurements with higher-order materials. If a split-sample comparison with a higher-order method is performed, multiple replicates are required.
Recommendations for the Assessment of Imprecision
The IFCC WG-CGM recommends that participant samples in the CGM performance study are measured in at least duplicates to allow estimation of imprecision as well as outlier detection.20,27 The average of these (at least) duplicates should be used as comparator value to reduce the impact of imprecision. The C-APS requirement for imprecision is CV ≤2.4%. 23 Ideally, imprecision is characterized in advance to minimize the risk of inadequate imprecision in a CGM performance study.
Practical Application of Analytical Performance Specifications for Comparators
Recently, a CGM performance study (German Clinical Trials Register, ID DRKS00033697) was conducted. Here, both capillary and venous blood samples were collected for comparator measurements during frequent sampling periods, ie, 7-hour periods where blood was sampled every 15 ± 5 minutes. Cobas Integra 400 plus (INT; Roche Diagnostics GmbH, Mannheim, Germany) and, in total, 3 different YSI 2300 STAT Plus (YSI; YSI Incorporated, Yellow Springs, OH, USA) devices were used to obtain venous comparator data, and Contour Next (CNX; Ascensia Diabetes Care Holdings AG, Basel, Switzerland) was used to obtain capillary comparator data. Additional capillary measurements were performed twice per frequent sampling period with YSI and INT. Results from YSI devices were pooled since measurements from any given sample were only performed on 1 YSI device. Multiple YSI devices were used for feasibility reasons, as there were more venous samples on each in-clinic day than a single YSI device could have processed.
To assess and to allow for retrospective correction of bias of INT and YSI, 184 participant samples were sent in a split-sample approach for measurements with a spectrophotometric hexokinase-based method (Cobas pro [CBP]; Roche Diagnostics GmbH). The CBP was calibrated with the manufacturer’s master calibrator, thus being of higher metrological order than INT and YSI, which were calibrated with marketed, ie, end user, product calibrators. CBP’s expanded measurement uncertainty (k = 2) was reported as 3.5%, with negligible bias when compared regularly against IDMS. Bias of CNX was assessed based on the capillary measurements with INT and YSI and retrospectively corrected based on corrected INT and YSI results, respectively. There were slight differences in CNX measurement results depending on whether CNX was corrected retrospectively based on INT or YSI results. However, these were acceptably small and CNX’s bias was in both cases substantially lower after retrospective correction. If venous samples had not been collected in this study, then CBP could have been used as easily with capillary samples so that the traceability chain of Figure 1a would apply. Imprecision was estimated from the duplicate glucose measurements for all comparators.20,27 Compliance with C-APS is shown in Table 2.
Adherence With Analytical Performance Specifications for Comparators (C-APS).
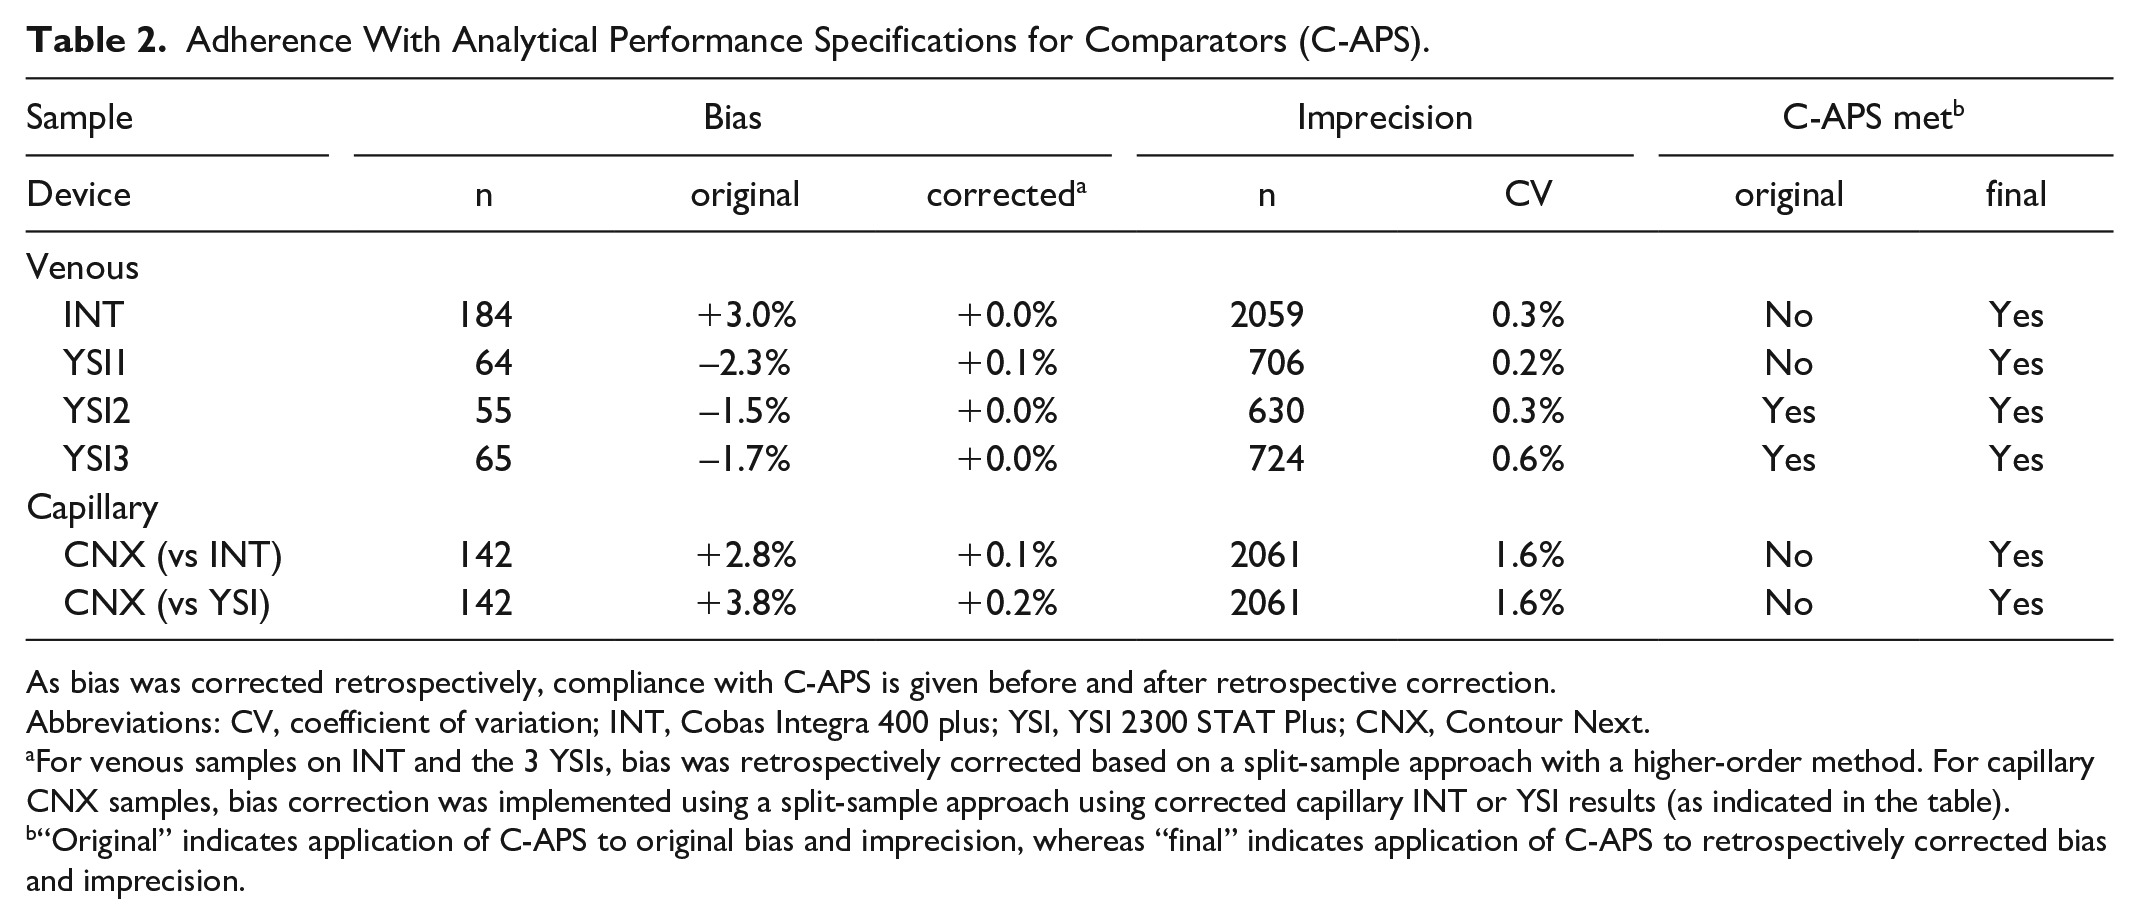
As bias was corrected retrospectively, compliance with C-APS is given before and after retrospective correction.
Abbreviations: CV, coefficient of variation; INT, Cobas Integra 400 plus; YSI, YSI 2300 STAT Plus; CNX, Contour Next.
For venous samples on INT and the 3 YSIs, bias was retrospectively corrected based on a split-sample approach with a higher-order method. For capillary CNX samples, bias correction was implemented using a split-sample approach using corrected capillary INT or YSI results (as indicated in the table).
“Original” indicates application of C-APS to original bias and imprecision, whereas “final” indicates application of C-APS to retrospectively corrected bias and imprecision.
To illustrate the impact of bias on observed CGM performance, MARD results, 20%/20 agreement rates (ARs), ie, percentages of CGM readings found within ±20% of paired comparator results ≥100 mg/dL and within ±20 mg/dL of paired comparator results <100 mg/dL, and bias (mean relative difference) were calculated for one of the CGM systems investigated in the study mentioned above before and after recalibration (Table 3).
Mean absolute relative difference (MARD), 20%/20 agreement rates (AR), ie, percentages of CGM readings found within ±20% of paired comparator results ≥100 mg/dL and within ±20 mg/dL of paired comparator results <100 mg/dL, and bias (mean relative difference) for a current-generation CGM system.
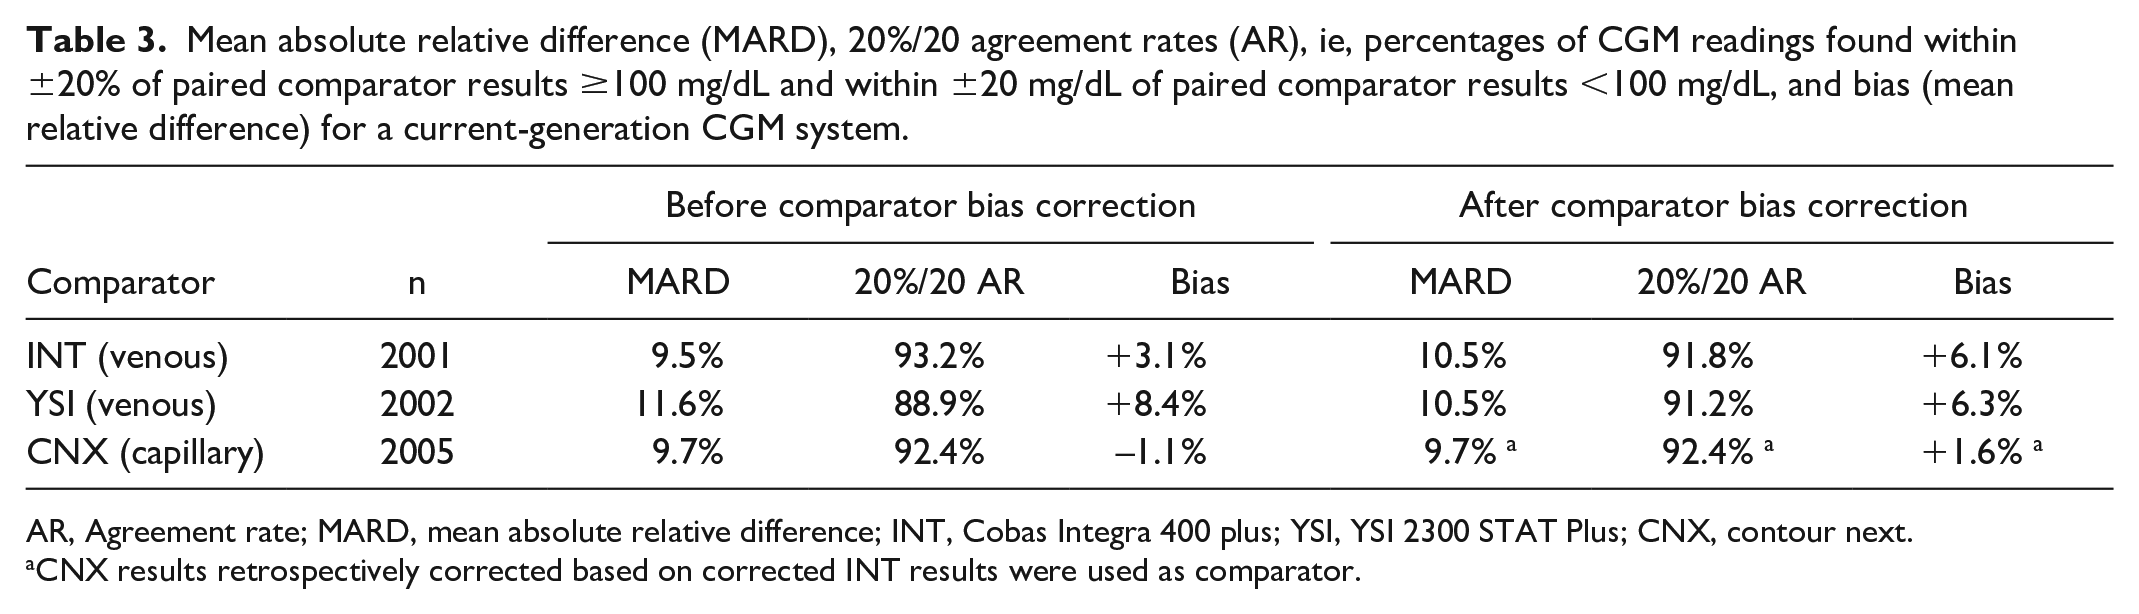
AR, Agreement rate; MARD, mean absolute relative difference; INT, Cobas Integra 400 plus; YSI, YSI 2300 STAT Plus; CNX, contour next.
CNX results retrospectively corrected based on corrected INT results were used as comparator.
Before retrospective correction of comparator bias, there were substantial differences in the observed CGM performance depending on the venous comparator (INT vs YSI). Correction of comparator bias eliminated the 2.1% MARD difference, reduced the approximately 4% difference in 20%/20 agreement rate, and reduced the difference in bias between the CGM system and the comparator from 5.3% to 0.2%. The differences in the original data could be viewed as relevant from both clinical and marketing perspectives despite being caused by the selection of the comparator and not being a property of the CGM system itself. When using the capillary CNX measurements as comparator, marked differences compared with venous results were found after retrospective correction of comparator bias, whose order of magnitude matches the capillary-to-venous differences in comparator glucose concentrations found in a recent study. 13
Summary and Outlook
In CGM performance studies, CGM readings are compared with values obtained with a comparator measurement procedure, whose description comprises comparator device, measurement method, and sample type. Different comparator methods have demonstrated biases of up to 8%,18,19 different comparator devices of the same brand can systematically differ, on average, by more than 5%,20,21 and concentrations in capillary and venous samples are physiologically different (often reported as 5 to 10% difference, sometimes more). 13
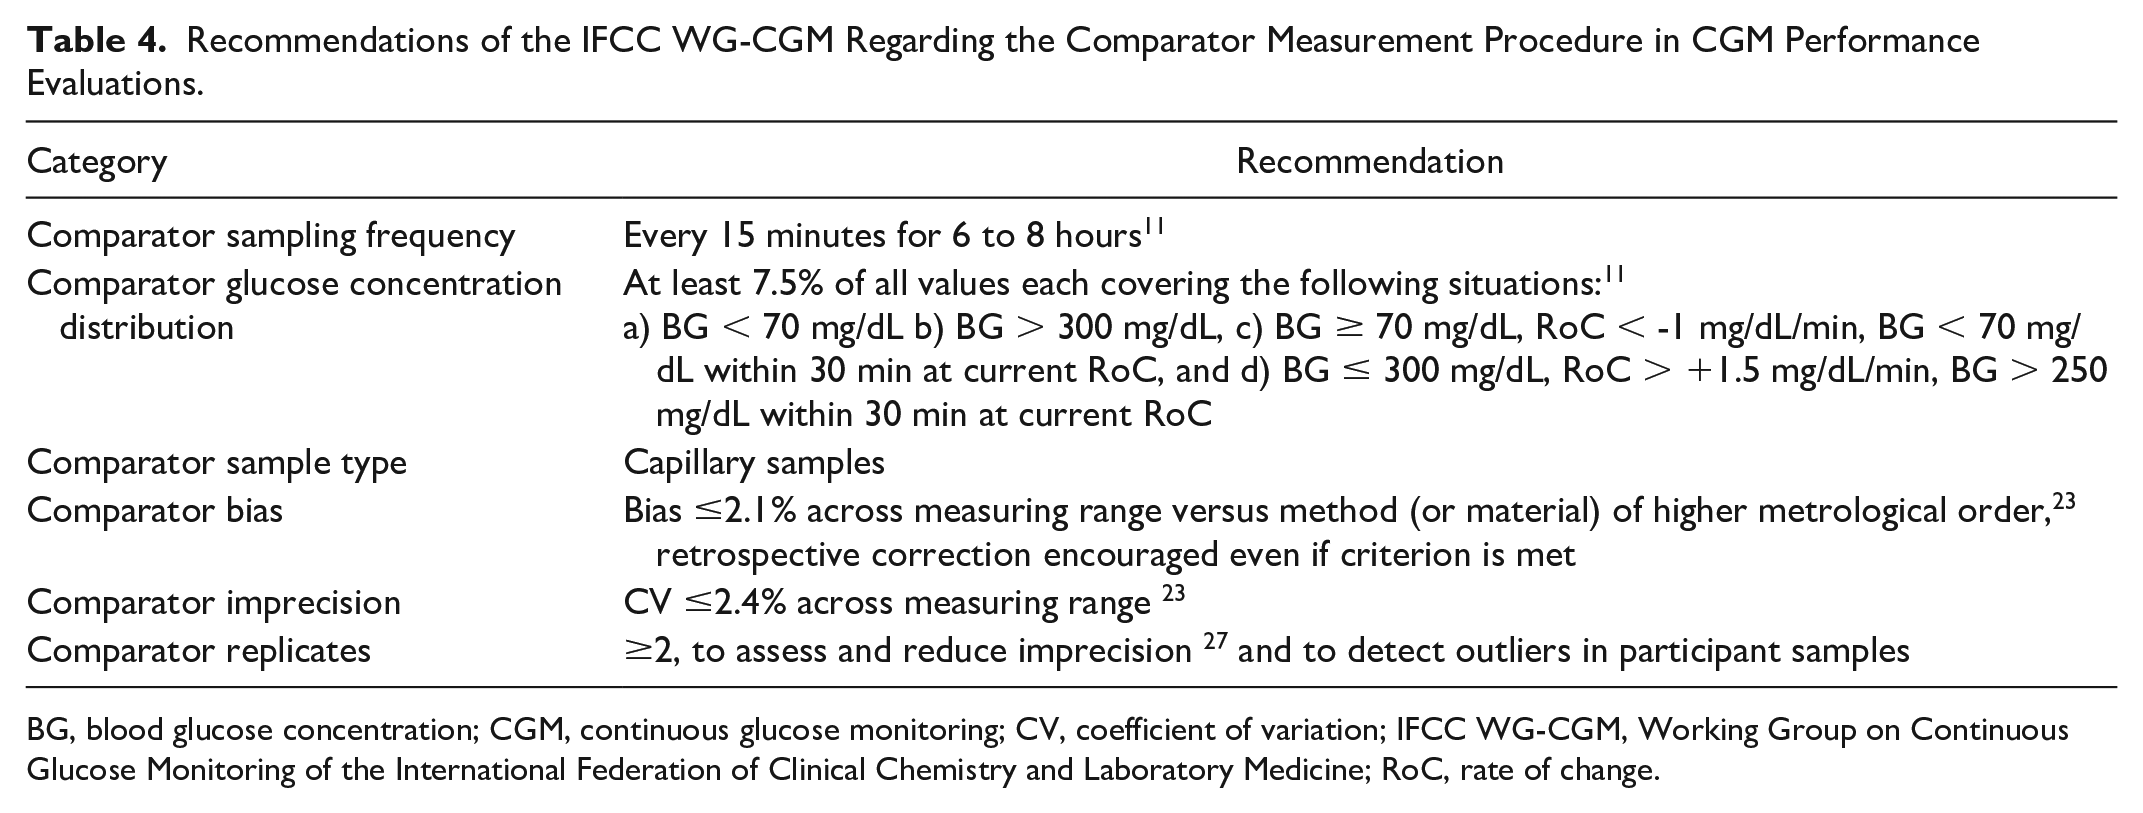
The IFCC WG-CGM, therefore, recommends standardizing the comparator measurement procedure (Table 4). Previous recommendations were adopted. 11 Specifically, comparator measurements should be performed every 15 minutes for 6 to 8 hours during in-clinic sessions, and comparator data should exhibit certain characteristics, ie, distribution of glucose concentrations and rates of change. 11 Furthermore, the use of capillary samples is recommended, mainly because CGM readings should align better with results from SMBG, which must be performed in some situations by people with diabetes: (1) some CGM systems require periodic manual calibration, (2) CGM systems typically require confirmation of very high or very low CGM readings, (3) SMBG is advised if symptoms do not match CGM readings, and (4) SMBG is the fallback option if CGM readings are not available, eg, during warm-up or malfunction. For the comparator device and method, C-APS should be met; specifically, bias ≤2.1% and imprecision ≤2.4% 23 Bias between comparators can be reduced by retrospective correction of comparator values based on analysis with a method or materials of higher metrological order, 20 and correction is encouraged even if the bias criterion is met. Comparator samples should be measured in duplicate and the averages should be used as the comparator result to improve imprecision of comparator results as well as to enable outlier detection.
Recommendations of the IFCC WG-CGM Regarding the Comparator Measurement Procedure in CGM Performance Evaluations.
BG, blood glucose concentration; CGM, continuous glucose monitoring; CV, coefficient of variation; IFCC WG-CGM, Working Group on Continuous Glucose Monitoring of the International Federation of Clinical Chemistry and Laboratory Medicine; RoC, rate of change.
A common reference and use of standardized procedures in CGM performance studies will minimize discrepancies and ensure alignment between readings across CGM systems.
Footnotes
Acknowledgements
The authors would like to thank the Diabetes Center Berne and the International Federation of Clinical Chemistry and Laboratory Medicine for supporting this work. Furthermore, the authors thank Dr Delia Waldenmaier and Dr Stephanie Wehrstedt for their review of this article.
This article is co-published in the Journal of Diabetes Science and Technology (DOI: 10.1177/19322968251336221) and the electronic Journal of the International Federation of Clinical Chemistry and Laboratory Medicine. The duplication of the article in eJIFCC has been permitted by JDST.
Abbreviations
AR, agreement rate; BGMS, blood glucose monitoring system; C-APS, analytical performance specifications for comparators; CBP, Cobas pro; CGM, continuous glucose monitoring; CLSI, Clinical and Laboratory Standards Institute; CNX, contour next; CV, coefficient of variation; FDA, Food and Drug Administration; IDMS, isotope dilution-mass spectrometry; IFCC WG-CGM, Working Group on Continuous Glucose Monitoring of the International Federation of Clinical Chemistry and Laboratory Medicine; INT, Cobas Integra 400 plus; MARD. mean absolute relative difference; POC, point-of-care; SD, standard deviation; SMBG, self-monitoring of blood glucose; YSIYSI 2300 STAT Plus.
Declaration of Conflicting Interests
The author(s) declared the following potential conflicts of interest with respect to the research, authorship, and/or publication of this article: GF is general manager and medical director of the Institut für Diabetes-Technologie Forschungs- und Entwicklungsgesellschaft mbH an der Universität Ulm; Germany (IfDT), which carries out clinical studies on its own initiative and on behalf of various companies. GF/IfDT have received speakers’ honoraria or consulting fees in the last 3 years Abbott, Berlin Chemie, Boydsense, Dexcom, Glucoset, i-SENS, Lilly, Menarini, Novo Nordisk, Perfood, Pharmasens, Roche, Sinocare, Terumo, and Ypsomed.
SP and ME are employees of IfDT.
EEB has no disclosures.
MF received lecture fees from Menarini.
RH—Independent medical & scientific consultant, former employee of Roche Diabetes Care
JJ has been a lecturer/member of the scientific advisory boards at the following companies: Abbott, AstraZeneca, Boehringer Ingelheim, Eli Lilly, Medtronic, Nordic InfuCare, NovoNordisk, and Sanofi.
DCK is a consultant for Afon, Better Therapeutics, Integrity, Lifecare, Nevro, Novo, Samsung, and Thirdwayv.
KM has nothing to disclose.
JHN has received research support from Abbott.
JP—Advisory panel for ROCHE Diabetes Care and Abbott. Speaker fees from Insulet and Dexcom.
ES is supported by grants from the US National Institutes of Health (NIH) and has received donated materials related to NIH-supported research from Abbott Diabetes Care, Roche Diagnostics, Siemens Diagnostics, Ortho Clinical Diagnostics, Abbott Diagnostics, Asahi Kasei Pharma Corp, GlycoMark Corp
NKT is a consultant for Roche Diagnostics and Roche Molecular Systems, received honoraria from Nova Biomedical and Thermo Fisher, and Chair (2024–2026), Critical and Point-of-Care Testing (CPOCT) Division, Association for Diagnostics and Laboratory Medicine (ADLM).
LW has nothing to disclose.
RJS is chair of the Clinical Chemistry Department of Isala which carries out clinical studies, eg, with medical devices for diabetes therapy on its own initiative and on behalf of various companies. RJS has received speaker’s honoraria or consulting fees in the last 3 years from Roche and Menarini.
Funding
The author(s) disclosed receipt of the following financial support for the research, authorship, and/or publication of this article: The work and the associated scientific writing activities were financially supported by the Diabetes Center Berne.