
Abstract
Background:
The emergence of continuous glucose monitoring (CGM) devices has not only revolutionized diabetes management but has also opened new avenues for research. This article presents a novel approach to encoding a CGM daily profile into a CGM string and CGM text that preserves clinical metrics information but compresses the data.
Methods:
Eight alphabets were defined to represent glucose ranges. The Akaike information criterion (AIC) was derived from error, and the compression ratio was estimated for each alphabet to determine the optimal alphabet for encoding the CGM daily profile. The analysis was done with data from six distinct studies, with different treatment modalities, applied to individuals with type 1 diabetes (T1D) or type 2 diabetes (T2D), and without diabetes. The data set was divided into 70% for training and 30% for validation.
Result:
The result from the training data reveals that a 9-letter alphabet was optimal for encoding daily CGM profiles for T1D or T2D, yielding the lowest AIC score that minimizes information loss. However, in health, fewer letters were needed, and this is to be expected, given the lower variation of the data. Further testing with the Pearson correlation showed that the 9-letter alphabet approximated the coefficient of variation, with correlations between 0.945 and 0.965.
Conclusion:
Encoding CGM data into text could enhance the classification of CGM profiles and enable the use of well-established search engines with CGM data. Other potential applications include predictive modeling, anomaly detection, indexing, trend analysis, or future generative artificial intelligence applications for diabetes research and clinical practice.
Introduction
The emergence of continuous glucose monitoring (CGM) devices has not only revolutionized diabetes management but has also opened new avenues for research, such as advanced classification of diverse therapeutic approaches and patient cohorts,1,2 innovative data-driven methodologies for predicting glucose dynamics, 3 categorization of CGM patterns,4,5 and various applications of machine learning techniques.6,7 The T1D Exchange, in a quality improvement collaborative network of over 40 type 1 diabetes (T1D) clinics in the United States, recorded a remarkable increase in the use of CGM technology among patients with T1D surging from 59% in 2016 to 72% in 2021. 8 A similar trend is observed globally, involving T1D and type 2 diabetes (T2D) populations. 9
The CGM data are commonly presented to patients and health care professionals as an Ambulatory Glucose Profile (AGP) accompanied by aggregated glycemic metrics. The AGP representation displays the median glucose value, the 25th and 75th percentiles, the lower and upper deciles, and the percentage of time spent in various glucose ranges to summarize glucose data.10,11 This method allows for easy comparison of glucose data over time and between individuals. Advanced time-series data representations have been proposed for analysis, such as singular value decomposition, 12 piecewise aggregate approximation, 13 and symbolic aggregate approximation. 14
Systematic representation of CGM traces has been considered to emphasize the description of the patterns corresponding to some numerical measures, or response to treatment; for example, to illustrate the effect of therapy observed via CGM 72-h glucose traces pre- and four weeks post-islet transplantation, the aggregated process is depicted by squares that are red for hypoglycemia, green for the target range, and yellow for hyperglycemia.15,16 Similarly, the percentages of time spent within, below, or above pre-set target limits would indicate the general behavior of CGM fluctuations. 17 Furthermore, single patterns have been used to describe CGM traces, eg, a data-driven approach to determine a finite set of representative daily profiles (motifs) such that almost any daily CGM profile generated by a patient can be matched to one of the motifs.18,19 This paradigm was markedly different from traditional classification and monitoring methods based on standard glycemic metrics.20,21
One way to effectively harness large amounts of CGM data is a data transformation aggregating CGM traces to a reduced alphabet-descriptive size while retaining important clinical characteristics and performing further analysis. Because text processing is very advanced, alphabet CGM representation is expected to facilitate data indexing and reduce search time for strings with particular glycemic meaning. Computation complexity would be reduced as well, by using text-based data structures and machine learning algorithms for personalized therapeutic strategies and refined diabetes management paradigms. Besides technological advantages, encoding CGM profiles holds significant potential for clinical care. Encoded CGM data into text-based formats enable a more standardized interpretation of glycemic patterns, facilitating informed clinical decision-making. Encoded CGM profiles can be seamlessly integrated into electronic health records and decision support systems, allowing health care providers to detect trends, such as excessive glycemic variability. Furthermore, this method supports efficient sharing of data across platforms, enhancing its utility for population-level studies, and longitudinal tracking of patient outcomes. Last but not least, text processing by artificial intelligence (AI) algorithms and large language models is very advanced; therefore, encoding CGM data into text opens possibilities for applying contemporary AI methods. In this context, it is particularly important to underscore that the major finding of this article—establishing an optimal length alphabet—is critical for all potential applications listed above.
Methods
In this article, we propose an approach for transforming a CGM trace into an alphabet representation using a glycemic hashing function visualized in Figure 1: The hashing function takes a CGM trace from a standardized 24-hour period, reflecting a full day of glucose monitoring and a categorical glycemic state, defined as a glucose range described with an alphabet, as input. It maps each value from the CGM trace to a letter in the alphabet to create a CGM-alphabet trace, hereby defined as CGM string. Consecutive occurrences of a similar letter in the CGM string are compressed to form a sequence of alphabet-number representation (where the number indicates the repetitions of the letter), hereby defined as CGM text. Figure 2 illustrates the connection between CGM trace, CGM string, and CGM text. The optimal alphabet for representing CGM trace is achieved by estimating the Akaike information criterion (AIC) from the error and the compression ratio. The encoded CGM string and corresponding CGM text can be utilized for advanced data analytics.
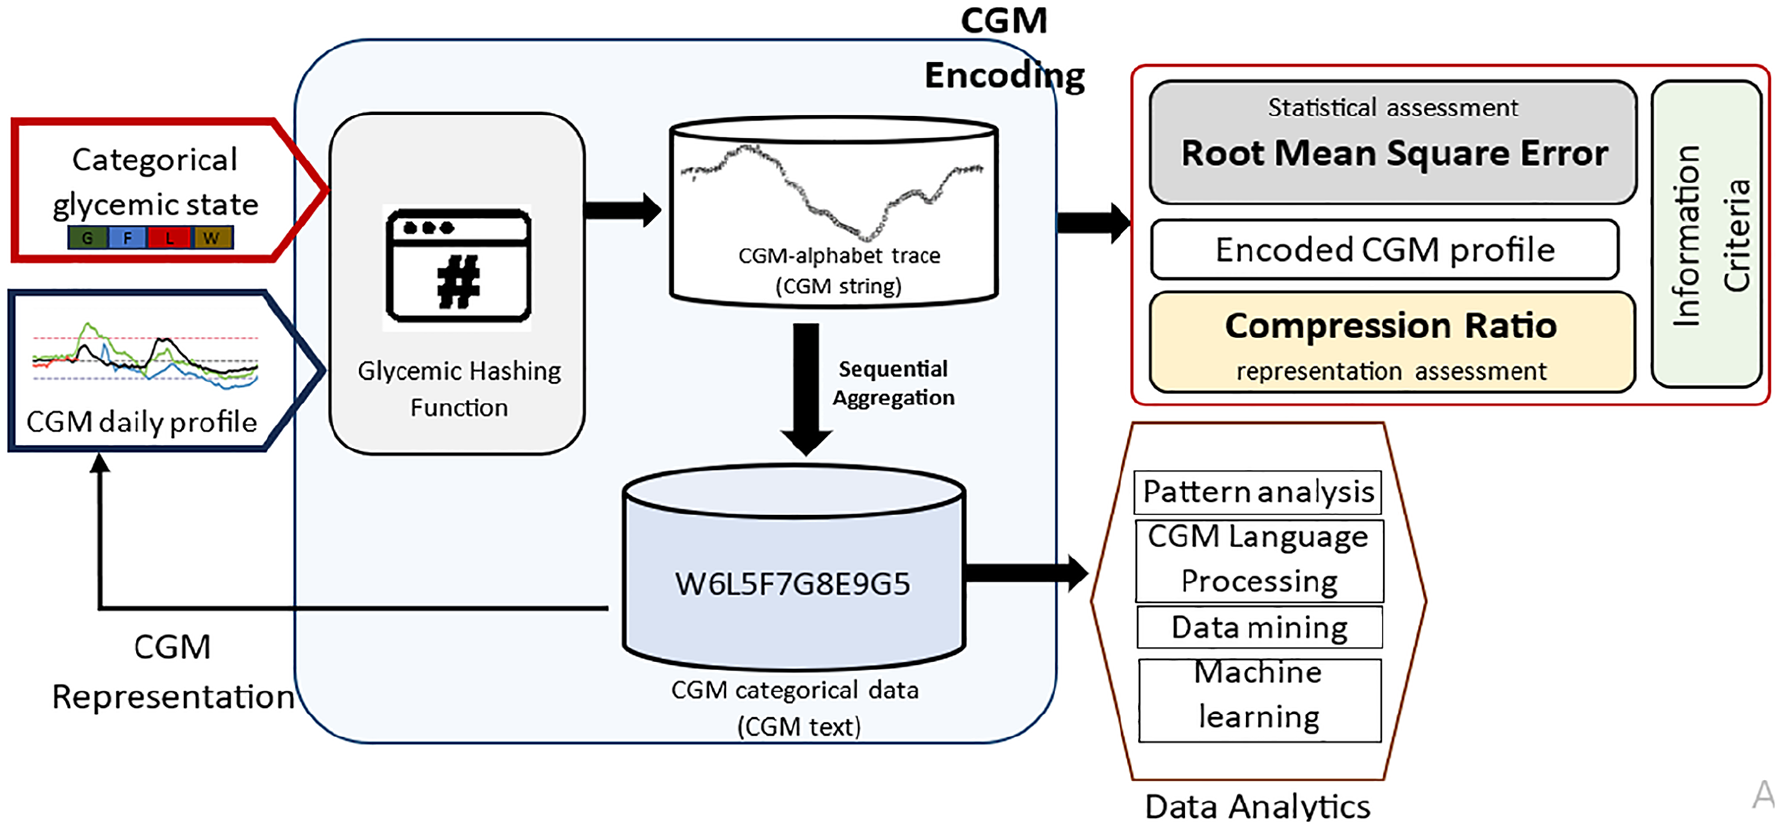
A systematic approach for transforming CGM profiles into discrete alphabet representations involves using a glycemic hashing function. This function takes a CGM profile and a categorical glycemic state defined as a glucose range described with an alphabet as input and produces an encoded CGM trace. The encoded CGM trace is analyzed using information criteria (balancing error and compression ratio) to determine the optimal length of the alphabet needed to encode the CGM profile. Repeated patterns in the encoded CGM can be compressed into letters and numbers for data analytics.
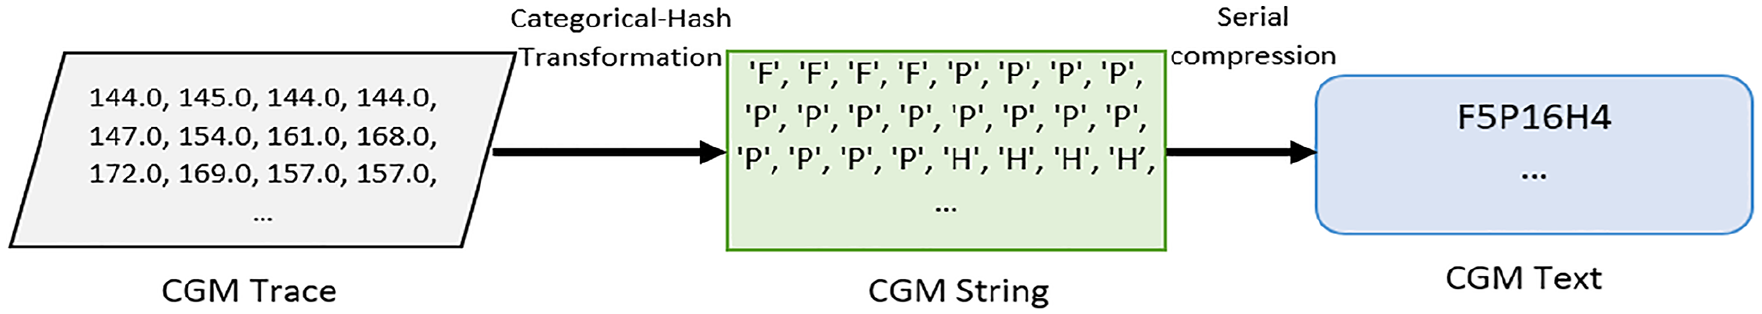
An example of a CGM string and CGM text evaluated from CGM Trace for a CGM profile. The CGM string is derived from CGM trace with a hash function, and The CGM text is derived from CGM string through serial compression.
Clinical Category Description
Furthermore, Figure 3 presents how a stratification of the glucose range corresponds to an alphabet. For example, a 4-letter alphabet corresponds to three glucose ranges: 70 to 180 mg/dL, glucose >180 mg/dL, and glucose <70 mg/dL, which are used to estimate time in range (TIR), time above range (TAR), and time below range (TBR) metrics, respectively.10,11 Further splitting is done to the glucose <70 mg/dL range to create 55 to 70 mg/dL and glucose <55 mg/dL ranges, which are considered for estimating the severity of hypoglycemia in the AGP report. Similarly, the glucose >180 mg/dL range is divided into 180 to 250 mg/dL and glucose >250 mg/dL ranges, which is considered for estimating the extent of hyperglycemia. Reports from the World Health Organization (WHO) and the American Diabetes Association (ADA) suggest that glucose >140 indicates prediabetes or diabetes after 2 hours of oral glucose tolerance test (OGTT).22,23 Similarly, fasting glucose >100 mg/dL denotes possible prediabetes or diabetes. 24 Precisely, fasting glucose between 100 and 126 mg/dL (approximately 100-130 mg/dL) indicates borderline (prediabetes).24,25 Also, it is reported that a glucose >200 mg/dL after OGTT after 2 hours is diagnosed as diabetes. 25 The glucose >250 mg/dL range is split at 300 mg/dL (extreme hyperglycemia), which indicates glucose with significant hyperglycemia occurring during a clinical trial. 17 Subsequent alphabets are derived based on these indications and reports on glucose measurements.
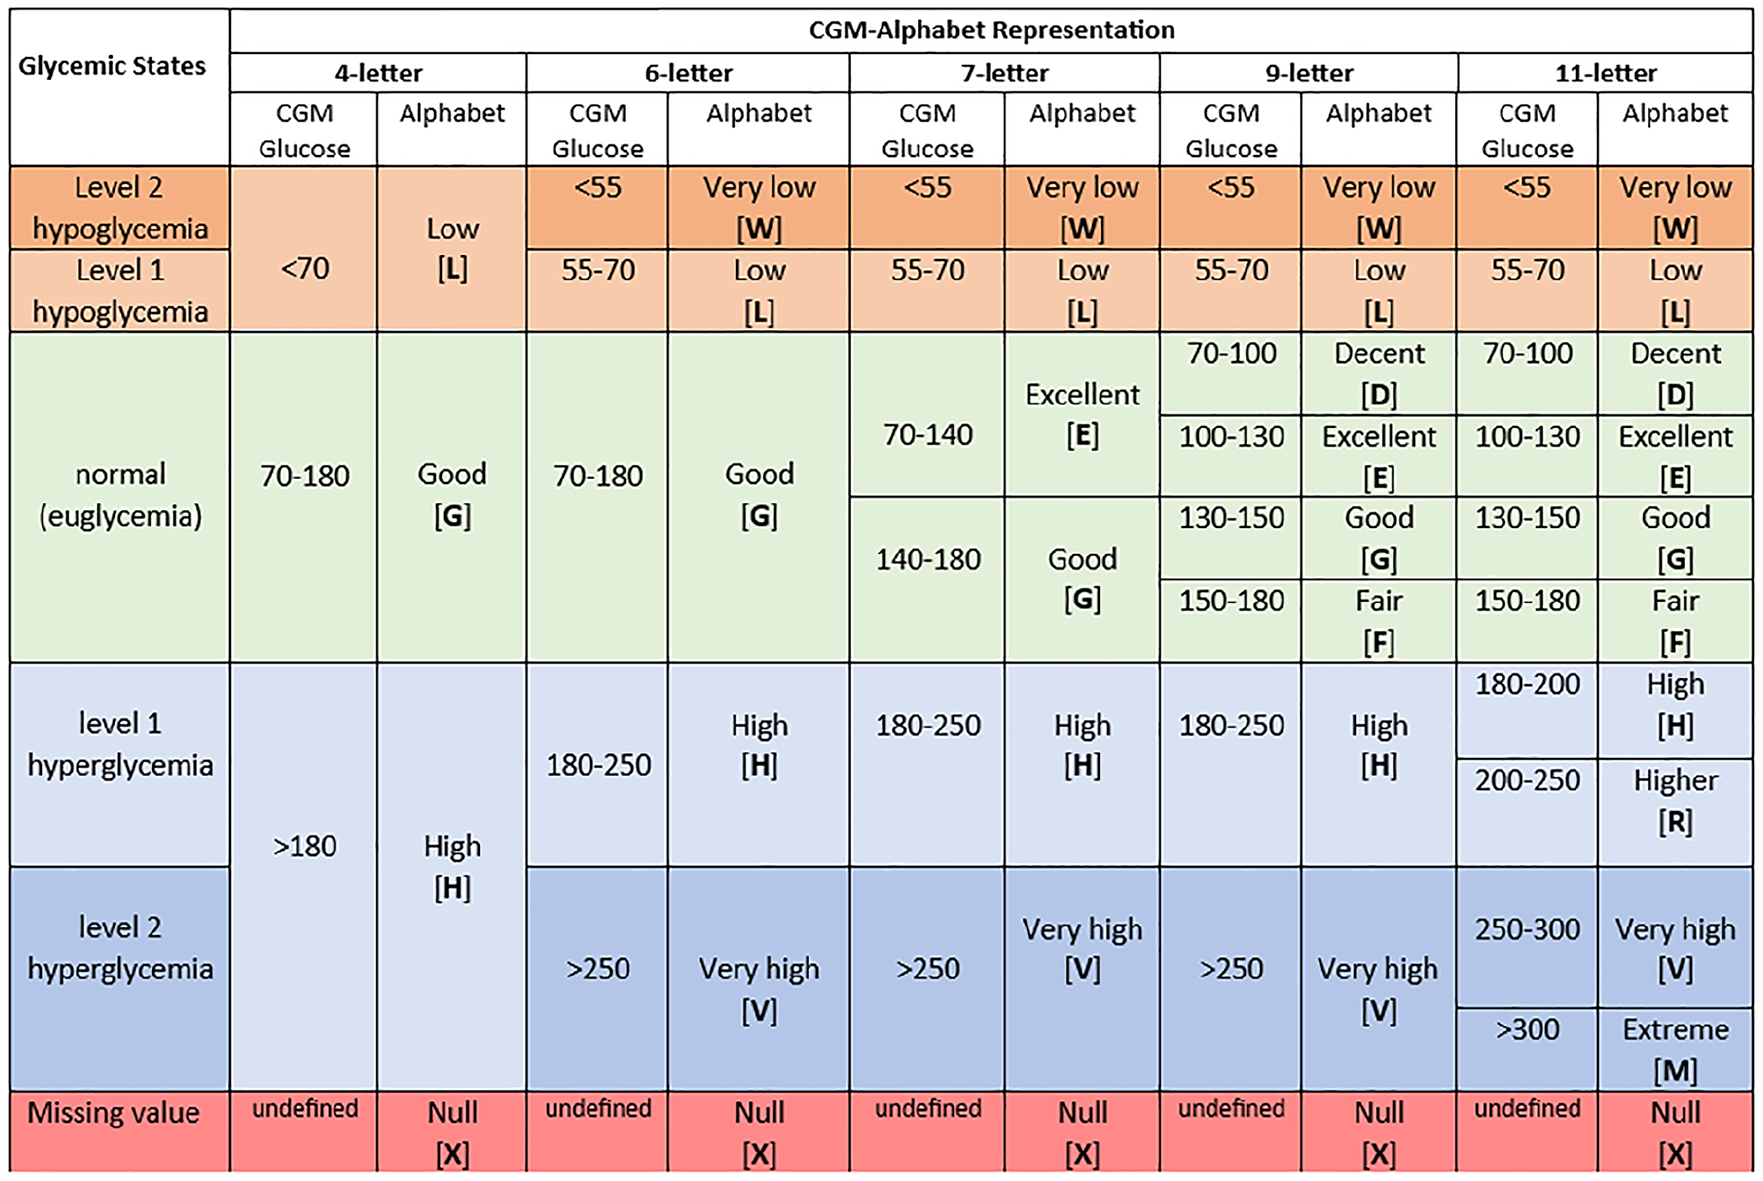
Categorical description of glucose value and alphabet for CGM profile encoding.
Therefore, the 6-letter alphabet representation further splits the 4-letter alphabet to accommodate different severities of hyperglycemia and hypoglycemia. In the 7-letter alphabet, the 70 to 180 mg/dL range from the 6-letter alphabet is divided between 70 to 140 mg/dL and 140 to 180 mg/dL. The 9-letter alphabet representation builds on the 7-letter alphabet, further dividing the 70 to 180 mg/dL range into 70 to 100 mg/dL, 100 to 130 mg/dL, 130 to 150 mg/dL, and 150 to 180 mg/dL. The 11-letter alphabet extends the 9-letter alphabet in the glucose >180 mg/dL with more letters to represent the following glucose ranges 180 to 200 mg/dL, 200 to 250 mg/dL, 250 to 300 mg/dL, and >300 mg/dL. Figure S1 (see Supplementary File) describes 13-letter, 19-letter, and 21-letter alphabets after further splitting the 11-letter alphabet. Each alphabet description has a letter to encode inherent missing values in the CGM trace.
Evaluating Glucose Categorical Values
A pair of values bound the letters in the alphabet for encoding the CGM profile: a lower bound, representing the minimum value (
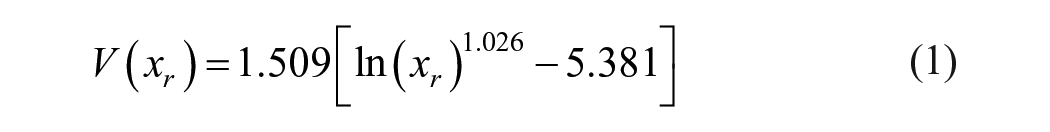

where
The risk score is translated to the equivalent glucose value to conform with regular measurements of glucose from the sensor.
Optimization Procedure
To identify the optimal alphabet appropriate to encode a CGM profile, we use an information criterion based on root mean square error (RMSE) and the compression ratio of the alphabet. Selecting an appropriate alphabet for encoding a CGM profile involves a trade-off between compression from the encoding and the corresponding resulting error. The AIC, 26 is computed to find the optimal alphabet. The AIC quantifies the quality of the encoding by considering its goodness of fit, which can be measured using the error metrics and the number of parameters (letters) defined in each alphabet, as described in.27,28 Generally, the smaller the AIC value, the “better” is the alphabet in representing the CGM trace. The smallest AIC value is “best” in minimizing information loss.
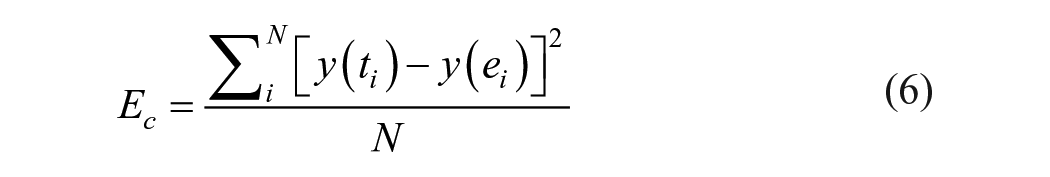
In this assessment, the RMSE evaluates the difference between the alphabet-encoded CGM profile and the CGM trace representing the CGM profile. Given that the trace of a CGM profile is represented as
Therefore, the RMSE,

and
where
Listing 1: Procedure for run-length encoding for a continuous glucose monitoring string
Let
The RLE algorithm outputs a compressed sequence, CGM text,
The process of generating CGM text,
Initialize an empty CGM text =
Start with
While Initialize Increment Append
Repeat steps 3 until all alphabets in
Therefore,

The AIC score,

and

where
To evaluate the optimal alphabet set and ensure that the clinical relevance is conserved, a Pearson correlation between the CGM trace and the CGM-alphabet encoded trace is computed. The following clinical metrics were considered: coefficient of variation (CV), mean blood glucose, low blood glucose index, high blood glucose index, and standard deviation (SD).
Results
Data
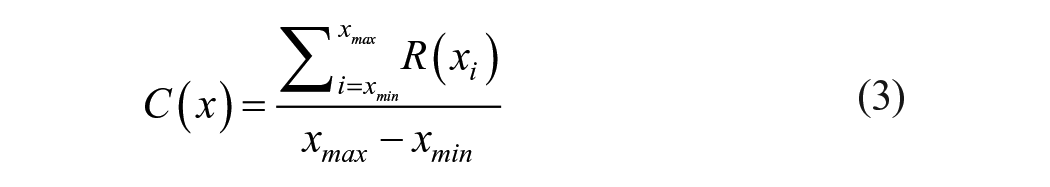
The data for the evaluation for the encoding analysis are derived from six studies. Detailed descriptions and demographic insights into these studies can be found in Montaser et al 29 and Lobo et al. 19 The data include various treatment modalities tested in individuals with T1D or T2D. Table 1 provides an overview of the CGM profile record, encompassing factors such as mean, SD, and CV. The records are stratified into 70% for training and 30% for validation. The training data are used to find the optimal alphabet-encoding CGM profiles, and the validation data are used to estimate the correlation between clinical metrics derived from the original and the encoded CGM profiles. Figure 4 and Figure S2 (see Supplementary File) describe the glucose value for each alphabet after evaluation with equation (3).
Description of the Data for Finding and Validating Optimal Alphabet Set for Encoding CGM Profile.

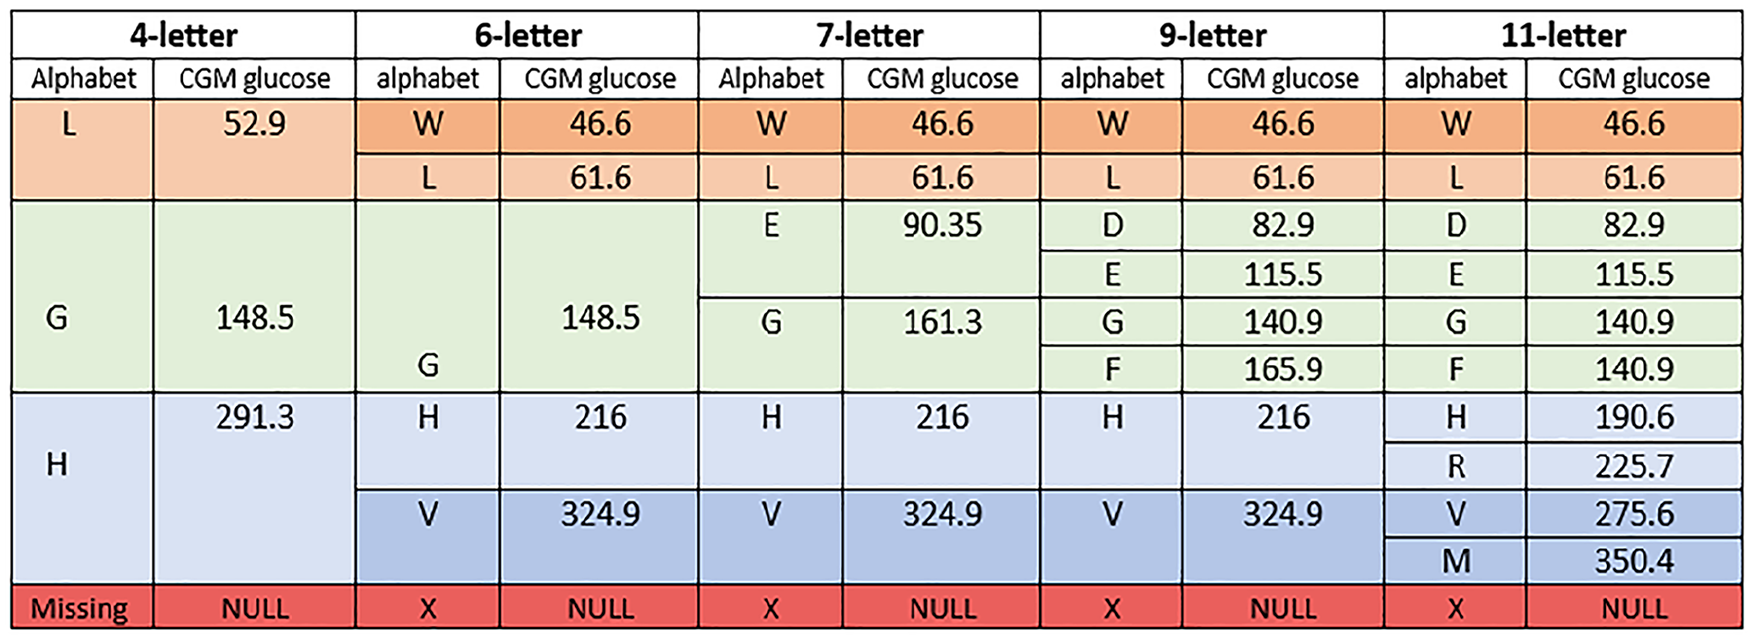
Glucose values and the alphabets for the 4-letter, 6-letter, 7-letter, 9-letter, and 11-letter alphabets.
Encoding Continuous Glucose Monitoring Profile
The CGM profiles following the encoding process are illustrated in Figures 5a and 5b, which show 4-letter and 21-letter encoding, respectively. Within each illustration, the figure describes the unencoded CGM trace alongside its encoded representation. Detailed insights into the encoded CGM profiles with the various alphabets are presented in Figures S3–S10 (see Supplementary File).
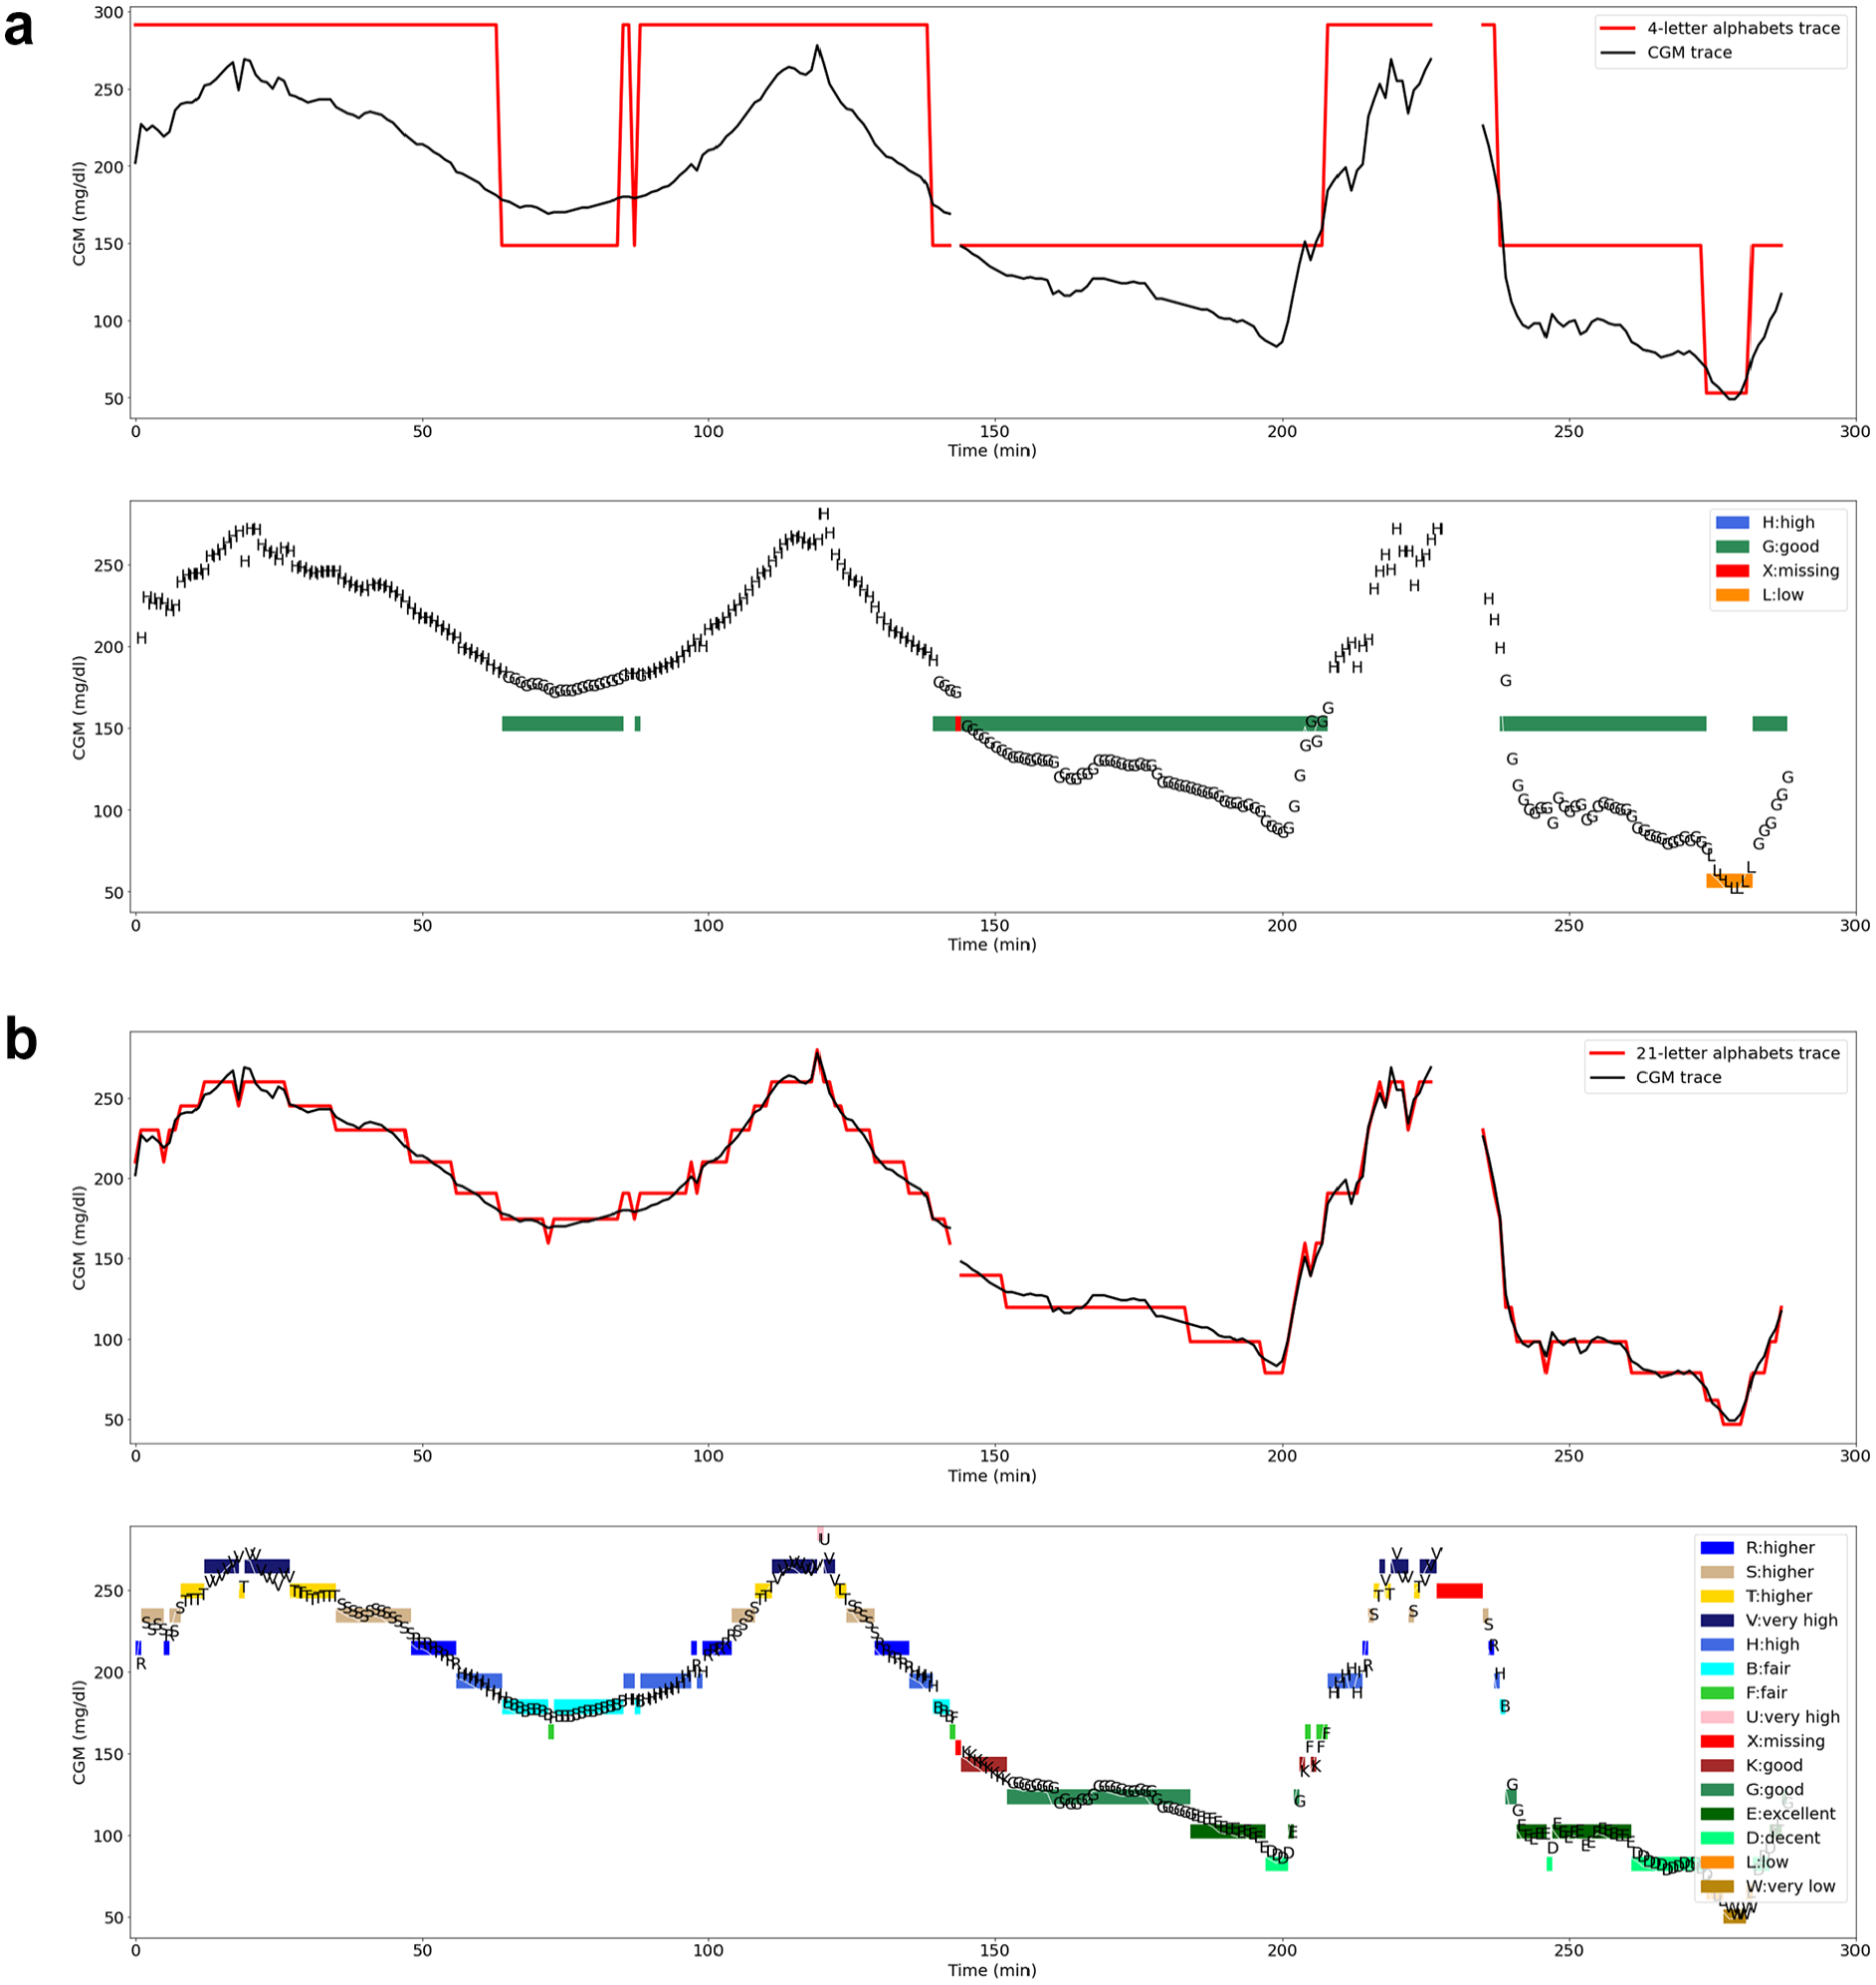
(a) Daily CGM profile encoding with 4-letter alphabets. (b) Daily CGM profile encoding with 21-letter alphabets. The top panel compares the profile of the CGM trace (black line) with the alphabet (red line). The bottom panel describes the CGM profile with letters from the alphabet to create a CGM string and the colour codes indicating continuous occurence of the letters.
The encoded traces unravel an interesting pattern. For instance, the CGM trace encoded with the 6-letter alphabet advances the 4-letter alphabet, particularly enhancing the encoding of glucose values above 180 mg/dL and below 70 mg/dL. Similarly, the 7-letter alphabet refines the glucose value 70 to 180 mg/dL representation. Increasing the alphabet to nine letters improves the encoding of glucose values 70 to 180 mg/dL even further. The 11-letter alphabet improves the glucose value above 180 mg/dL representation from the 9-letter alphabet, therefore cutting off high glucose values in the encoded trace. Subsequently, the 13-letter, 19-letter, and 21-letter alphabets enhance the encoding process with consistent improvement, resulting in traces that mirror the CGM profile as exemplified in Supplementary Figure S10.
Information Criteria Assessment for Finding Optimal Alphabet
The evaluation of RMSE is in Figures S11–S15 (see Supplementary File), and the compression ratio is described in Figures S16–S22 (see Supplementary File) for the alphabets encoding of the CGM profile.
The minimum AIC score identifies the optimal alphabet for encoding CGM profiles, achieving a balance between error and compression. The outcomes of this estimation are shown in Figure 6: for most data sets, a 9-letter alphabet with the lowest AIC score minimizes the information loss. The one exception is the “healthy” study presented in Figure 6f, where distinct dynamics unfold. Thus, the 9-letter alphabet is appropriate, as most of the illustrations in the figure show that it has the lowest AIC score.
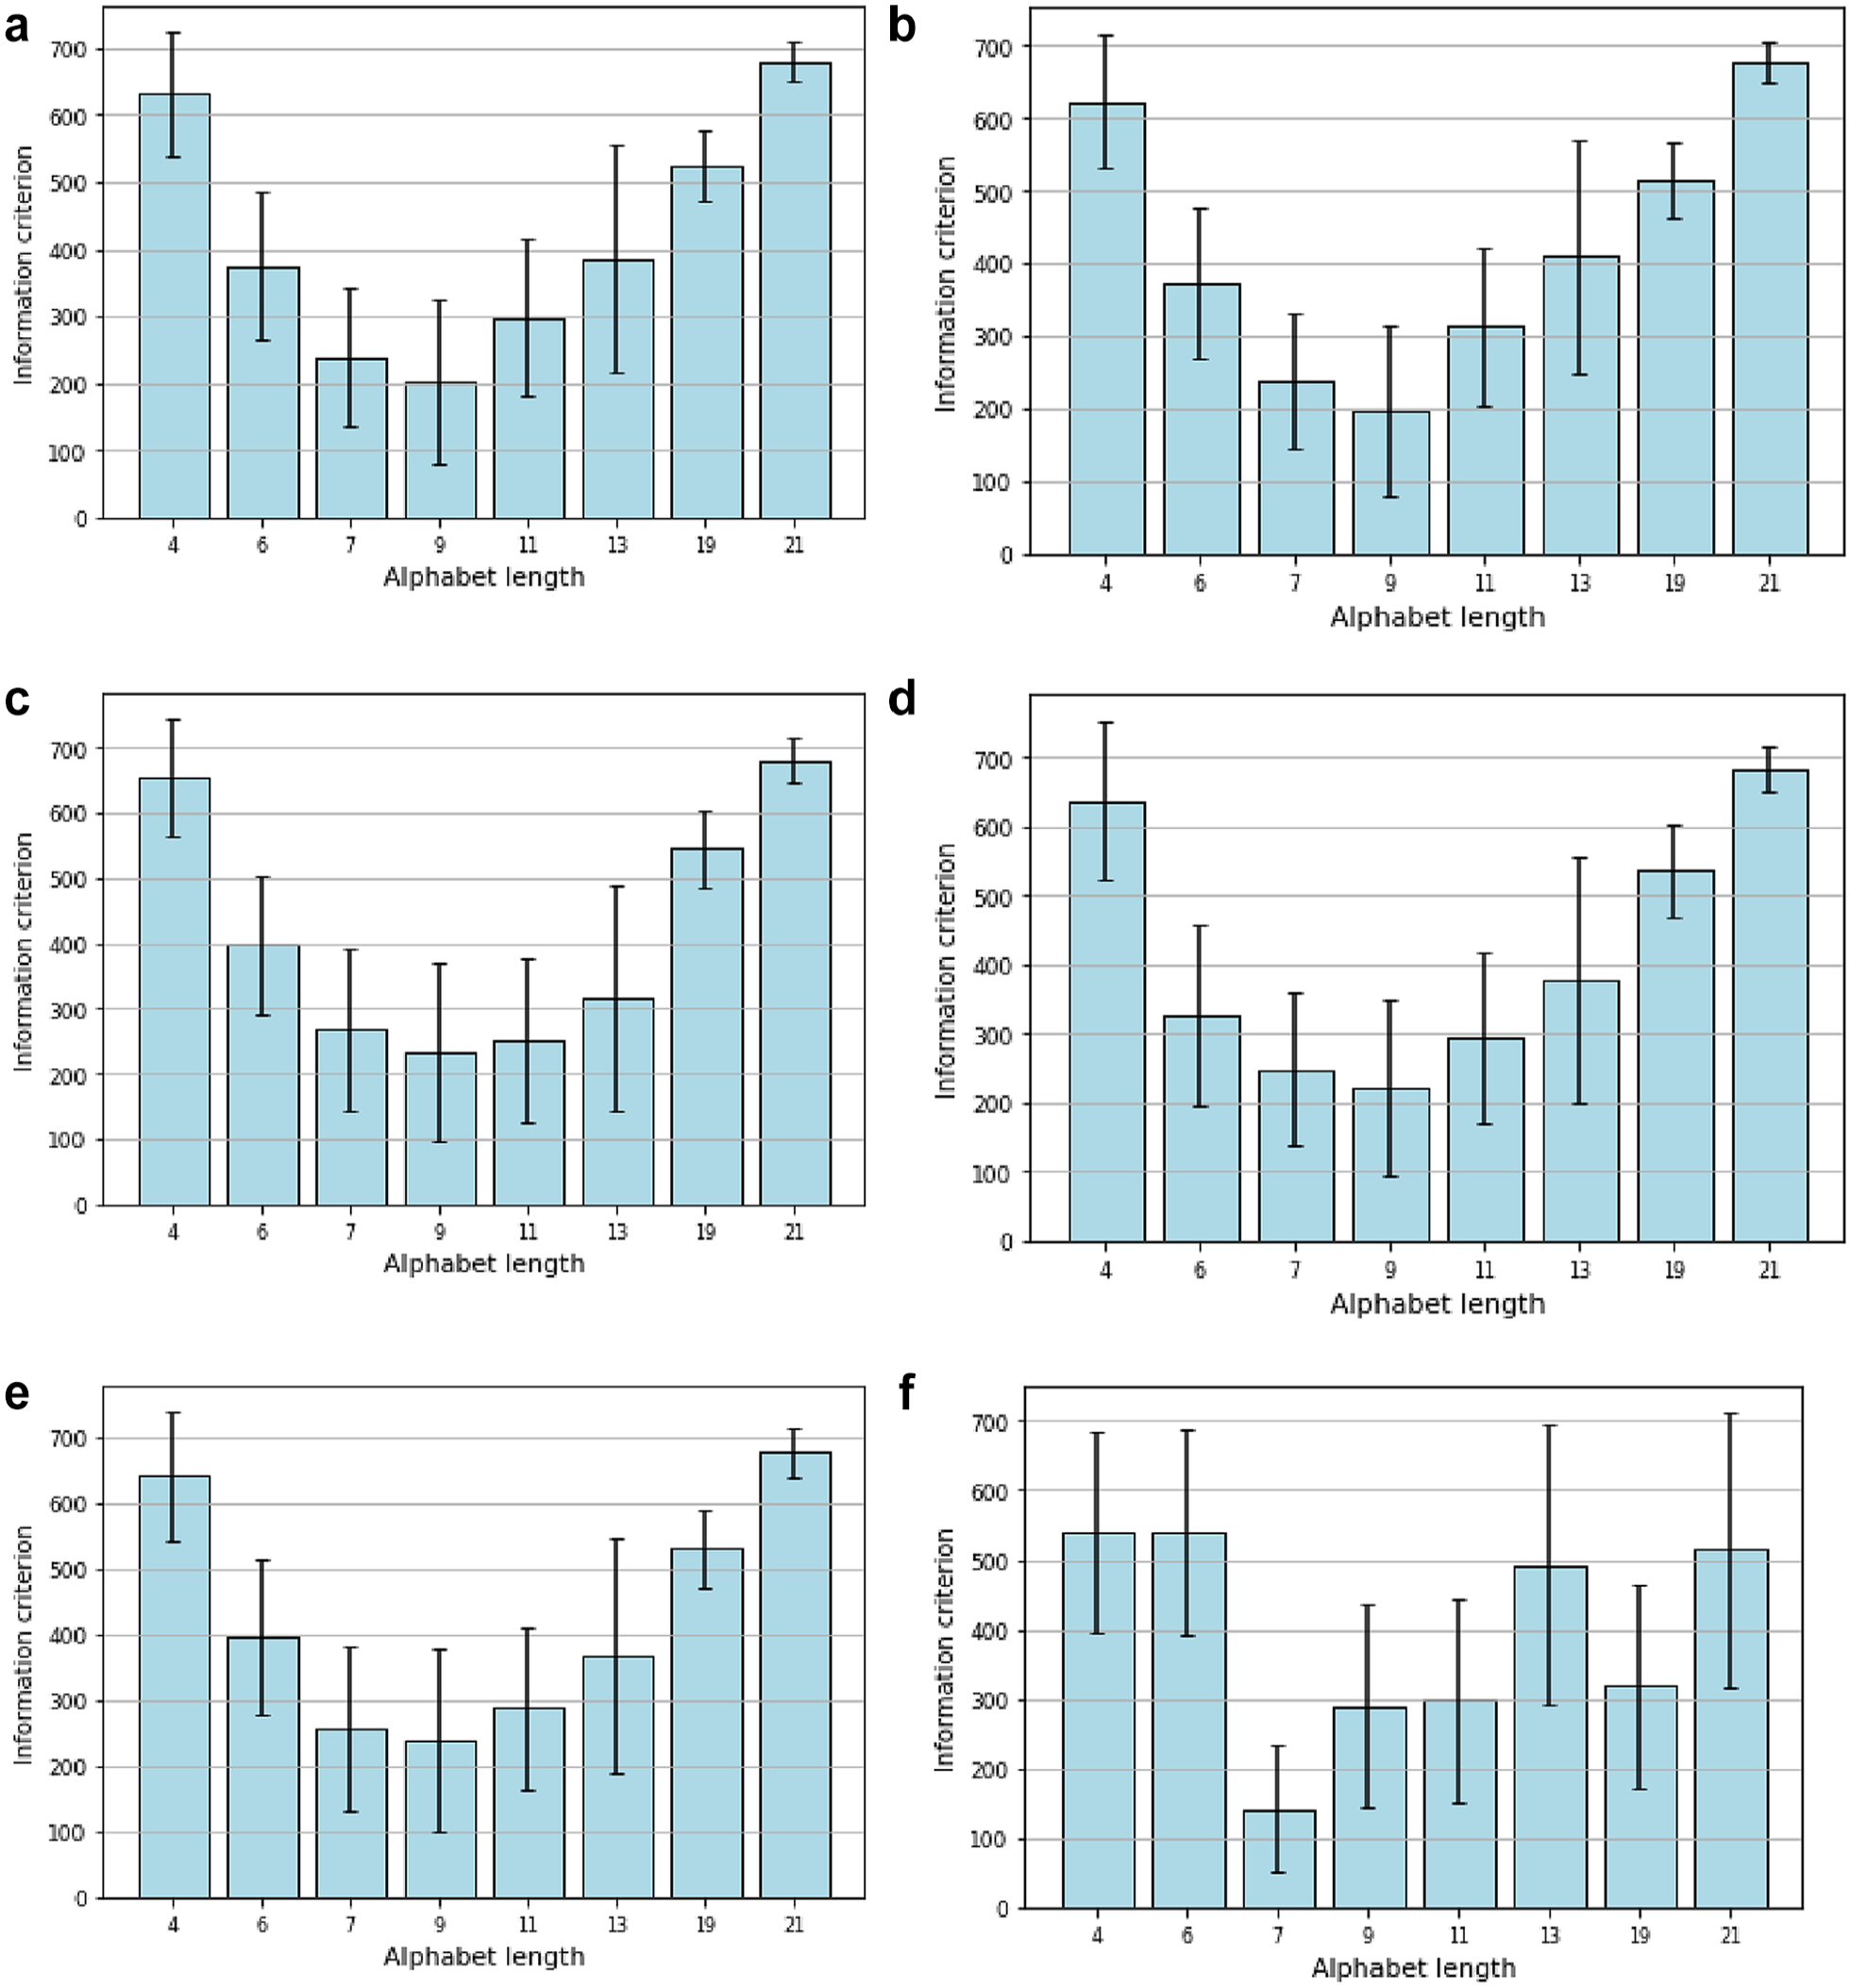
(a) Information criterion for the DCLP1 study. (b) Information criterion for the DCLP3 study. (c) Information criterion for the DiamondT1D study. (d) Information criterion for the DiamondT2D study. (e) Information criterion for the DSS1 study. (f) Information criterion for the healthy study.
Figures 7 and 8 describe the CV scatter plot and Pearson correlation value between the CGM profile and encoded CGM profile with 7-letter and 9-letter alphabets, respectively. Generally, the Pearson correlation value is higher with 9-letter alphabets compared to the 7-letter alphabets. In Figure 7, the minimum correlation value is 0.832 and the maximum correlation value is 0.893. In Figure 8, the minimum and maximum Pearson correlations are 0.945 and 0.965, respectively. Similarly, the other comparison results for other clinical metrics between 7-letter and 9-letter alphabets are described in Figures S23–S30 in the Supplementary File. The plots in the figures show that, regardless of the metrics considered, encoding with 9-letter alphabets has a comparatively higher correlation to the CGM profile than the 7-letter alphabets. Therefore, the 9-letter alphabets are considered the optimal alphabets for encoding the CGM profile.
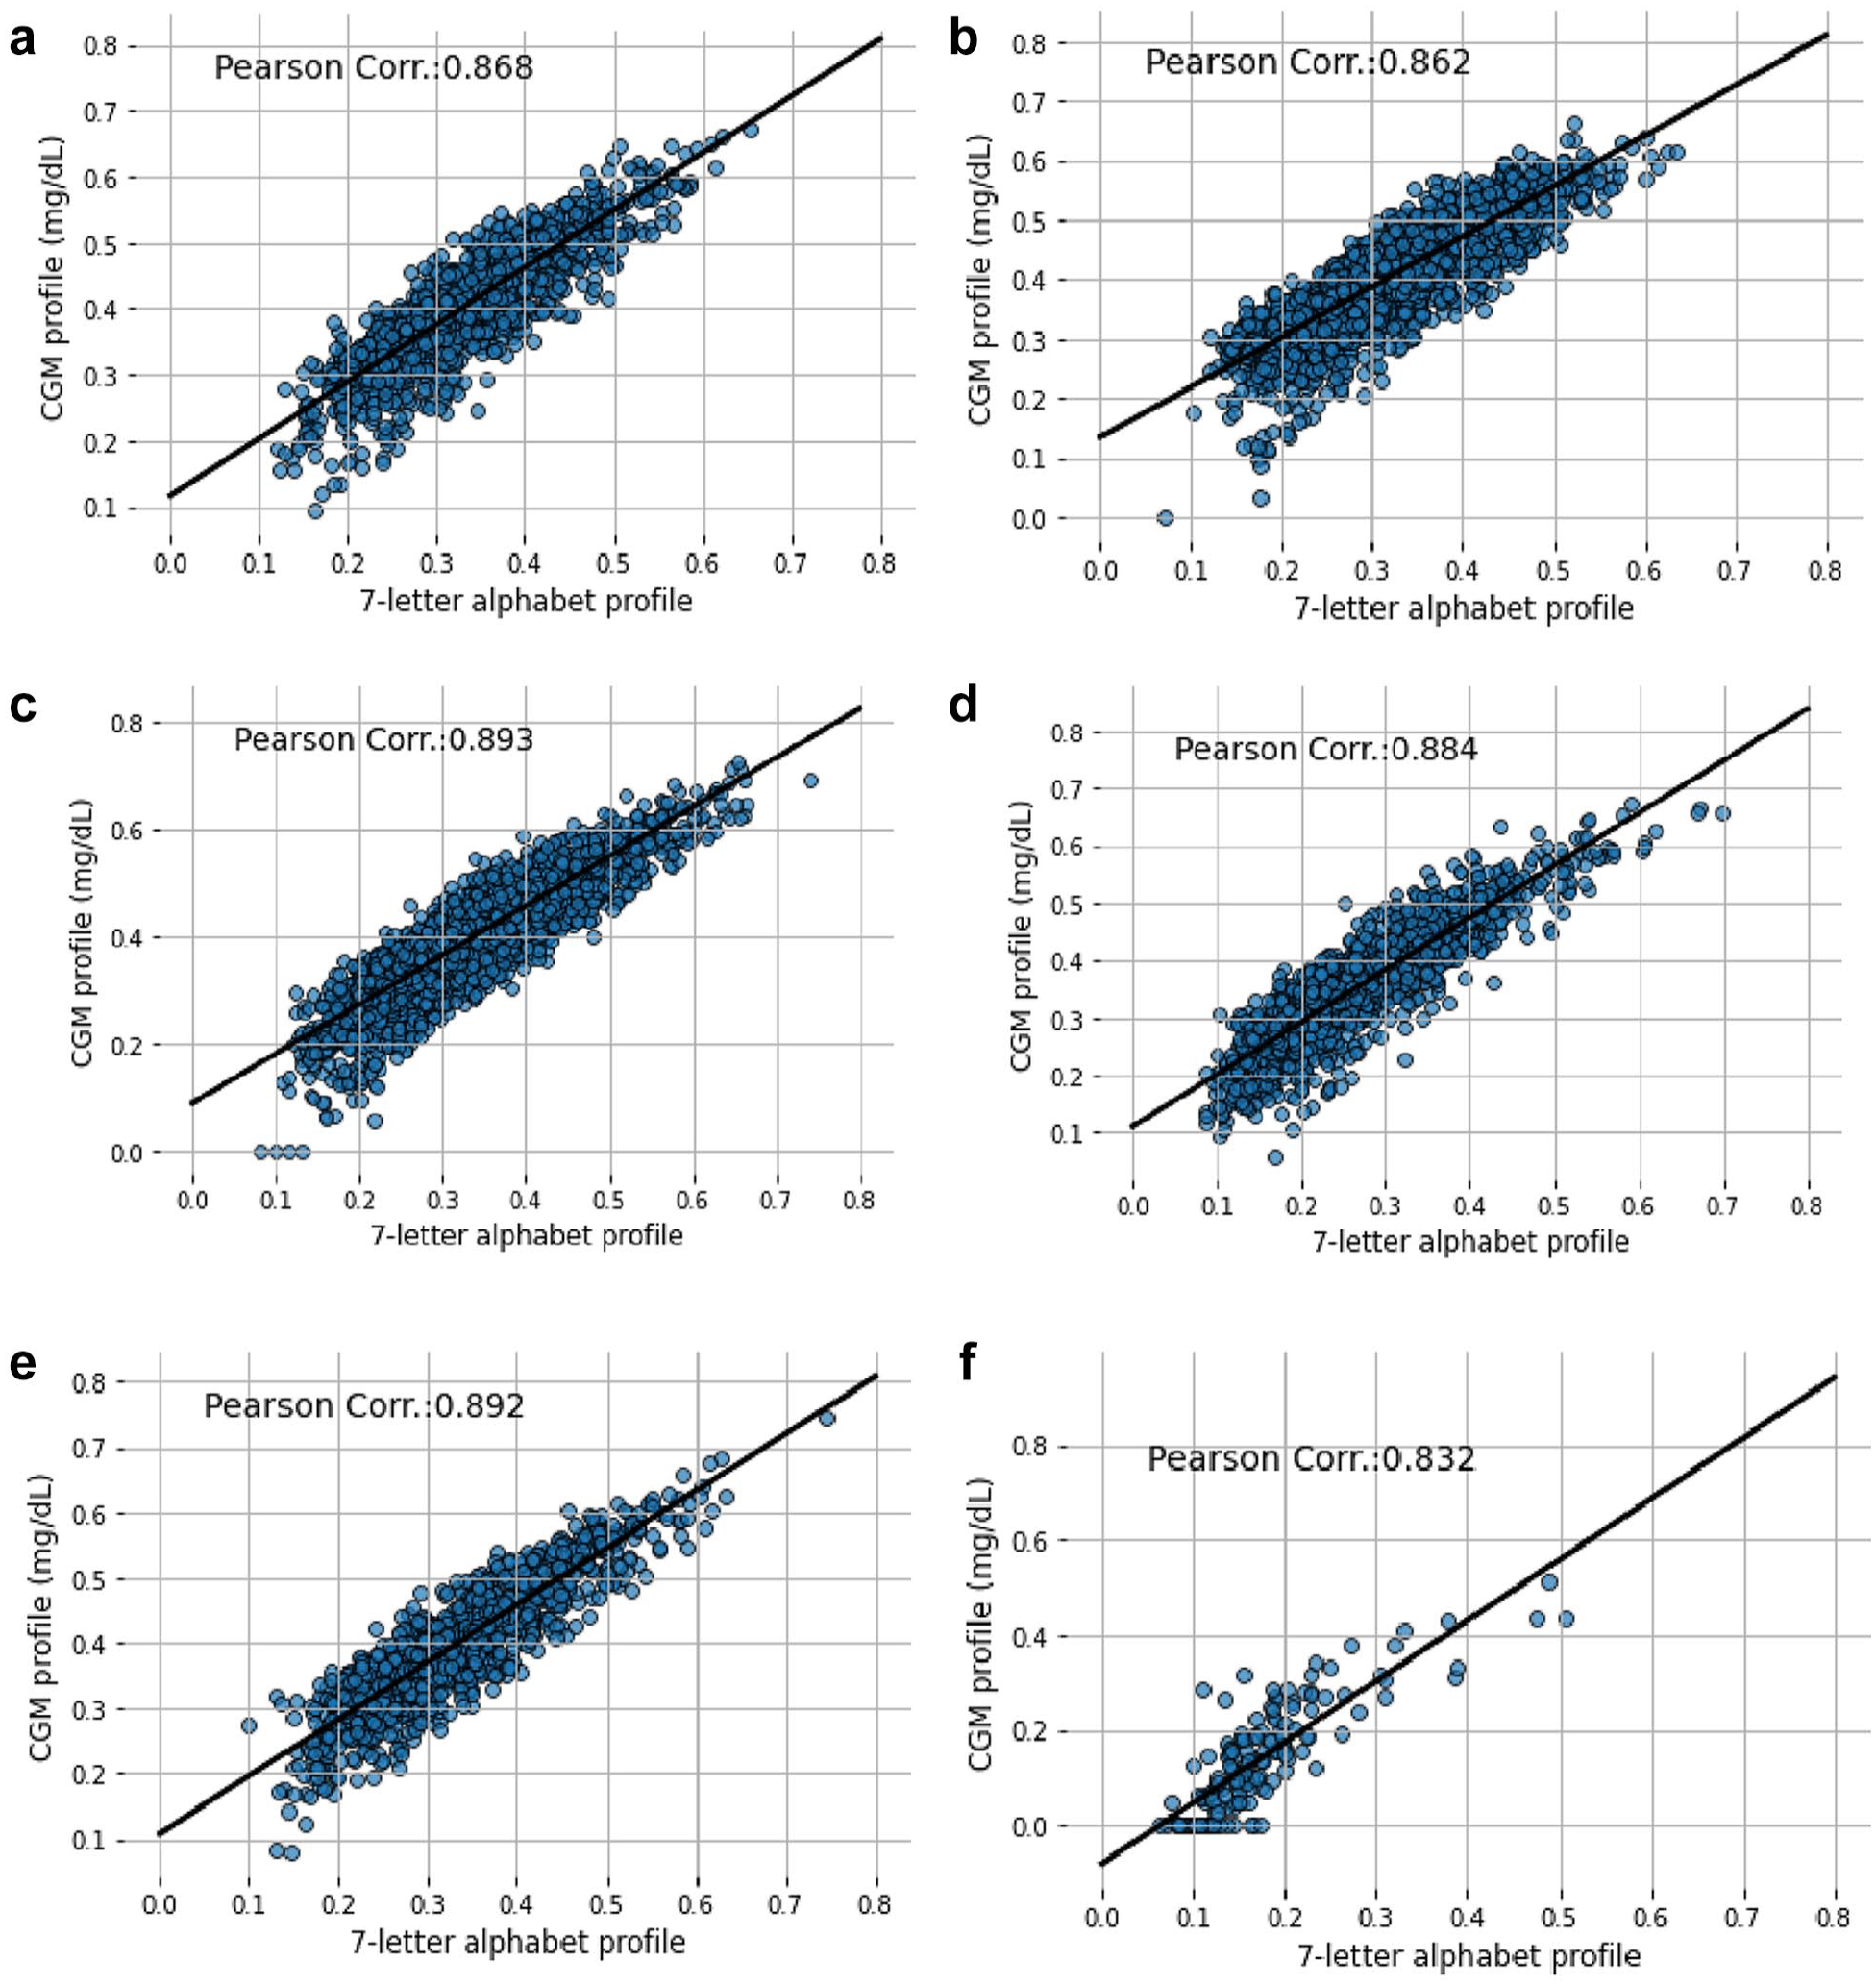
Scatter plot of coefficient of variation showing the correlation between 7-letter alphabets encoding and CGM profile for (a) DCLP1 study, (b) DCLP3 study, (c) DiamondT1D study, (d) DiamondT2D study, (e) DSS1 study, and (f) healthy study.
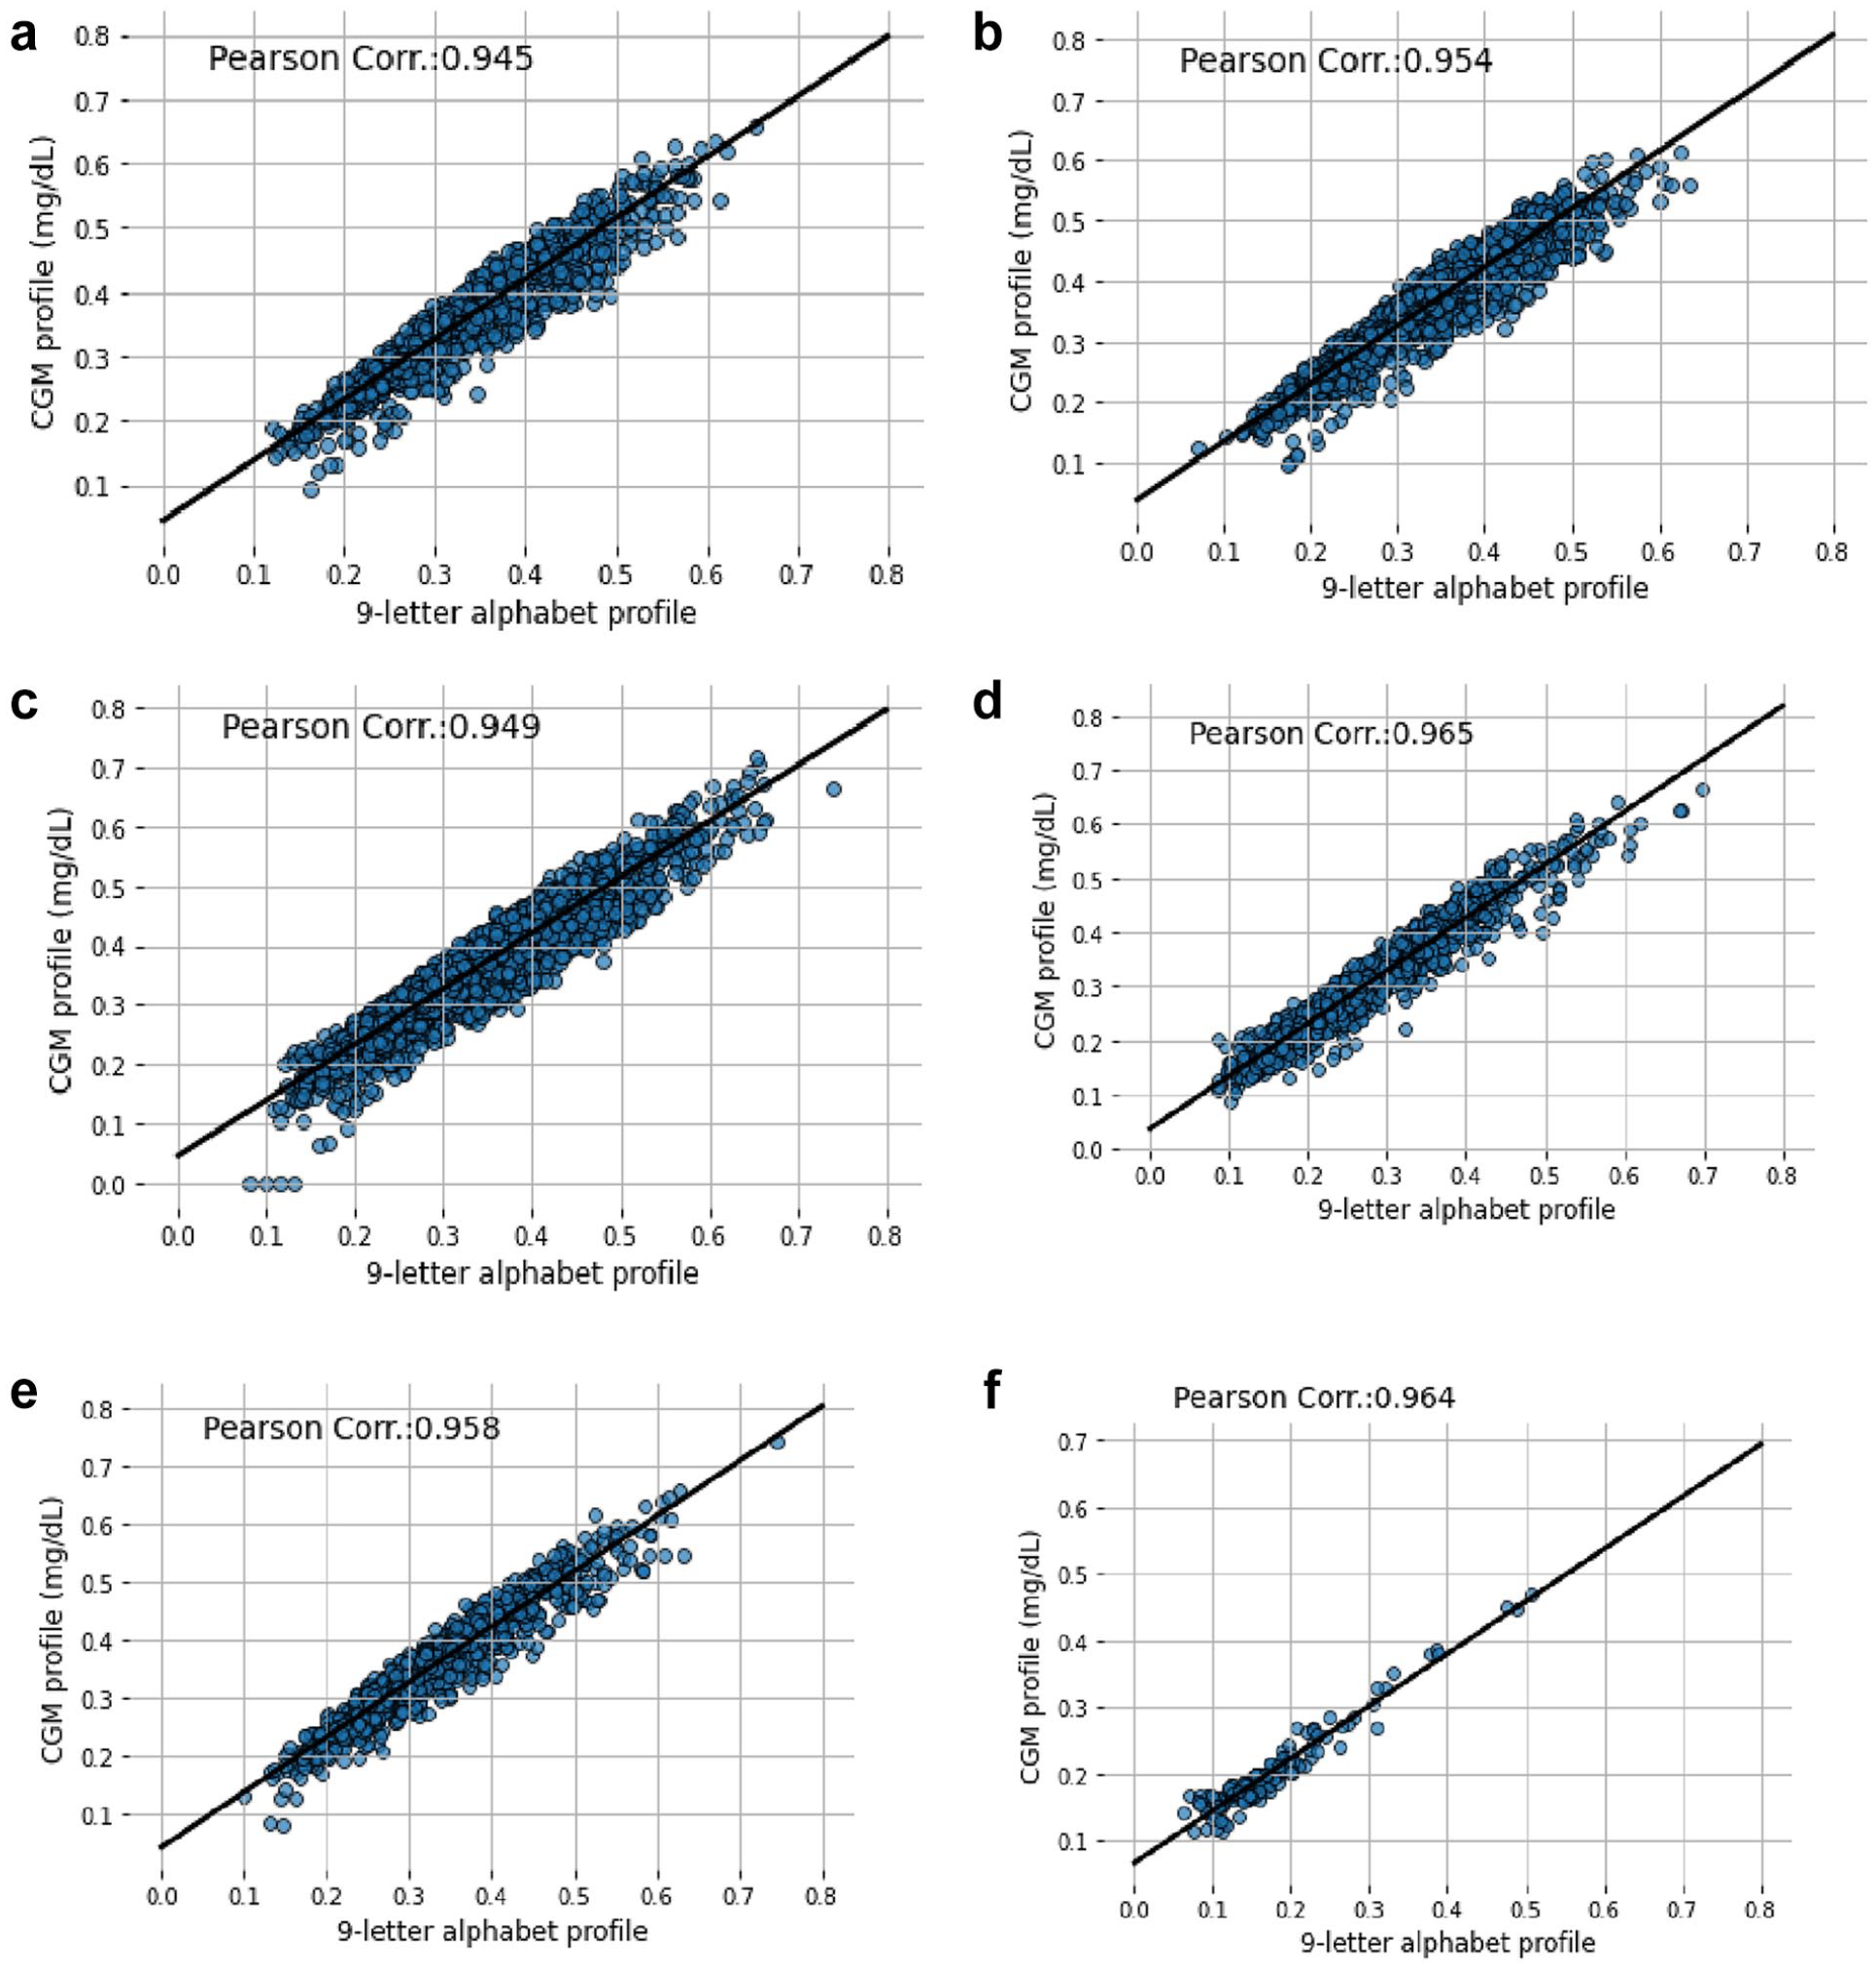
Scatter plot of coefficient of variation showing the correlation between 9-letter alphabets encoding and CGM profile for (a) DCLP1 study, (b) DCLP3 study, (c) DiamondT1D study, (d) DiamondT2D study, (e) DSS1 study, and (f) healthy study.
Discussion
This article derives an optimal alphabet with applications to encoding CGM traces. This approach is aimed at optimizing the text encoding of CGM profiles through balancing error reduction and compression efficiency. Eight alphabets based on clinical ranges were investigated for optimality. The analysis included data from six distinct studies representing healthy individuals and diverse treatment modalities used by individuals with T1D or T2D. In all studies, except in health, a 9-letter alphabet yielded optimal text encoding of the CGM data. In health, this was achieved by the 7-letter alphabet, which corresponds to the more stable CGM profiles in healthy individuals.
One of the primary applications of this approach is optimal data compression and text representation of CGM profiles. Text representation of CGM data enhances interoperability and facilitates data exchange among different health care systems and devices. When CGM profiles are represented uniformly across different systems and devices, the seamless integration of data from various sources becomes feasible, promoting collaboration and consistency of CGM profile status. Furthermore, by compressing and structuring the data, our approach enables the integration into DSS frameworks, where these structured text-based representations can be used as inputs for automated clinical decision-making tools. For instance, this method could support the identification of glycemic excursions and trigger personalized feedback for lifestyle modifications. Furthermore, pattern discovery can be enhanced by leveraging encoded CGM data in machine learning algorithms, enabling the detection of long-term trends such as glycemic variability, forecast analysis, or response to specific interventions and events.
In this article, the AIC guides the selection of an optimal alphabet for encoding CGM traces. Identifying the alphabet that balances the reduction of error and efficient data compression is crucial for encoding the CGM profile for simplified trend description and data-driven decision-making. We show that any CGM trace can be encoded as a combination of 9 letters, preserving CGM trends while minimizing error. Our approach maintains consistency with the AGP and accepted glucose metrics, such as TIR, TBR, and TAR.
The findings of our study confirm the effectiveness of alphabet-encoding techniques in approximating various clinical metrics derived from CGM traces. As indicated by the Pearson correlation coefficients, our analysis demonstrates strong associations between the alphabet-encoded CGM traces and key glycemic variability and control parameters. Specifically, the observed Pearson correlation coefficients of ≥0.95 for CV, 0.99 for mean glucose, 0.92 for standard deviation, 0.99 for high blood glucose index, and 0.98 for low blood glucose index underscore the robustness of the alphabet-encoding approach in capturing essential features of CGM data. These findings suggest that symbolic representations offer a promising avenue for simplifying and interpreting complex glucose dynamics, facilitating more precise assessments of CGM profiles. For instance, the symbolic representation simplifies the identification of TIR metrics, glycemic excursions, or variability, allowing for quicker assessment of patient status. In addition, the encoded data can facilitate comparative analyses across patients or populations and support predictive modeling in clinical decision-making.
Conclusion
This article identifies the optimal alphabet for encoding CGM time series, driven by balancing error minimization and compression efficiency. The results indicate that a 9-letter alphabet was optimal for encoding CGM traces. Further analysis revealed that the 9-letter alphabet achieved ≥0.95 Pearson correlation with clinical metrics. This work enables CGM profiles to be encoded into text and used in various applications that can benefit from text-processing methods, such as fast searches, anomaly detection, indexing, and pattern analysis.
Supplemental Material
sj-docx-1-dst-10.1177_19322968251323913 – Supplemental material for Finding Optimal Alphabet for Encoding Daily Continuous Glucose Monitoring Time Series Into Compressed Text
Supplemental material, sj-docx-1-dst-10.1177_19322968251323913 for Finding Optimal Alphabet for Encoding Daily Continuous Glucose Monitoring Time Series Into Compressed Text by Tobore Igbe and Boris Kovatchev in Journal of Diabetes Science and Technology
Footnotes
Acknowledgements
This study was conducted under a research agreement between UVA and Dexcom.
Abbreviations
ADA, American Diabetes Association; CGM, continuous glucose monitoring; AGP, ambulatory glucose profile; TIR, time in range; TAR, time above range; TBR, time below range; OGTT, oral glucose tolerance test; RMSE, root mean square error; RLE, run-length encoding; AIC, Akaike Information Criterion; CV, coefficient of variation; SD, standard deviation; T1D, type 1 diabetes; T2D, type 2 diabetes; WHO, World Health Organization.
Declaration of Conflicting Interests
The author(s) declared the following potential conflicts of interest with respect to the research, authorship, and/or publication of this article: Research support from Dexcom, Inc handled by the University of Virginia. Patent royalties from Dexcom, Inc are handled by the UVA Licensing and Ventures Group.
Funding
The author(s) disclosed receipt of the following financial support for the research, authorship, and/or publication of this article: Dexcom-UVA master research agreement.
Supplemental Material
Supplemental material for this article is available online.
References
Supplementary Material
Please find the following supplemental material available below.
For Open Access articles published under a Creative Commons License, all supplemental material carries the same license as the article it is associated with.
For non-Open Access articles published, all supplemental material carries a non-exclusive license, and permission requests for re-use of supplemental material or any part of supplemental material shall be sent directly to the copyright owner as specified in the copyright notice associated with the article.