
Abstract

Szigeti M, Ferenci T, Kovács L. The Use of Extreme Value Statistics to Characterize Blood Glucose Curves and Patient Level Risk Assessment of Patients With Type I Diabetes. J Diabetes Sci Technol. 2023;17(2):400-408. DOI: 10.1177/19322968211059547
In the above referenced article, there was an error in the gluvarpro 4.0 package that was used to calculate the classical metrics that affected the calculation of MAGE scores. Author of the gluvarpro package confirmed these findings and fixed this error (in version 7.0) but meanwhile Szigeti et al. decided to use to use the R package iglu (version 3.2.2) to calculate the metrics, including MAGE, instead of gluvarpro
Szigeti et al. developed new metrics in their work based on extreme value statistics and used the old ones only for comparison, therefore this error did not alter their findings. However, after thorough revision it has been found that it affects Figure 2, 5 and S9:
Figure 2: Plots of MAGE have been updated and the correlation coefficients of MAGE were updated too.
Figure 5: MAGE plot (lower middle) have been updated.
Figure S9 in supplemental material: MAGE plot (lower middle) have been updated.
This list of the classical metrics should not include MAGE+ anymore. So below sentences on 402 have been revised:
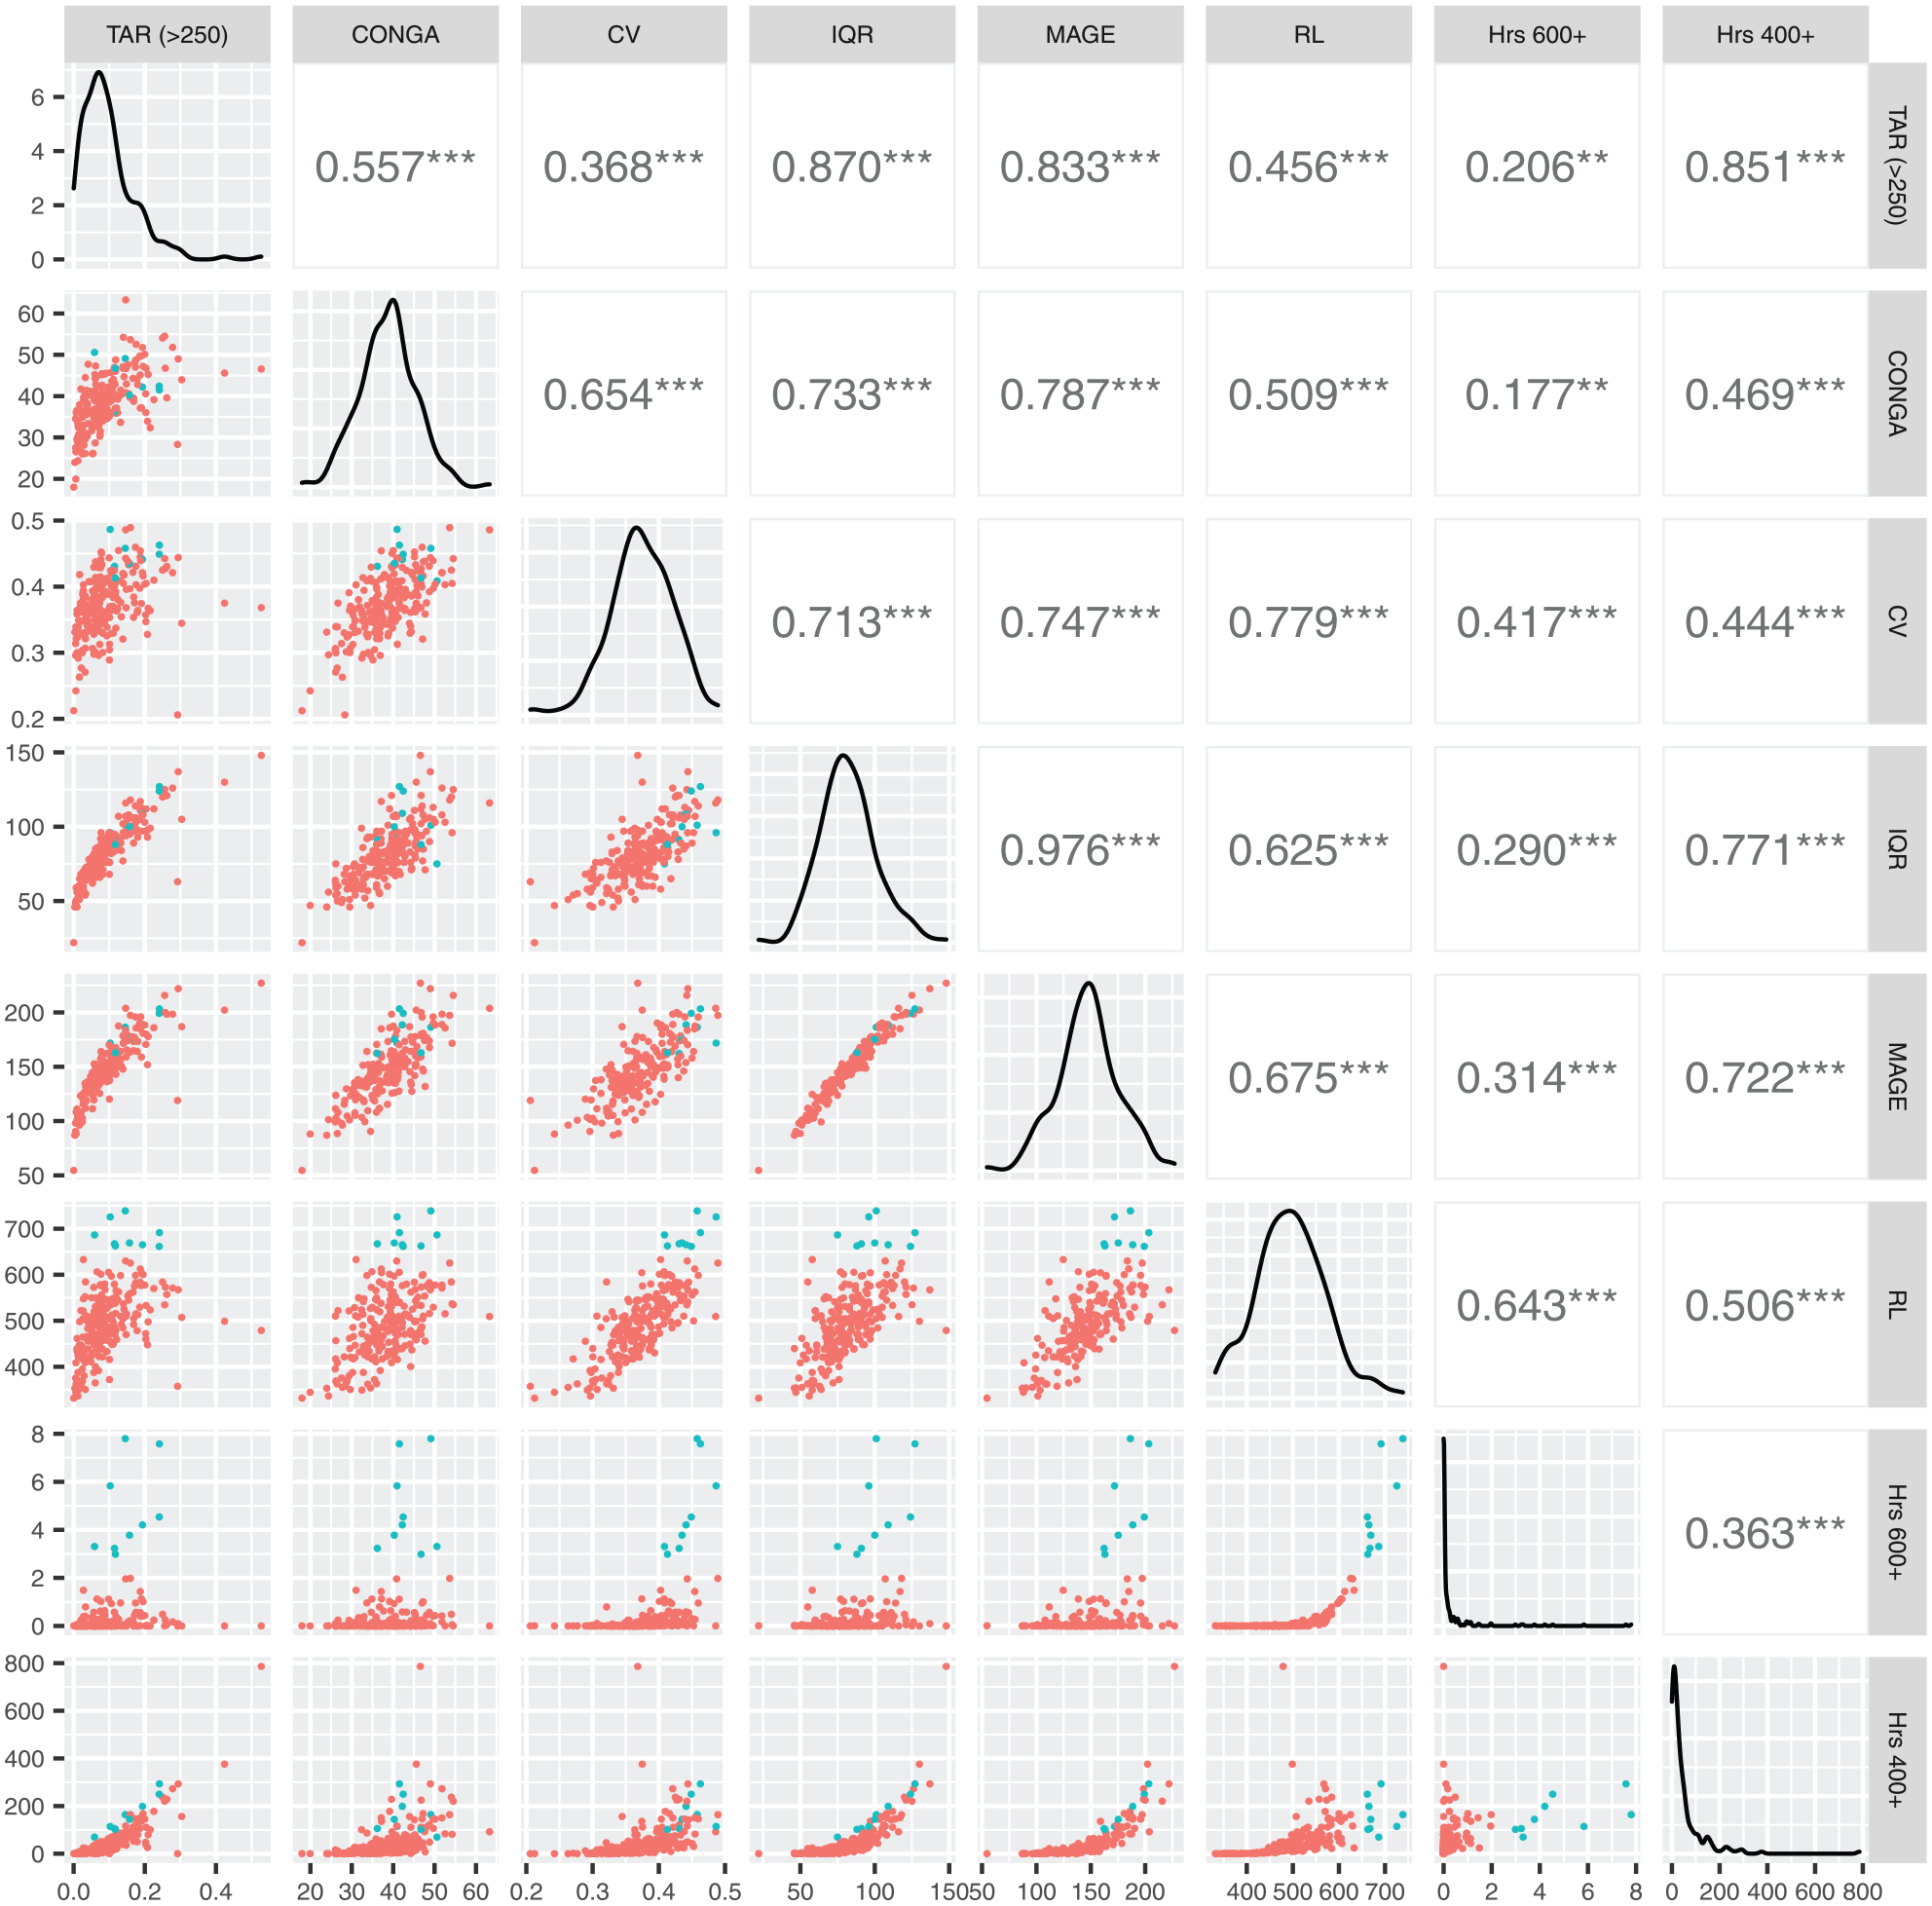
Pairwise scatterplots, distribution and linear correlation coefficients of the investigated metrics. Distribution of each metric can be found in the main diagonal, pairwise correlation coefficients in the upper right triangle and their pairwise scatterplots in the bottom left half. The 9 highest risk patients according to the estimated time above 600 mg/dl obtained with EVS are highlighted.
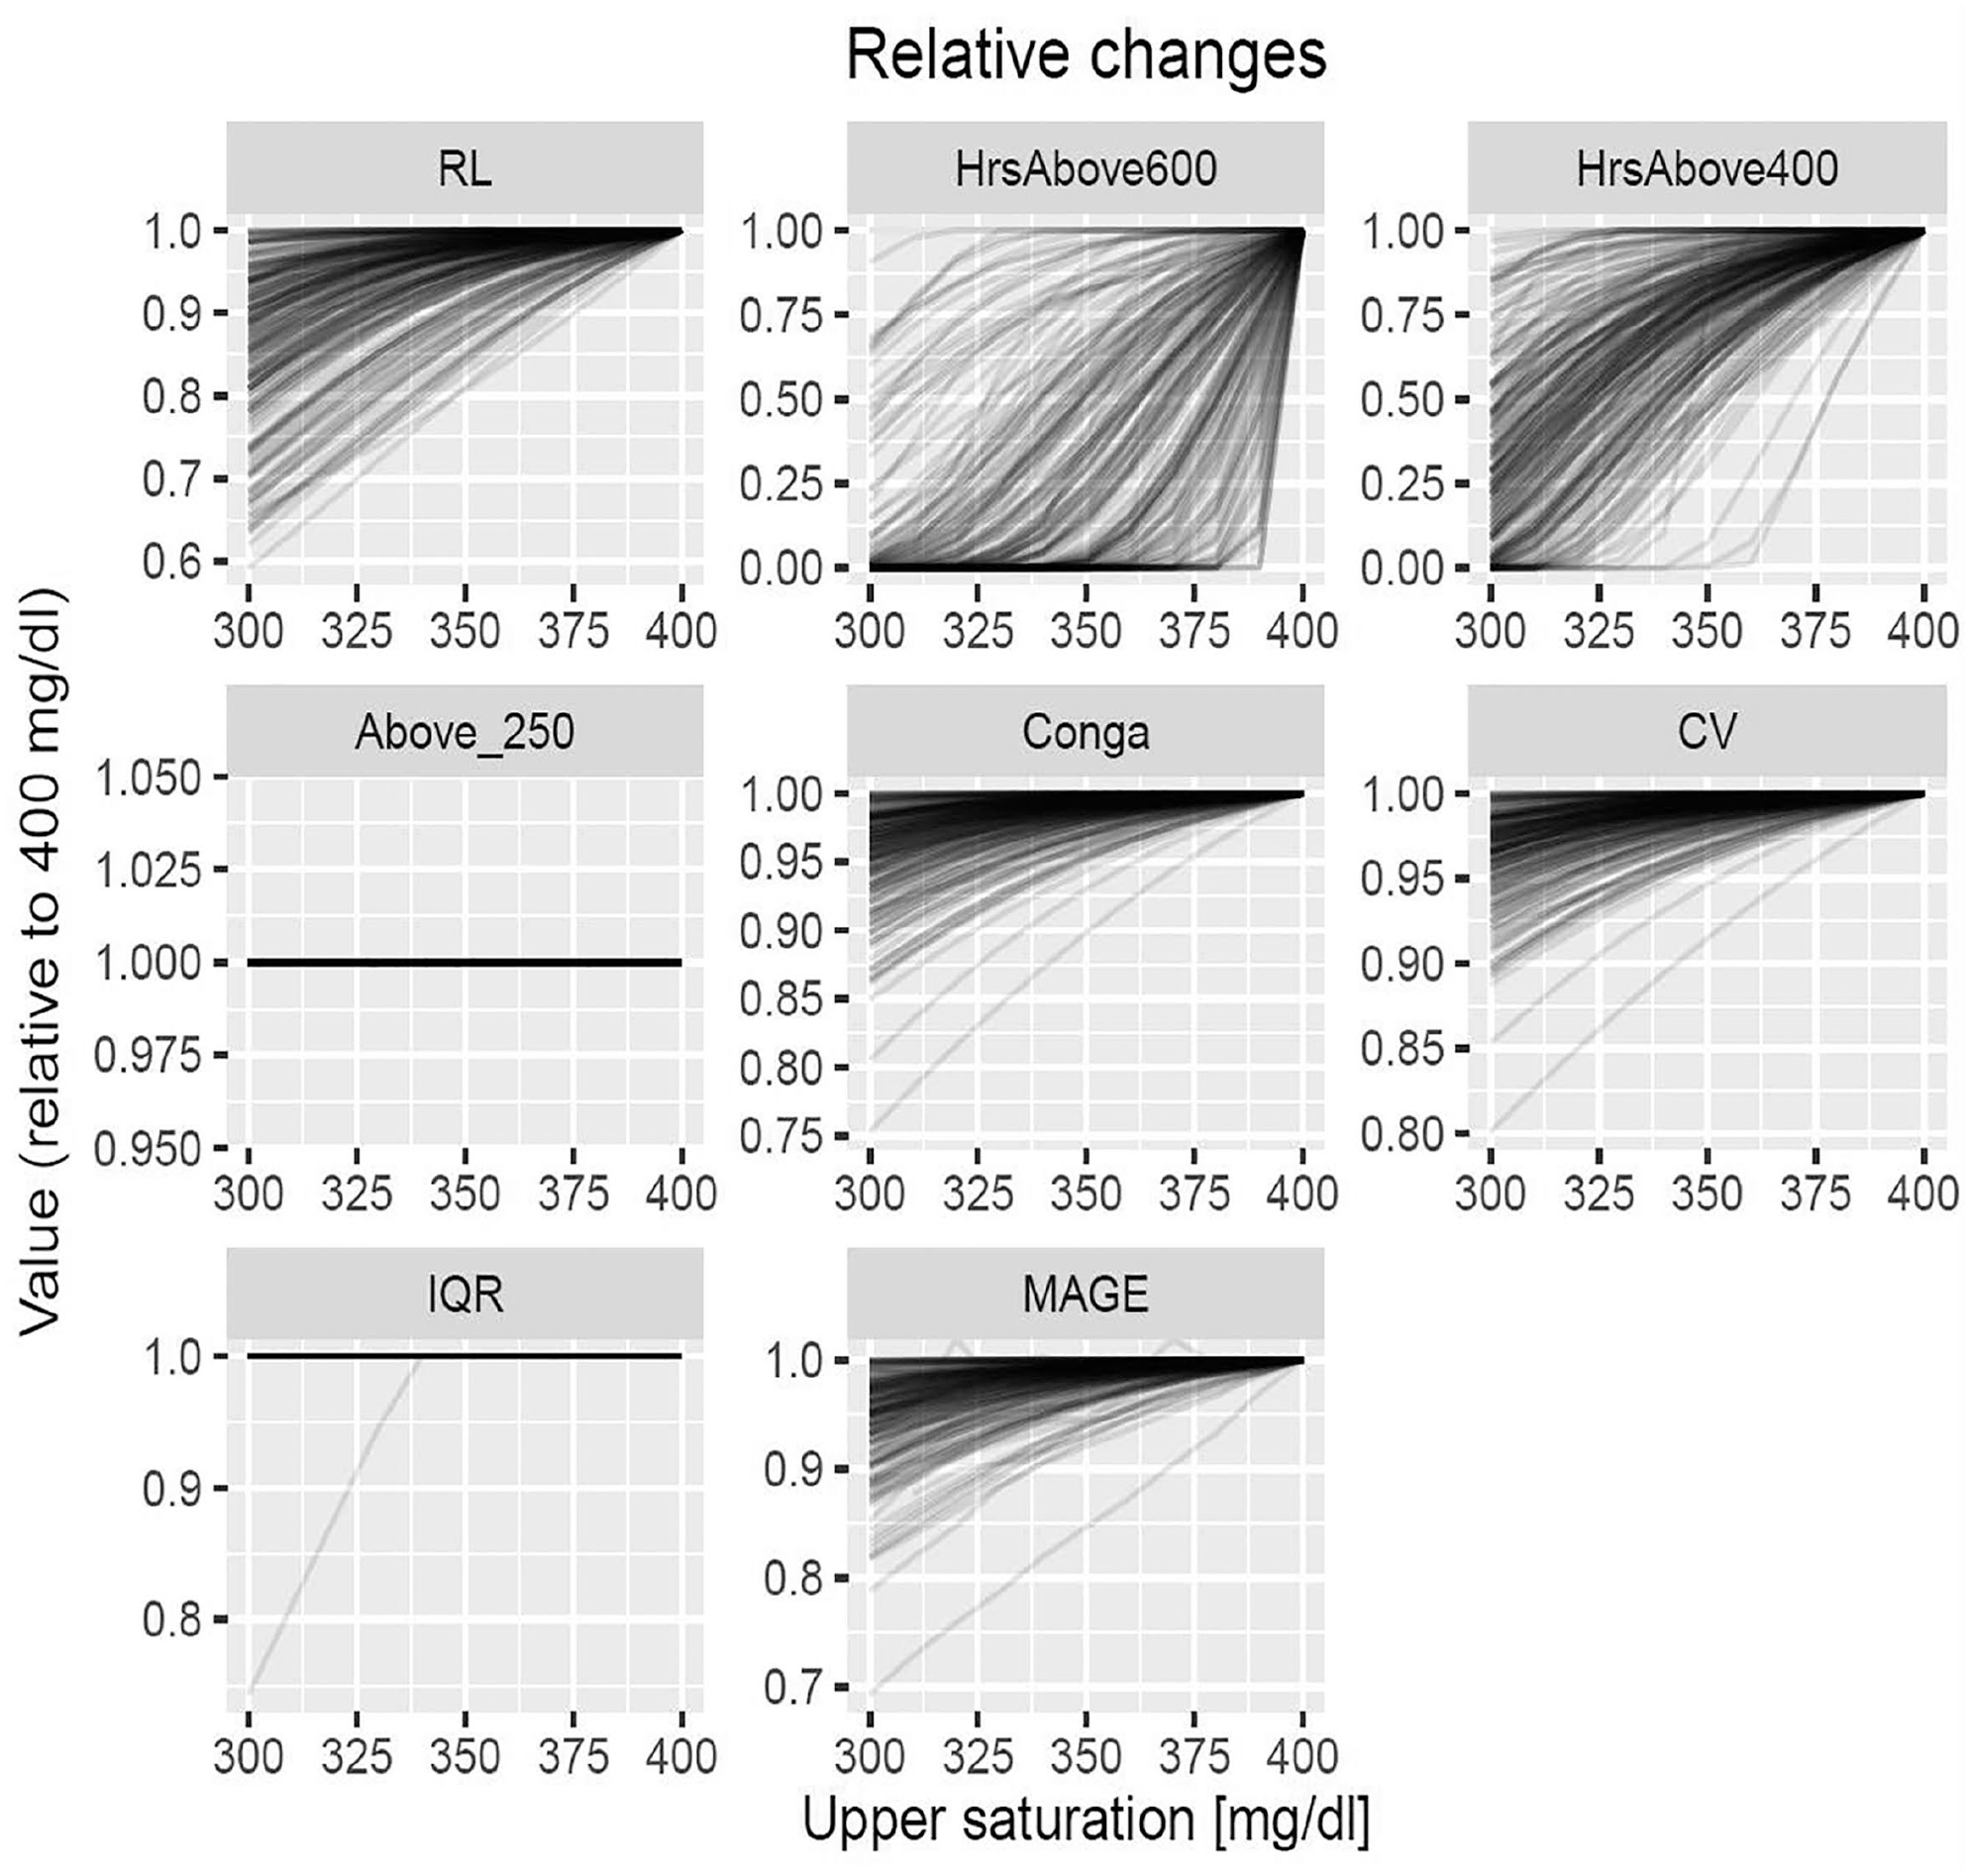
Impact of upper saturation level (trimming) on traditional GV metrics and metrics based on EVS. Values obtained with the given upper saturation level were divided with the original value (i.e., when only the physical 400 mg/dl saturation level was in effect).
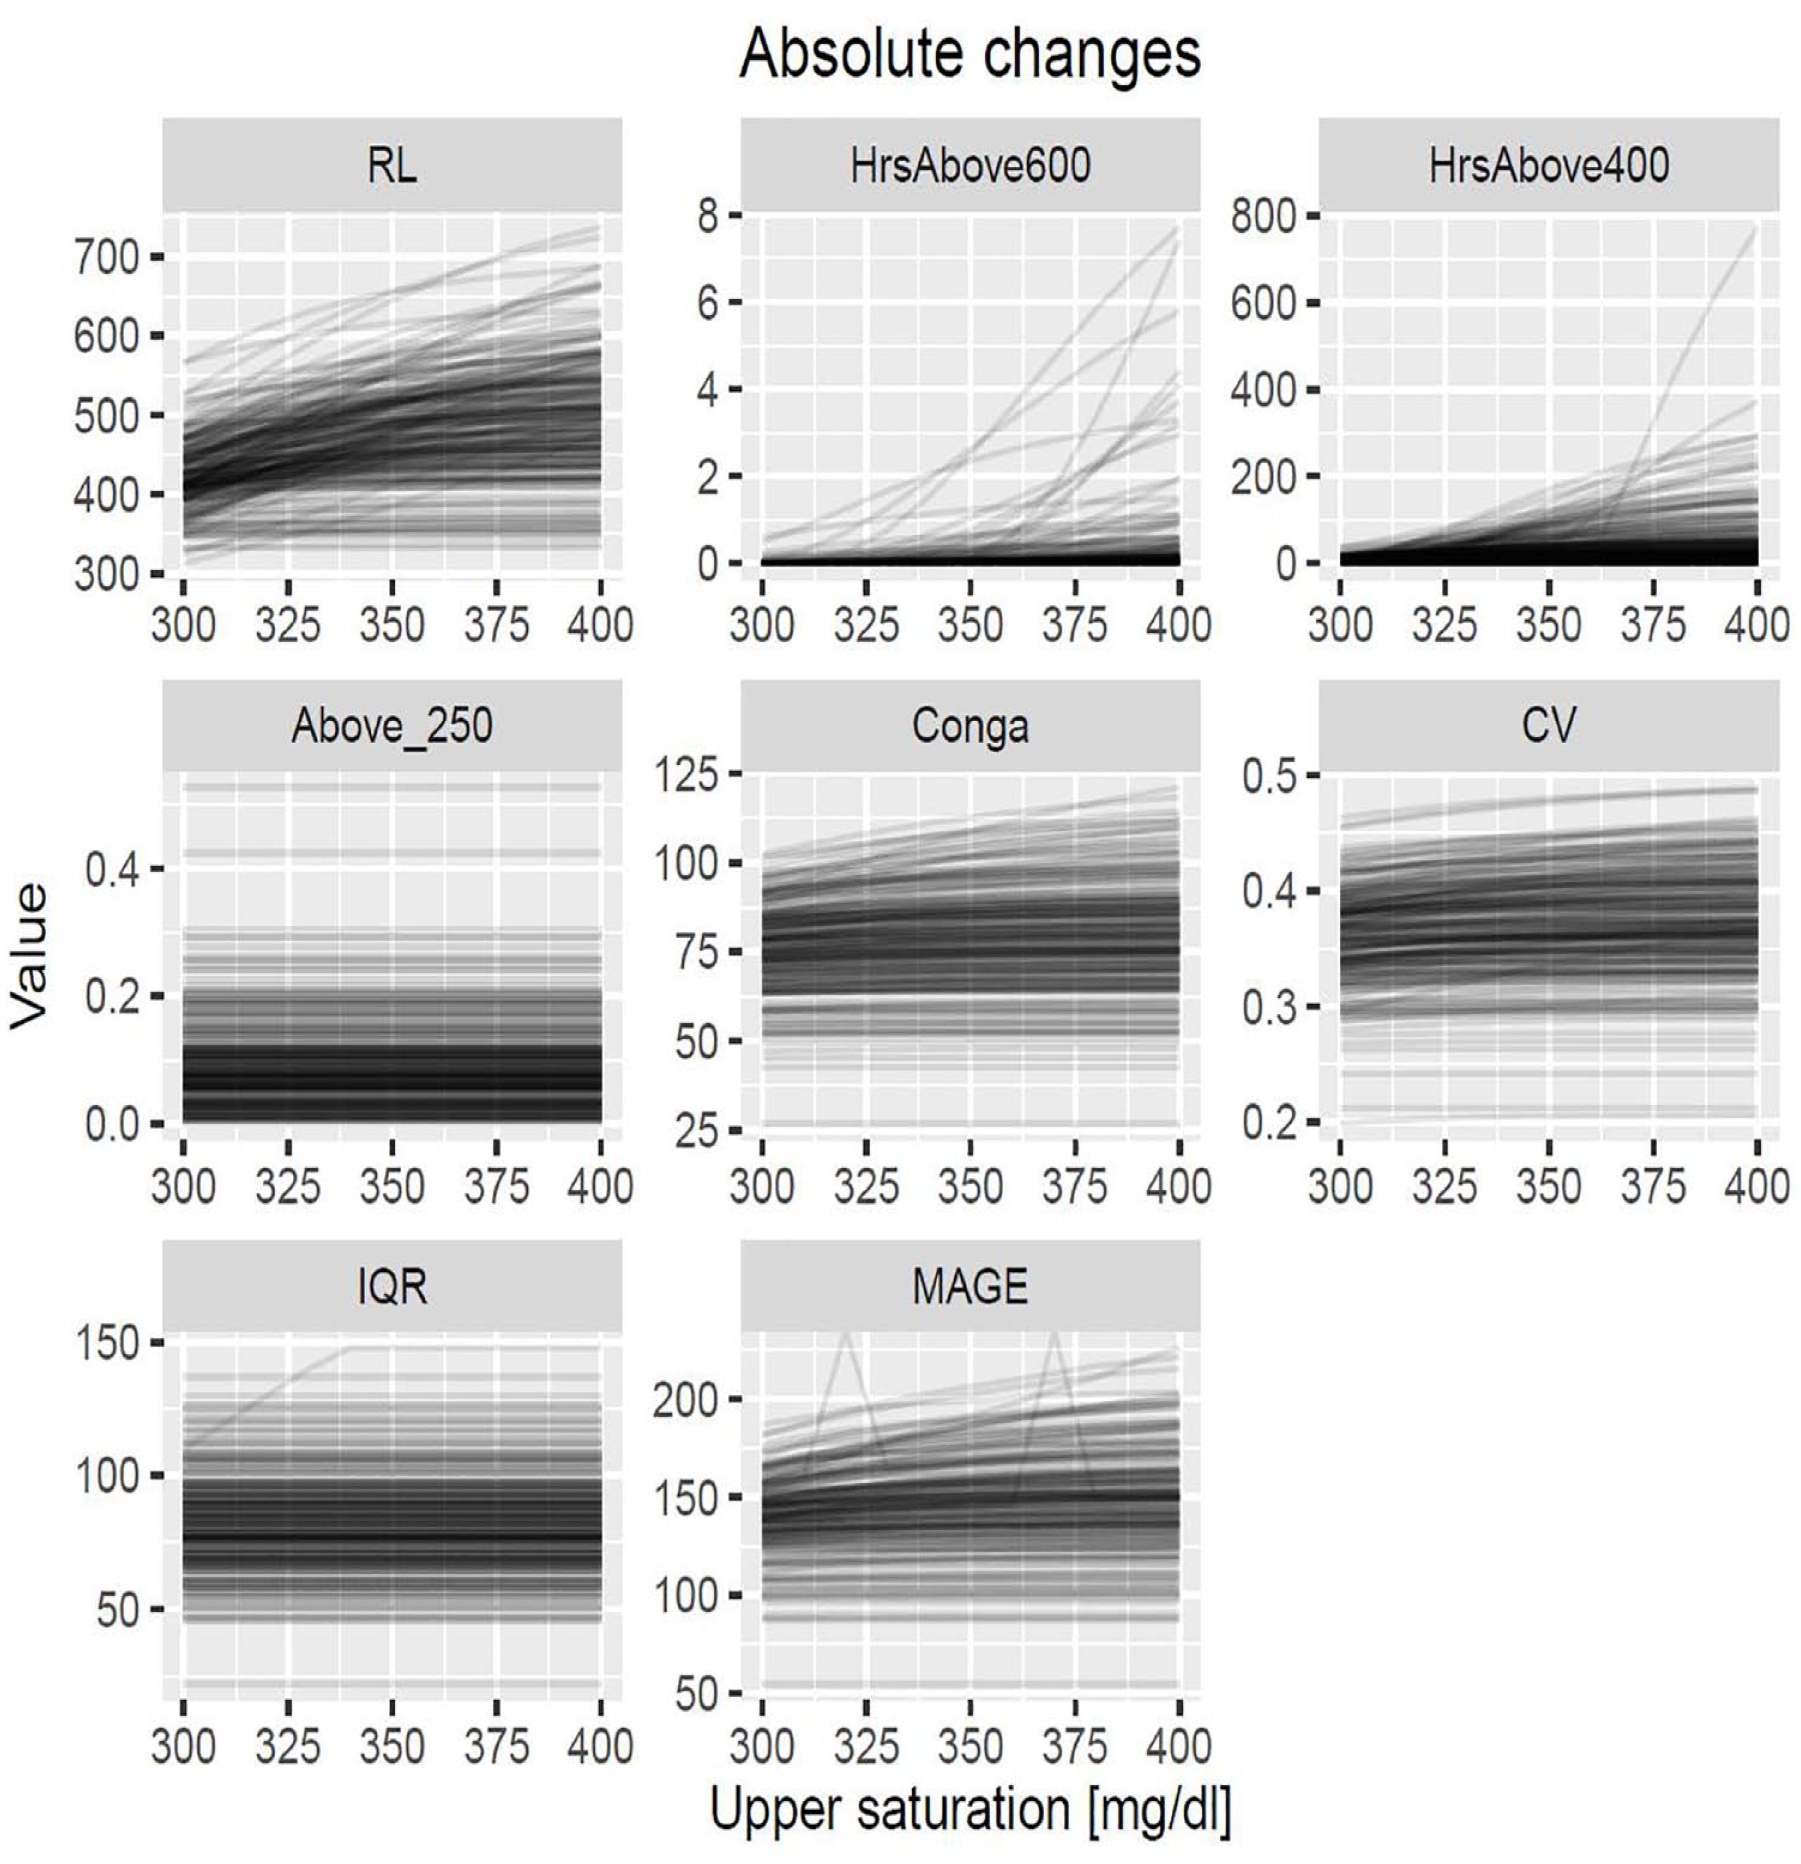
Impact of upper saturation level (trimming) on traditional GV metrics and metrics based on EVS. Values of the metrics are shown for a given saturation level.
Sentence “Classical metrics were calculated for each patient. These metrics included the time spent in standardized ranges specified by Battelino et al,14 mean daily CONGA,13 CV,26 interquartile range (IQR),27 and mean daily MAGE12 and MAGE+ which is the same but for the ascending phases only.”
Have been corrected as: “These metrics included the time spent in standardized ranges specified by Battelino et al,14 mean daily CONGA,13 CV,26 interquartile range (IQR),27 and mean daily MAGE.”
Sentence “The analysis was carried out using the R statistical program package version 4.1.029 with ExtRemes 2.130 and gluvarpro 4.031 packages.”
Have been corrected as: “The analysis was carried out using the R statistical program package version 4.1.029 with ExtRemes 2.130 and iglu 3.2.231 packages.”
Earlier reference [31] “Contador S. gluvarpro: glucose variability measures from continuous glucose monitoring data; 2019. https://rdrr.io/cran/gluvarpro/. Accessed November 6, 2021.” has been replaced with reference “Broll S, Urbanek J, Buchanan D, et al. Interpreting blood GLUcose data with R package iglu. PloS one 2021;16:e0248560.”
Corrected Figure 2, 5 and Figure S9 are given below:
The online version of the article has been corrected.