
Abstract
Background:
The Glycemia Risk Index (GRI) was introduced as a single value derived from the ambulatory glucose profile that identifies patients who need attention. This study describes participants in each of the five GRI zones and examines the percentage of variation in GRI scores that is explained by sociodemographic and clinical variables among diverse adults with type 1 diabetes.
Methods:
A total of 159 participants provided blinded continuous glucose monitoring (CGM) data over 14 days (mean age [SD] = 41.4 [14.5] years; female = 54.1%, Hispanic = 41.5%). Glycemia Risk Index zones were compared on CGM, sociodemographic, and clinical variables. Shapley value analysis examined the percentage of variation in GRI scores explained by different variables. Receiver operating characteristic curves examined GRI cutoffs for those more likely to have experienced ketoacidosis or severe hypoglycemia.
Results:
Mean glucose and variability, time in range, and percentage of time in high, and very high, glucose ranges differed across the five GRI zones (P values < .001). Multiple sociodemographic indices also differed across zones, including education level, race/ethnicity, age, and insurance status. Sociodemographic and clinical variables collectively explained 62.2% of variance in GRI scores. A GRI score ≥84.5 reflected greater likelihood of ketoacidosis (area under the curve [AUC] = 0.848), and scores ≥58.2 reflected greater likelihood of severe hypoglycemia (AUC = 0.729) over the previous six months.
Conclusions:
Results support the use of the GRI, with GRI zones identifying those in need of clinical attention. Findings highlight the need to address health inequities. Treatment differences associated with the GRI also suggest behavioral and clinical interventions including starting individuals on CGM or automated insulin delivery systems.
Keywords
Introduction
The Glycemia Risk Index (GRI) was recently introduced to provide a single value derived from the ambulatory glucose profile (AGP) that identifies patients who need clinical attention. 1 A main benefit of a single number that takes multiple dimensions of glycemic quality into account is that it allows for quick assessment of a person’s glycemia in clinical practice. This is especially important with increasing use of continuous glucose monitoring (CGM), particularly among people with type 1 diabetes (T1D). A recent survey of 182 diabetes care providers reported that less than half of those surveyed felt they had enough time to review and interpret CGM data. 2 Thus, health care providers could benefit from a single CGM-derived AGP metric to be able to quickly identify patients most in need of immediate care, to identify whether treatment modifications are needed, and to track a patient’s response to treatment changes.
The widely used AGP, 3 recommended by the American Diabetes Association, 4 presents seven key metrics from CGM tracings that include percentage time in range (TIR); time in low, very low, high, and very high glucose ranges; mean glucose; and coefficient of variation (CV). Time in range has been proposed as a good single representative AGP metric that may be a close indicator for overall glycemic control. 4 However, using only TIR leads clinicians to ignore other important glycemic information (time in very low and very high glucose ranges). Klonoff and colleagues 1 describe specific cases where TIR alone did not provide a good indicator of overall glycemic quality. For example, two cases had very different TIR (31% vs 55%) but similar GRI scores (76 and 75) as the person with the higher TIR experienced significant hypoglycemia. Another example is a patient whose TIR worsened from 46% to 40% while the GRI improved from 90 to 75, after treatment modification that reduced hypoglycemia from 16% to 6% and increased time in hyperglycemia. These cases illustrate how the GRI can provide a more accurate clinical picture by incorporating multiple dimensions of glycemic quality.
The GRI scores are organized in zones, to ease interpretability and to facilitate the tracking of glycemic quality over time. Klonoff and colleagues 1 created five zones, with zone A indicating the highest quality of glycemia and zone E indicating the lowest quality of glycemia (see Figure 1). However, it remains unclear how zones differ from one another across all seven AGP metrics, which was not reported in the original article. 1 Also, various characteristics including demographics and treatment regimen have not been investigated across the GRI zones. Such knowledge may further help clinicians interpret GRI scores and identify targets for intervention.
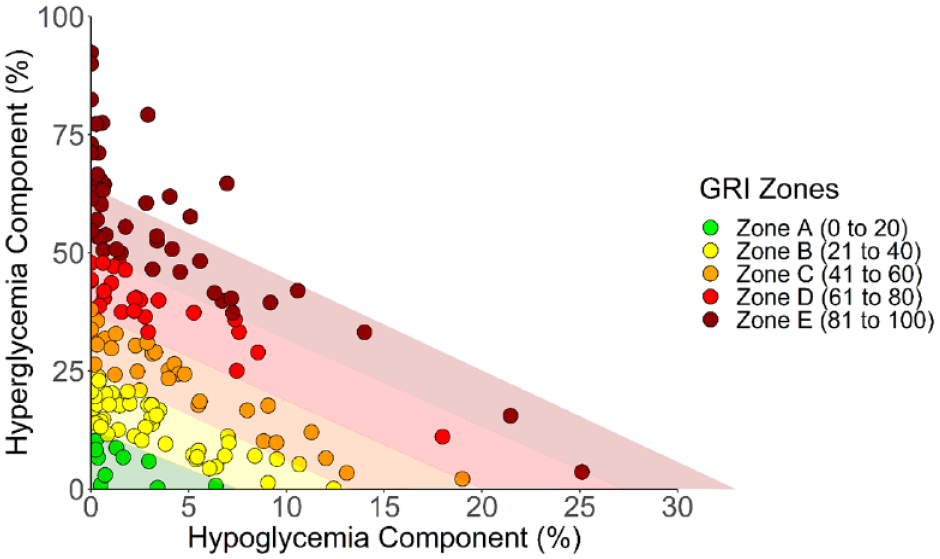
A GRI grid showing the GRI zones and hyperglycemia component versus the hypoglycemia component for all 159 CGM tracings. The zone bars are calculated based on the GRI formula indicating predictions of clinicians’ percentile rankings; GRI scores >100 were set at 100 as instructed by Klonoff et al. 1
The GRI is not yet in general use and needs further study. Here, the GRI is explored in an intensive longitudinal study examining the relationships among continuous glucose measurement, functioning, and emotion. 5 The primary aim of this analysis was to describe participants in each GRI zone by CGM metrics, sociodemographics, treatment regimen, diabetes self-management, and self-reports of diabetic ketoacidosis (DKA) and level 3 (severe) hypoglycemic episodes over the past six weeks. Additionally, we aimed to examine how much of GRI score variance could be explained by sociodemographic and clinical variables to help guide interventions. We hypothesized that demographics, socioeconomic status (SES), engagement in self-management, and use of CGM or automated insulin delivery (AID) systems would each explain a meaningful percentage of variance in GRI scores supporting interventions focused on social determinants of health, engagement in self-management, and CGM or AID initiation.6 -12
Methods
Study Sample and Procedures
We computed GRI scores for 159 of 208 participants who had CGM data for at least 70% of the two-week study period. 13 Participants were recruited primarily from three different clinical sites in Los Angeles, CA, and the Bronx, NY. Eligibility included having a diagnosis of T1D for at least one year, being on stable diabetes therapy for at least three months, and to have no plans to participate in medical procedures that could impact their CGM readings. Full details of the study protocol have been published previously. 5 The study protocol was approved by the Institutional Review Boards of the University of Southern California and the Albert Einstein College of Medicine. All participants provided informed consent prior to engaging in study procedures.
Measures
Demographics
Demographic variables collected at baseline included age, gender, race/ethnicity, marital status, and SES variables (employment status, annual household income, level of education, and type of health insurance).
Clinical information
Data were collected on each participants’ treatment regimen, which was categorized as (1) being on an AID, (2) using CGM with injection therapy or non-automated pumps, or (3) using a blood glucose (BG) monitoring without CGM. With reference to the past six months, participants were also asked to report the number of times the following events occurred: “severe low blood sugar that resulted in passing out, losing consciousness, or seizure” and “diabetic ketoacidosis (high blood sugar plus ketones, also known as DKA) diagnosed by a doctor for which you went to the hospital, emergency room, or another health care facility.”
CGM metrics
Glucose levels were assessed continuously (every 15 minutes) using blinded Abbott Libre Pro devices and reprocessed using an algorithm equivalent to the FreeStyle Libre 2 system (Abbott Diabetes Care, Alameda, CA). Metrics extracted from the downloaded comma-separated values (CSV) files with CGM data included mean glucose, glycemic variability, percentage of TIR (70-180 mg/dL), percentage of time in low (54-69 mg/dL), percentage of time in very low (<54 mg/dL), percentage of time in high (181-250 mg/dL), and percentage of time in very high (>250 mg/dL) glucose ranges.14,15 The GRI was calculated using the equation presented in the original article (GRI = [3.0 × time very low BG] + [2.4 × time low BG] + [1.6 × time very high BG] + [0.8 × time high BG]). The lowest possible score is 0, and the maximum permissible value is 100. 1 Each score falls in one of five GRI zones that each include equally sized bins of 20, with zone A (0-20) indicative of the lowest level of glycemia risk and zone E (81-100) indicative of the highest risk. 1
Engagement in self-management
The 16-item Diabetes Self-Management Questionnaire (DSMQ) 16 was used to assess engagement in following a healthy diet, glucose monitoring, and exercise. All items use a four-point Likert-type scale from 0 (“does not apply to me”) to 3 (“applies to me very much”), and scale scores are summed and then transformed to a scale ranging from 0 to 10, with higher scores indicating more engagement in self-management behavior. 16
Statistical Analyses
In bivariate analyses, we examined demographic and diabetes-relevant characteristics of participants in the five GRI zones. For each level of a categorical variable, frequency counts and percentages were computed by GRI zone. Chi-square tests were used to assess if there was a significant association between each categorical variable and GRI zone; Fisher exact test was used when there were cell counts less than or equal to five in the two-way contingency table. With continuous variables, means and standard deviations were computed by GRI zone. One-way analyses of variance were run to examine if continuous variables significantly differed by GRI zone. Exploratory receiver operating characteristic (ROC) analyses were conducted to examine GRI cutoff scores to identify those who are more likely to have experienced DKA or level 3 hypoglycemic episodes over the previous six months. In ROC analyses, area under the curve (AUC) values of 0.7 to 0.8 were considered acceptable, and values 0.8 to 0.9 were considered excellent. 17
We also analyzed how much of the variance in GRI scores could be explained by sociodemographic and clinical variables in multiple regression analyses. Shapley value analysis using R 18 was run to examine the relative importance of the set variables as predictors of GRI score variance, after accounting for the order in which variables were added to the model. Shapley scores indicate the amount of variance explained by a variable, averaged over the multiple possible sequences in which variables can be added to the regression model. 18 For these analyses, missing values on predictor variables were imputed using 10 multiple imputations in R. 19 Shapley scores were averaged across the 10 data sets.
Results
Sample Characteristics
The 159 individuals with sufficient CGM data were similar to the full study sample, but they were slightly older and had higher education.
Of the sample, 54.1% were female, and the average age was 41.4 years (SD = 14.5) (Table 1). The most represented racial/ethnic groups were Hispanic (41.5%), non-Hispanic (NH) white (30.2%), and NH black (14.5%). A similar percentage of the sample had government-sponsored insurance (38.4%) or private insurance (39.0%). A range of income groups were represented.
Sample Characteristics.
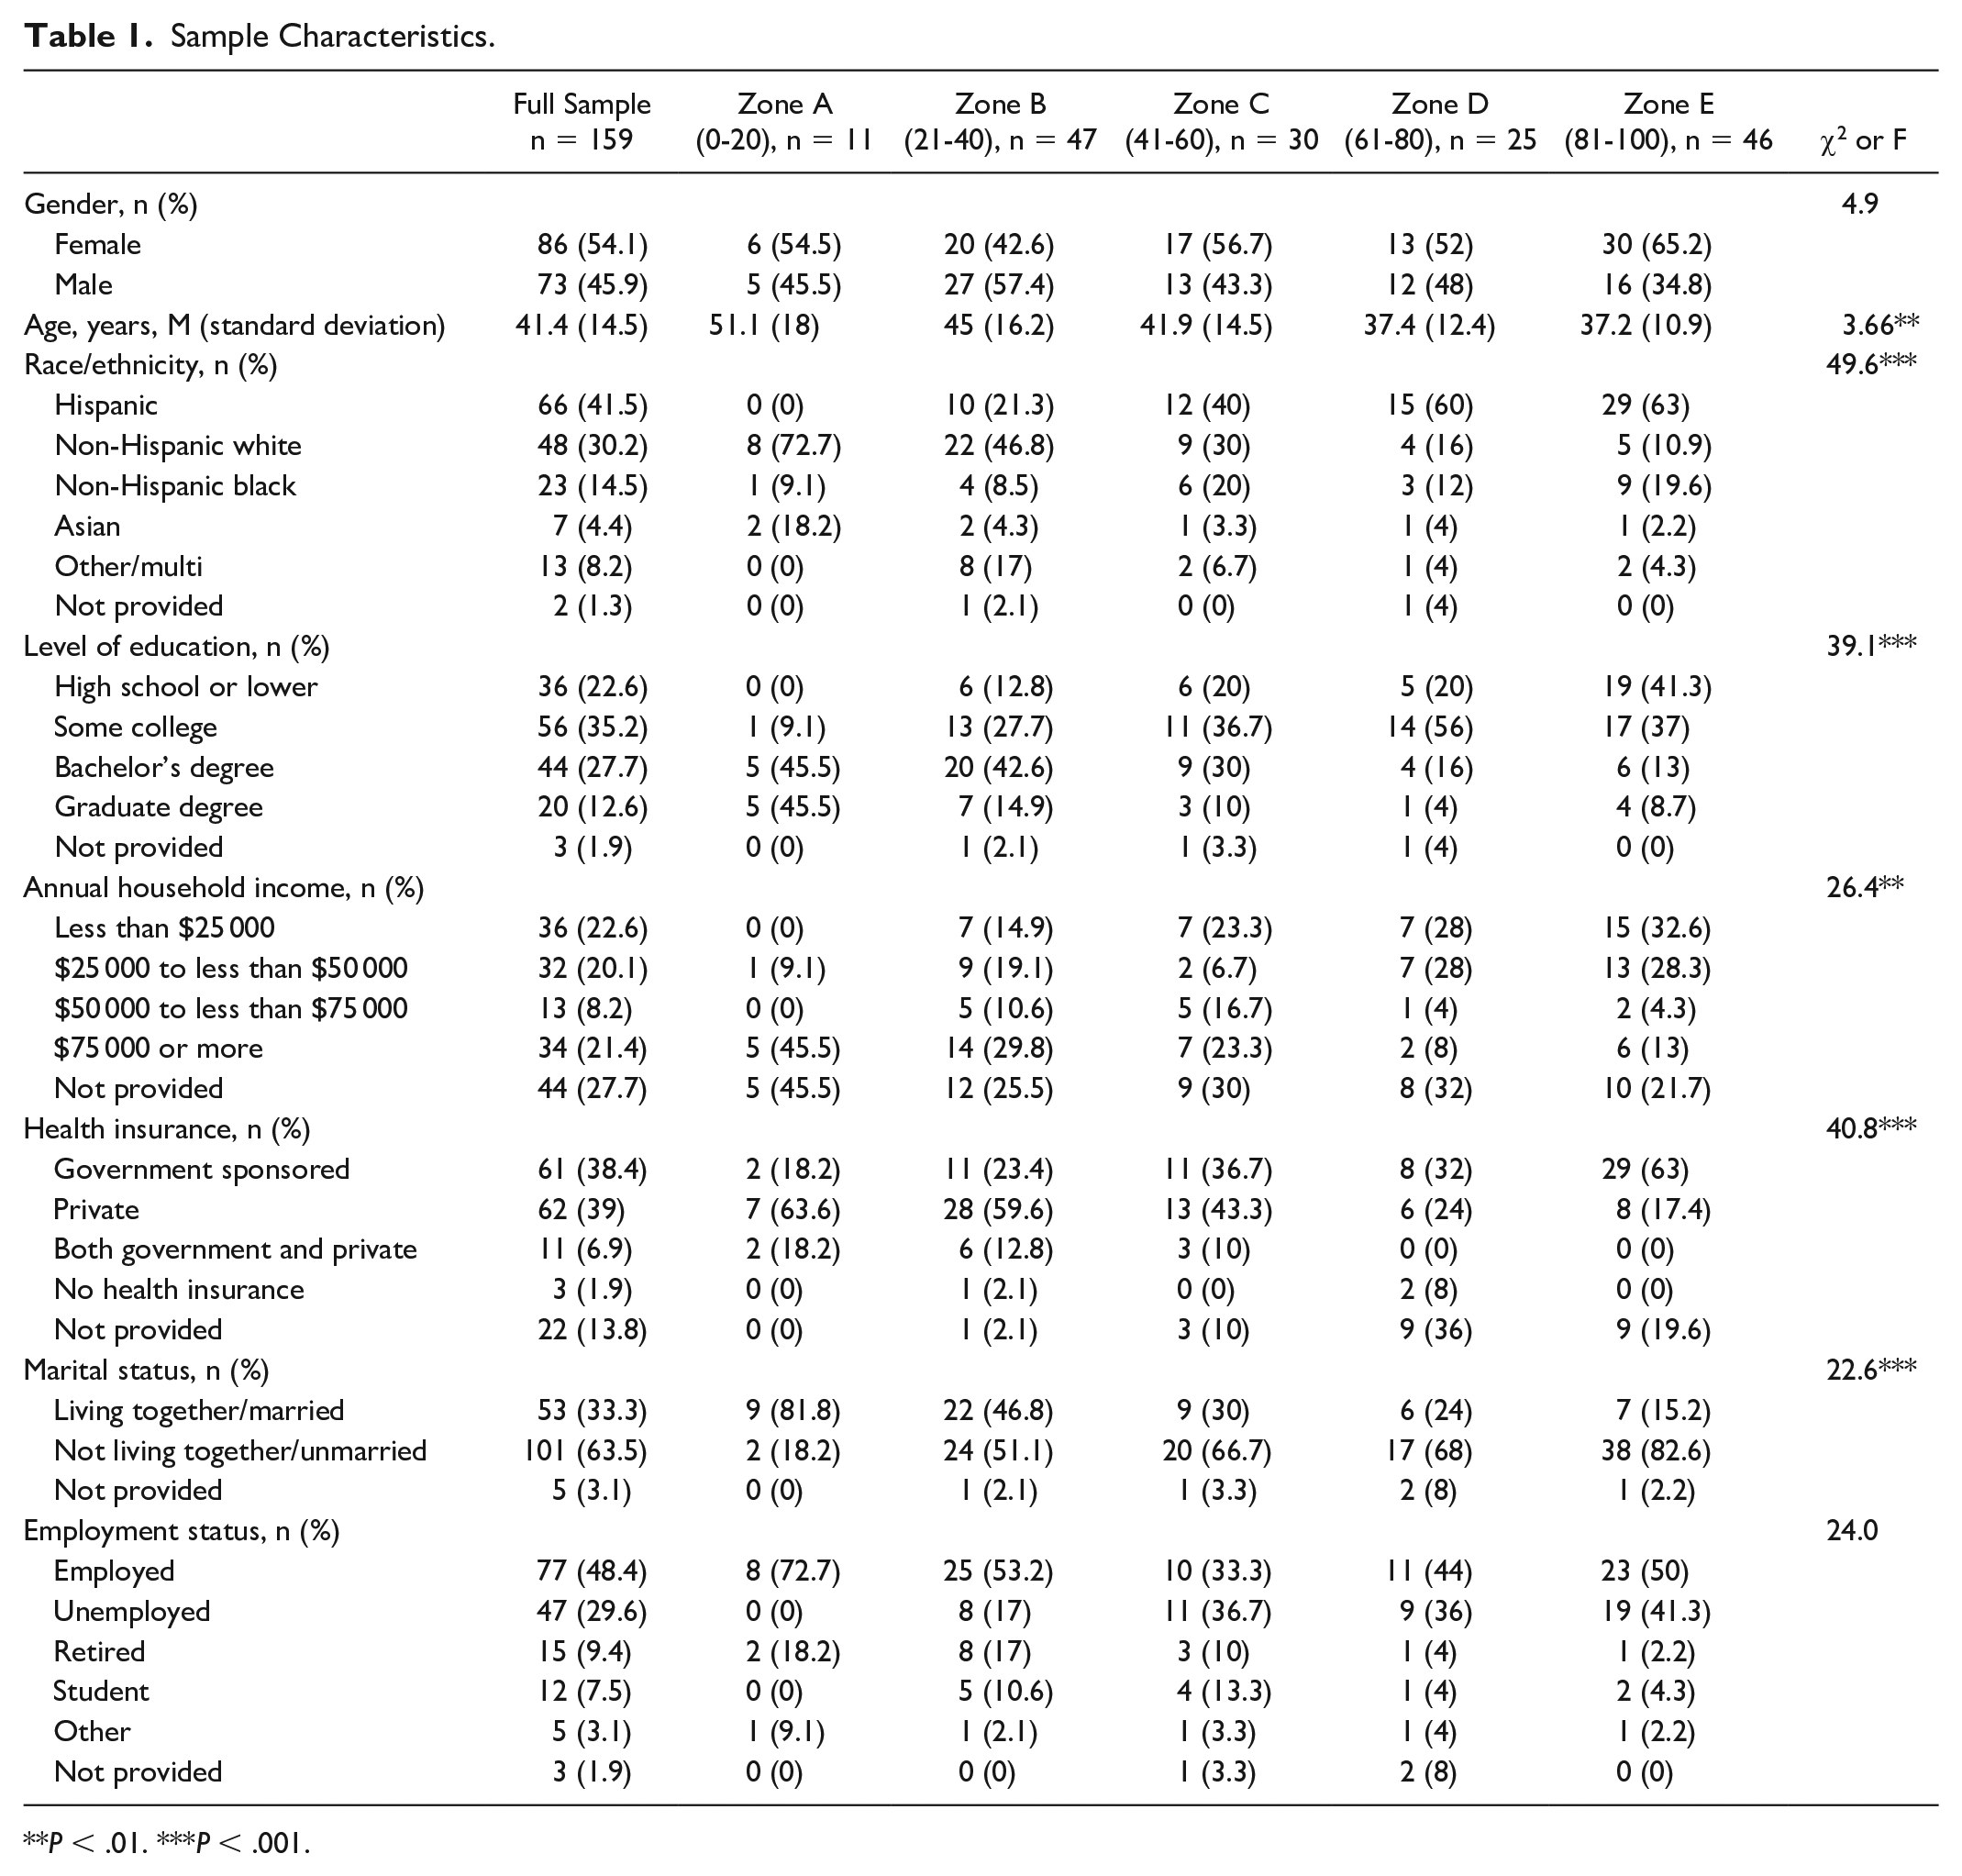
P < .01. ***P < .001.
As shown in Table 2, participants on average had a mean glucose level of 183.6 mg/dL (SD = 54.2), a percentage of TIR of 53.5 (SD = 22.0), and a GRI score of 58.5 (SD = 28.1). The least frequent treatment regimen was the use of AID (23.3%). The mean rating of participation in self-management was 7.3 (SD = 1.5). A total of 15.7% self-reported experiencing one or more DKA events, and 11.3% self-reported experiencing a level 3 hypoglycemic event over the previous six months.
CGM Metrics, Treatment, and Self-Reported DKA and Level 3 Hypoglycemia.
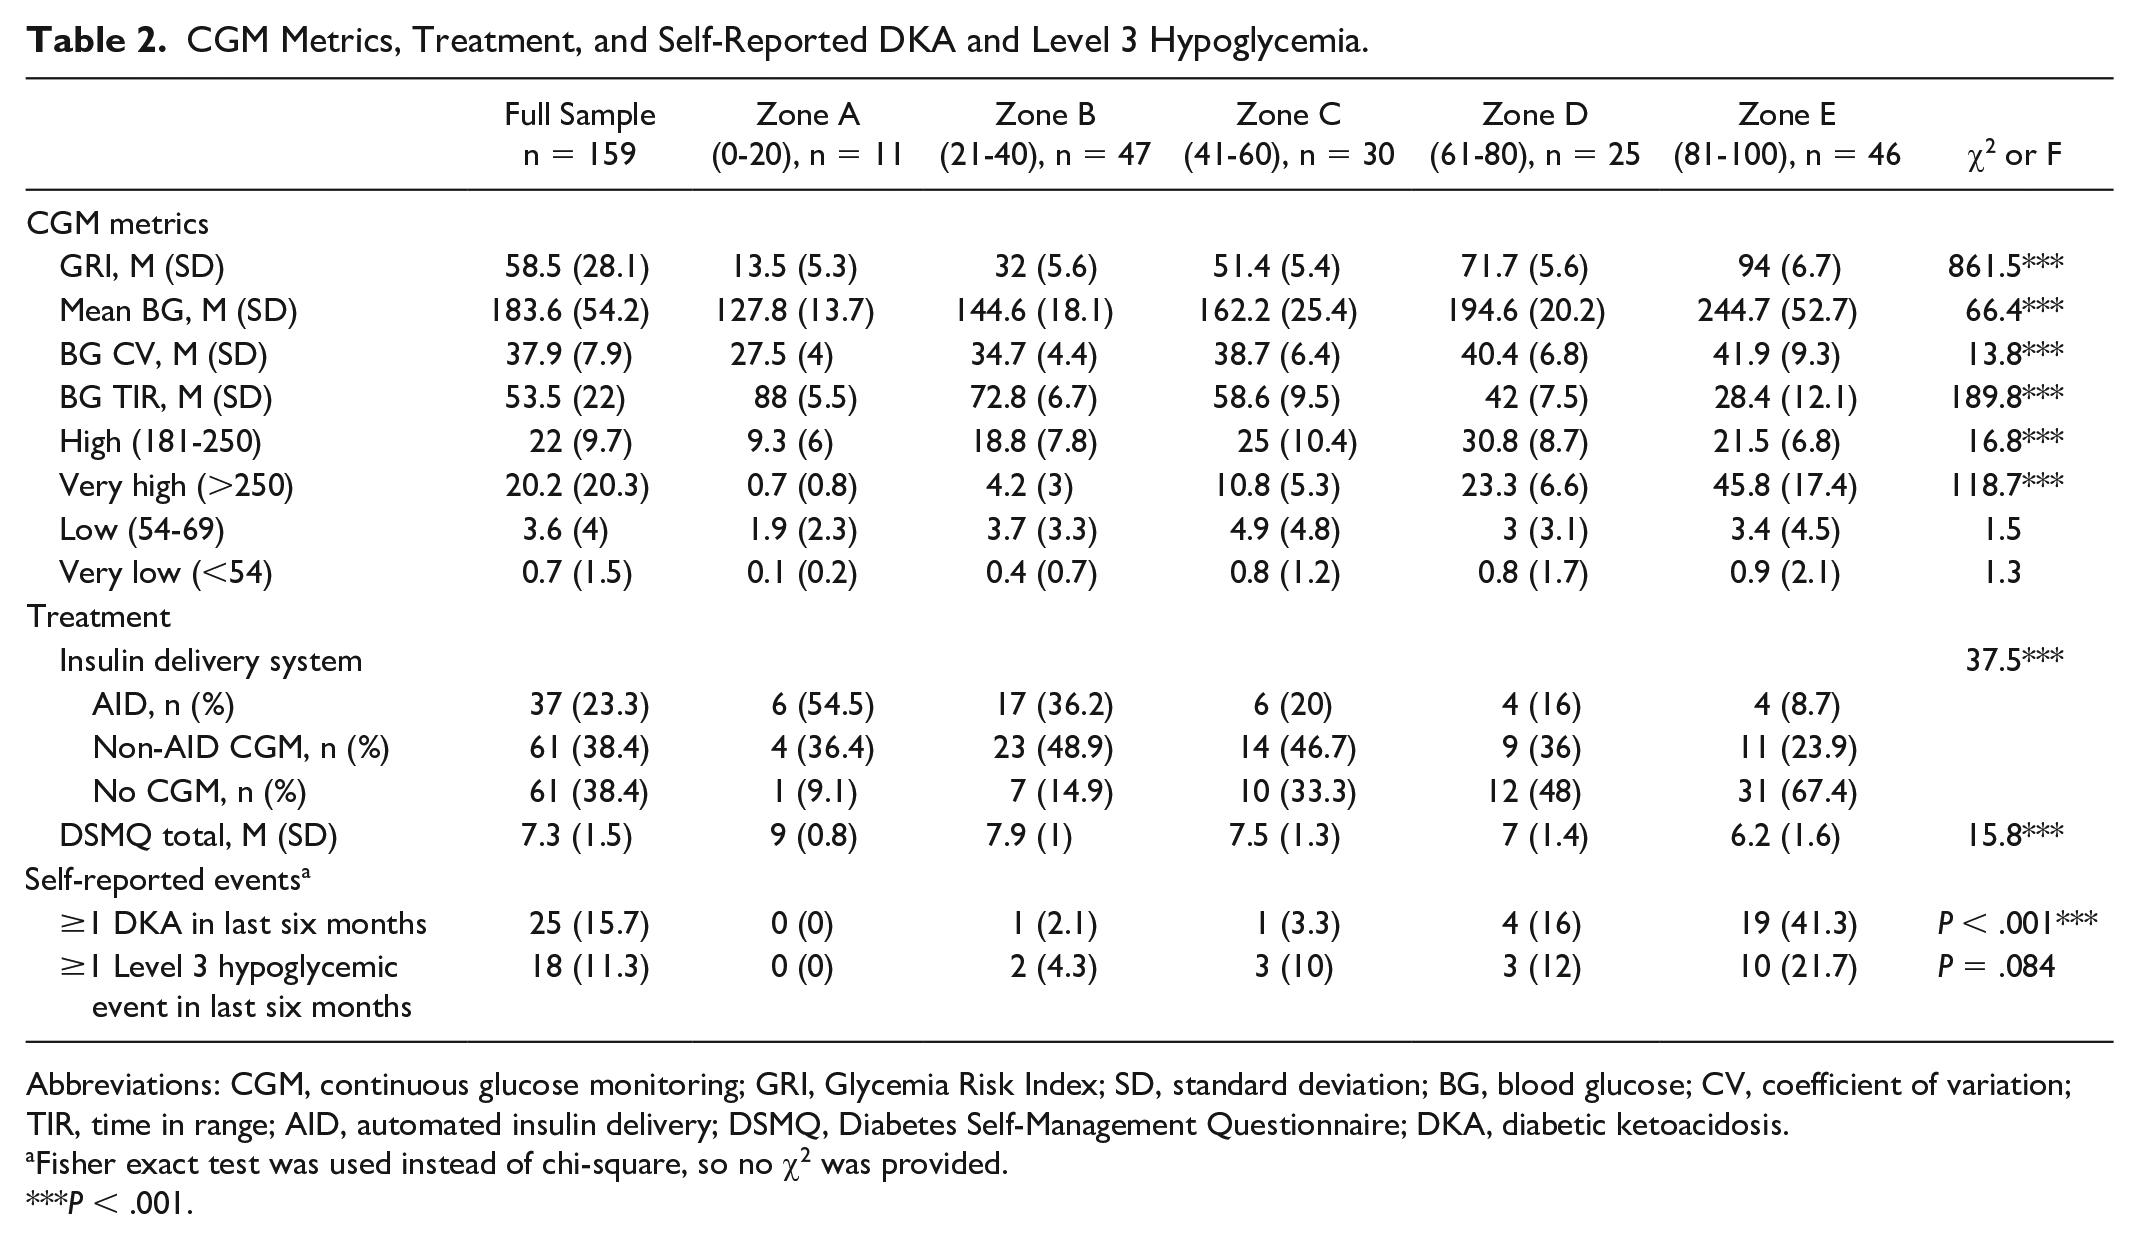
Abbreviations: CGM, continuous glucose monitoring; GRI, Glycemia Risk Index; SD, standard deviation; BG, blood glucose; CV, coefficient of variation; TIR, time in range; AID, automated insulin delivery; DSMQ, Diabetes Self-Management Questionnaire; DKA, diabetic ketoacidosis.
Fisher exact test was used instead of chi-square, so no χ2 was provided.
P < .001.
GRI Zones and Demographic Variables
Figure 1 shows a GRI grid indicating the GRI zones and the hyperglycemia component versus the hypoglycemia component for the 159 CGM tracings. The most commonly assigned zone was B (n = 47; 29.6%), followed by zone E (n = 46; 28.9%), zone C (n = 30; 18.9%), zone D (n = 25; 15.7%), and zone A was the least frequent (n = 11; 6.9%) (Table 2). There was evidence of differences across zones for multiple indices of demographic groups, including education level, race/ethnicity, age, and insurance status (Table 1).
GRI Zones, CGM Metrics, and Treatment
Table 2 provides CGM metrics for each GRI zone. Glycemia Risk Index zones particularly differentiated individuals based on mean glucose, CV, TIR, and percentage of time in high and very high glucose ranges. In this sample, GRI zones did not differentiate individuals based on time spent in low or very low glucose ranges over the two-week monitoring period. Table 3 illustrates examples when considerably different GRI values are obtained for the same TIR value. For example, two individuals with a TIR of 52% can have vastly different GRI scores (eg, 55.5 vs 89.2) because of large differences in time spent in low (2.7% vs 12.1%) and very low (0.2% vs 11.8%) glucose ranges.
Examples of Cases With Similar TIR Associated With Different GRI Scores and Zones.
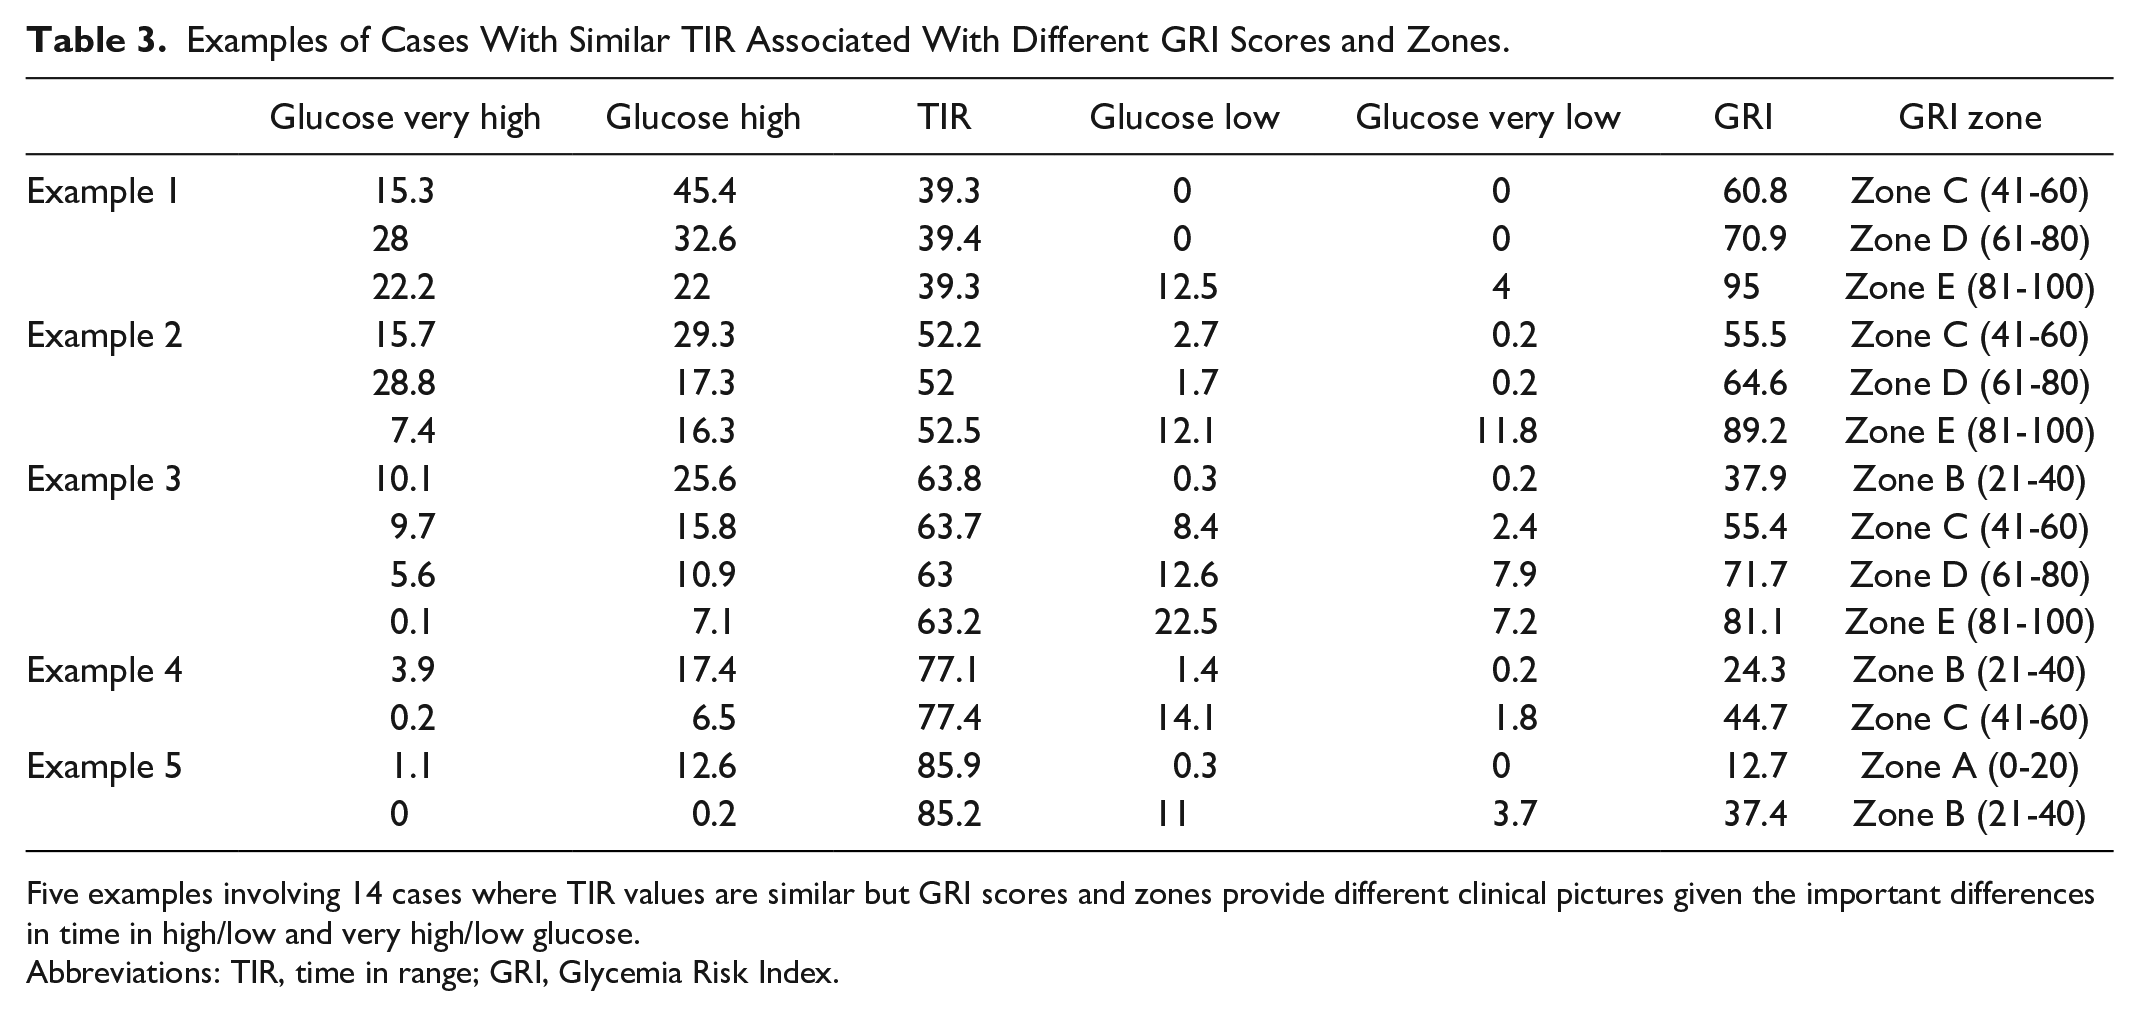
Five examples involving 14 cases where TIR values are similar but GRI scores and zones provide different clinical pictures given the important differences in time in high/low and very high/low glucose.
Abbreviations: TIR, time in range; GRI, Glycemia Risk Index.
Compared to patients who did not use CGM, the use of AID and non-AID CGM was associated with being in a GRI zone indicating better glycemic quality. Similarly, greater participation in self-management was associated with a GRI zone indicating better glycemia (Table 2).
GRI Zones and Episodes of DKA and Level 3 Hypoglycemia
Table 2 includes information on self-reported episodes of DKA and level 3 hypoglycemia in relation to GRI zones. Self-reported incidence of DKA over the previous six months differed significantly across GRI zones, with 0% in zone A and 41% in zone E reporting a DKA event. There was a trend toward self-reported level 3 hypoglycemic episodes over the previous six months significantly differing across GRI zones. Patterns were similar to those observed for DKA events.
Exploratory ROC analyses were run to identify GRI cut-points associated with the potential occurrence of severe glycemic events. Receiver operating characteristic analyses indicated that a GRI score ≥84.5 best reflected a greater likelihood of at least one DKA event (AUC = 0.848; Figure 2). A GRI score ≥58.2 best reflected a greater likelihood of at least one level 3 hypoglycemic episode (AUC = 0.729; Figure 3). We also explored whether the hyperglycemia and hypoglycemia component scores more closely reflected DKA and level 3 hypoglycemia events than the single GRI metric. Of the 18 participants who experienced a level 3 hypoglycemia event, 11 also experienced a DKA event, indicating high glycemic dysregulation in those individuals. Figure S1 in Supplementary Material shows the hyperglycemia component scores and DKA events, and Figure S2 in Supplementary Material shows the hypoglycemia component scores and level 3 hypoglycemia events. The GRI was similar (AUC = 0.848) to the hyperglycemia component (AUC = 0.857) in reflecting DKA events. The GRI outperformed (AUC = 0.729) the hypoglycemia component (AUC = 0.541) in reflecting level 3 hypoglycemia events.
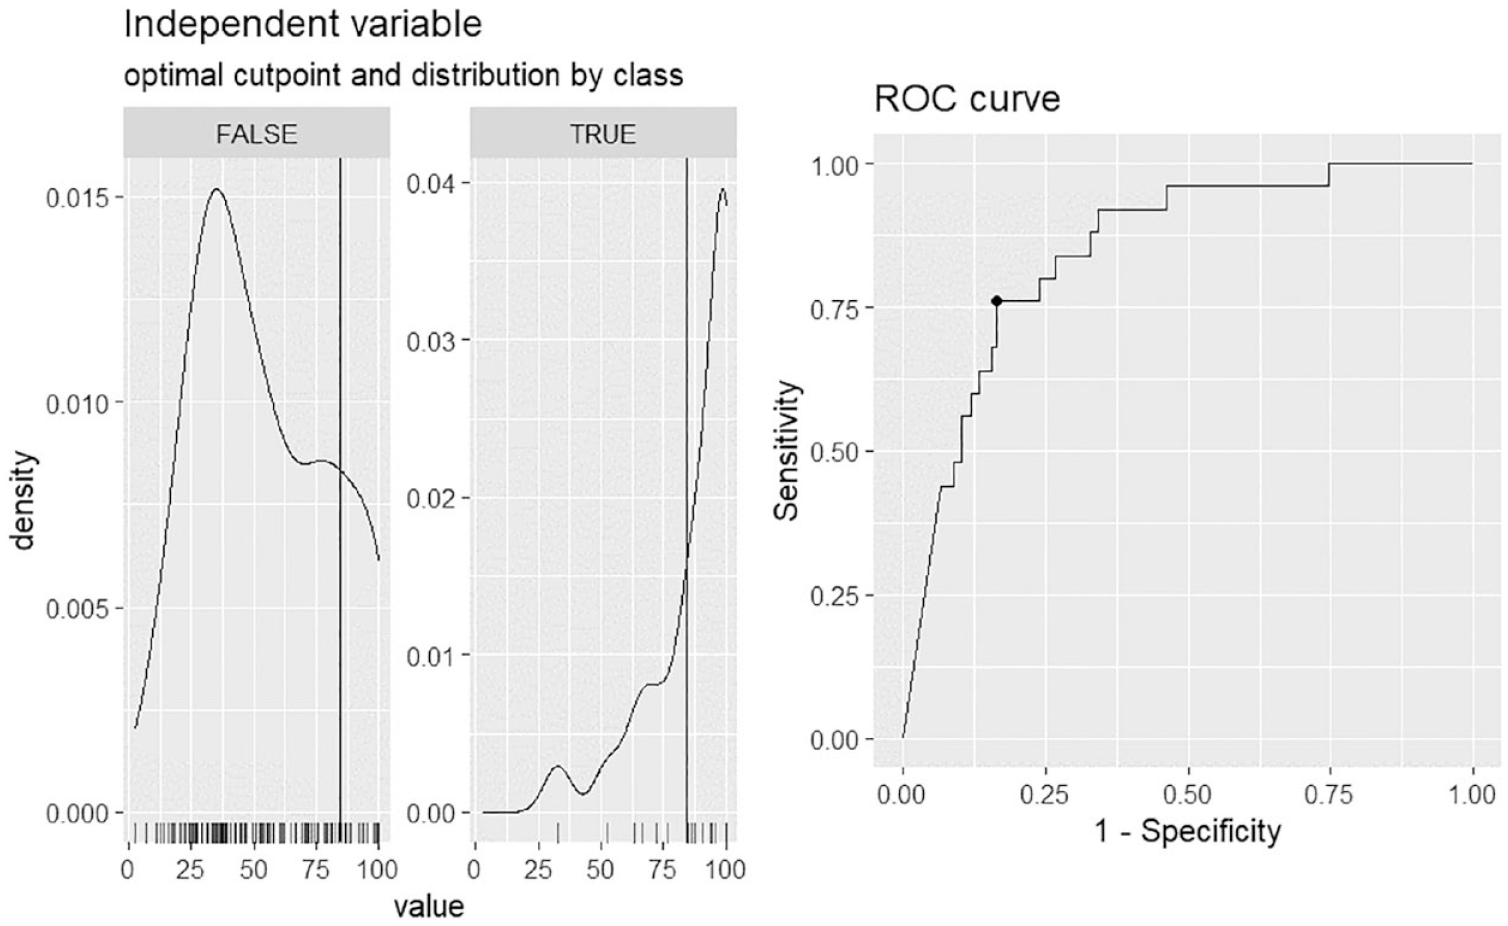
ROC curve for the GRI and diabetic ketoacidosis. Based on the ROC analyses, a GRI value of 84.50 or higher reflects a higher occurrence of serious DKA in the past six months, with an AUC of 0.848.
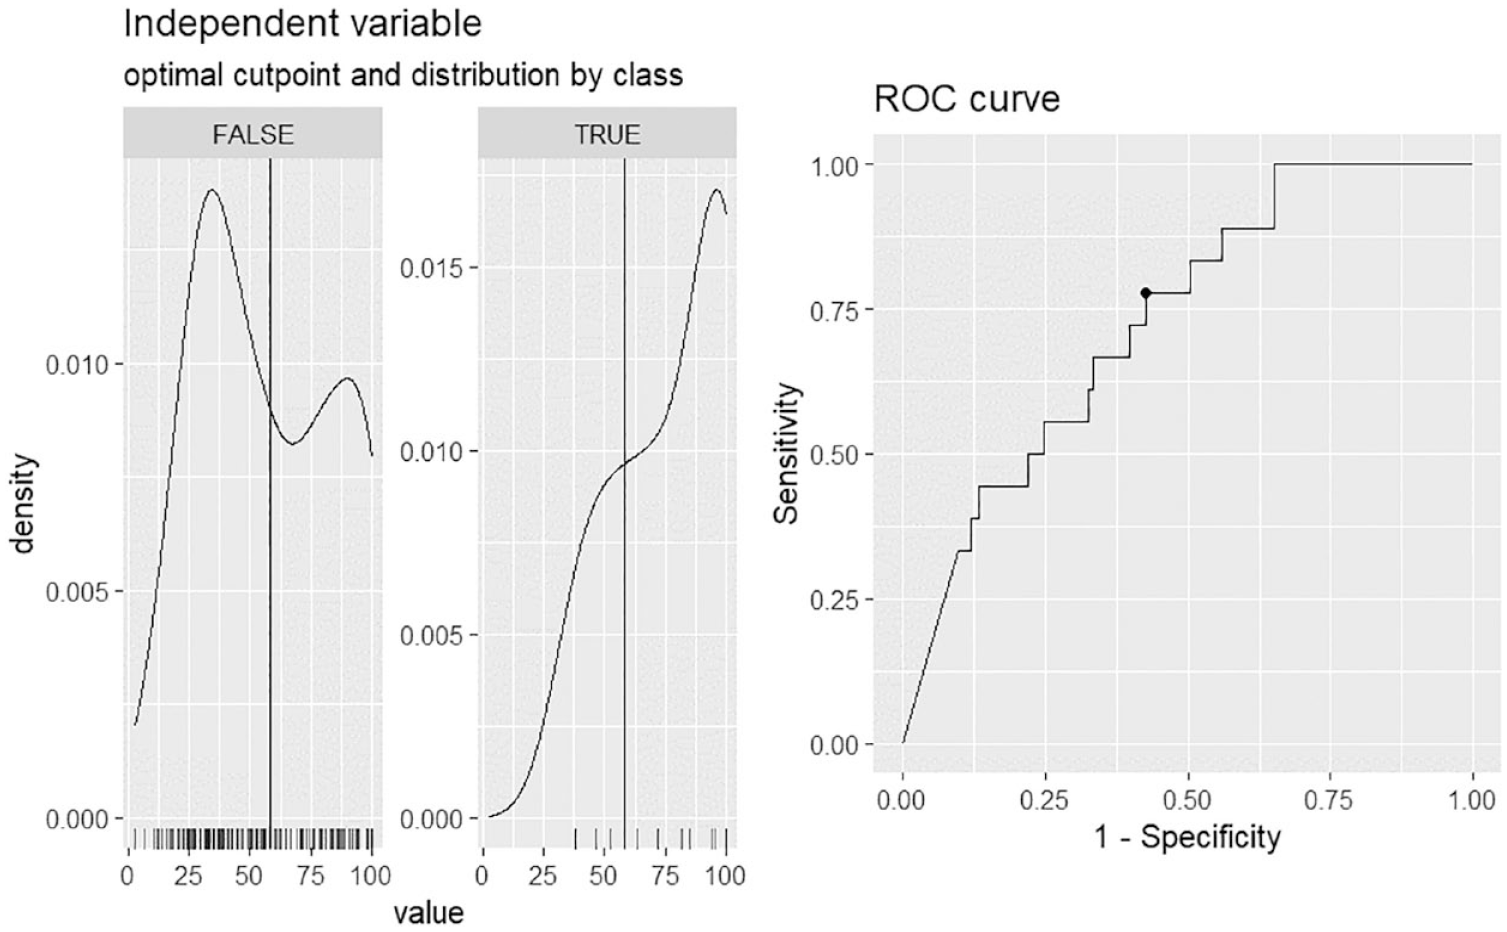
ROC curve for the GRI and level 3 hypoglycemia. Based on the ROC analyses, a GRI value of 58.16 or greater reflects higher occurrence of a level 3 hypoglycemic event in the past six months, with an AUC of 0.729.
Variability in GRI Scores Explained By Demographic, Socioeconomic Status, and Treatment Characteristics
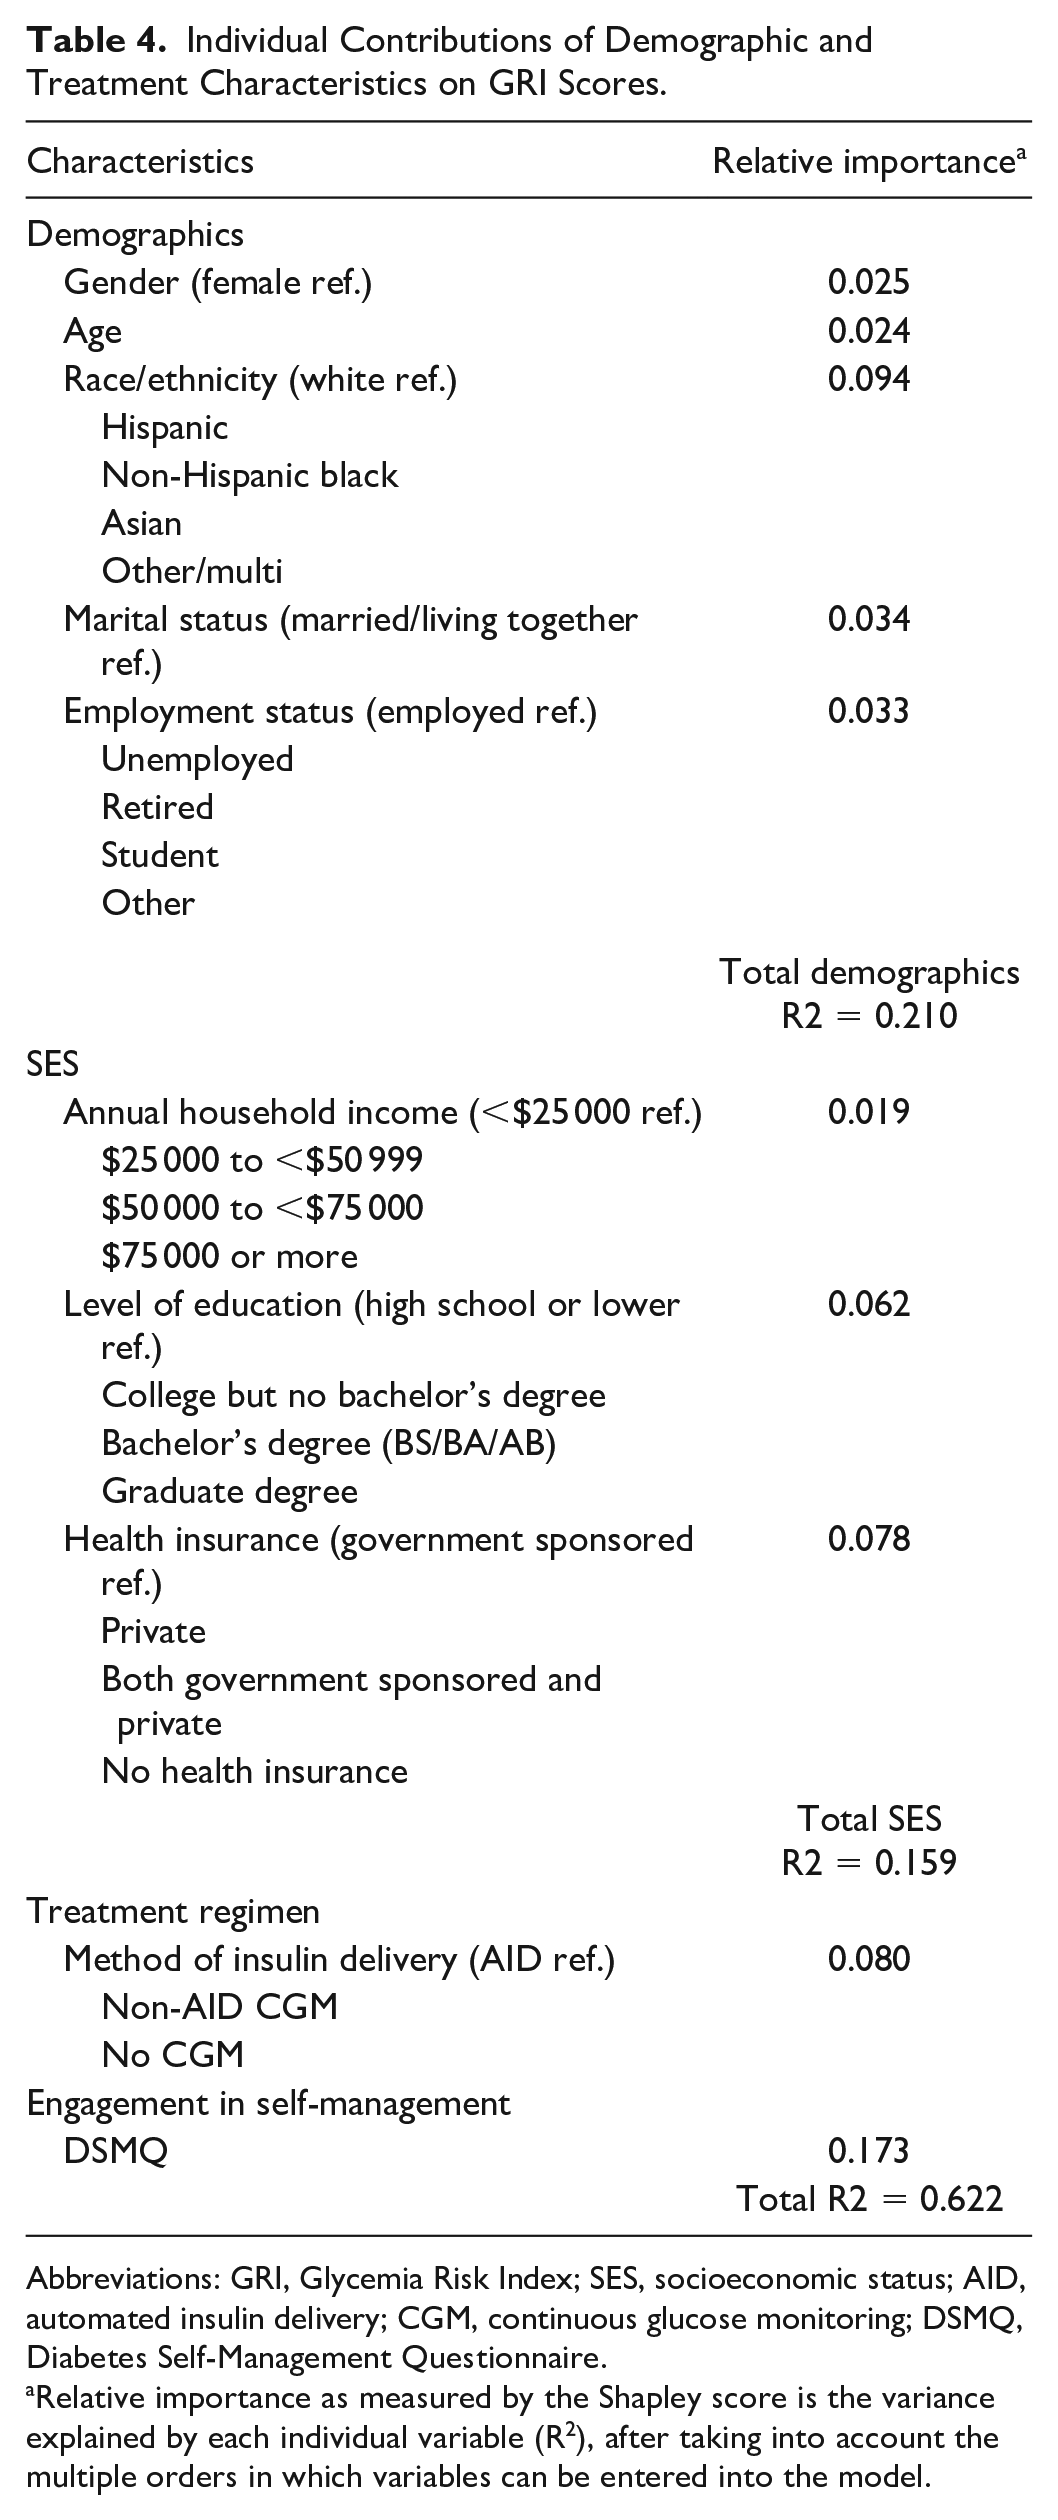
Table 4 presents the percentage of variability in GRI scores explained by various demographic, SES, and treatment characteristics as determined by the Shapley analysis. Results suggested that demographic variables explained the largest percentage of variability in GRI scores (21.0%), followed by engagement in self-management (17.3%), indicators of SES (15.9%), and treatment regimen (8.0%). A total of 37.8% of the variance in GRI scores remained unaccounted for. When considering individual measures, rather than conceptual blocks, diabetes self-management assessed by the DSMQ (17.3%), race/ethnicity (9.4%), method of insulin delivery (8.0%), and insurance coverage (7.8%) explained the largest percentage of variability in GRI scores.
Individual Contributions of Demographic and Treatment Characteristics on GRI Scores.
Abbreviations: GRI, Glycemia Risk Index; SES, socioeconomic status; AID, automated insulin delivery; CGM, continuous glucose monitoring; DSMQ, Diabetes Self-Management Questionnaire.
Relative importance as measured by the Shapley score is the variance explained by each individual variable (R 2 ), after taking into account the multiple orders in which variables can be entered into the model.
Discussion
The aim of this study was to describe each GRI zone and to examine the individual contributions of demographic, SES, treatment regimen, and self-care characteristics to GRI scores among a sample of diverse adults with T1D. We found that GRI zones differentiate, and identify, those most in need of clinical attention and that GRI scores are associated with real-world outcomes over a six-month period. Furthermore, we observed notable demographic and socioeconomic differences across the five GRI zones highlighting health inequities.
Results illustrate that the GRI may provide a more complete picture as an AGP-based single metric than traditionally used metrics. For example, while highly correlated with TIR, the GRI can present quite a different clinical picture that is influenced by time in high/low and very high/low glucose (see Table 3). It appears that the GRI is sensitive to very low readings and severe hypoglycemia, but not to mild hypoglycemia. Results also show that GRI zones provide meaningful information for clinicians to assess the need for clinical attention. Participants in zone A had, on average, CGM metrics indicating excellent glycemic quality that exceeds international consensus recommendations, 15 those in zone B, on average, met such consensus recommendations including a TIR above 70%, while those in zone C fell just below this. Those in zone D and E were at increased risk of experiencing level 3 hypoglycemia and DKA events, indicating that individuals in these zones would benefit from treatment changes, behavioral health interventions, or psychosocial support to prevent negative health outcomes.
Demographics, SES, one’s treatment regimen, and participation in self-management were found to explain a meaningful percentage of variability in GRI scores, with demographic variables collectively accounting for the largest percentage. Of the demographic variables, race/ethnicity stood out as an impactful single demographic variable, emphasizing the need to focus on social determinants of health in diabetes care.6,7 At the same time, engagement in self-management and one’s treatment regimen also explained a sizable percentage of the variance in GRI scores when controlling for all other variables. This aligns with intervention studies showing that CGM or AID initiation significantly improves glycemic quality,9,10 as do behavioral health interventions targeting participation in self-management.11,12 More work is needed in examining barriers to CGM or AID use, as demographic and treatment variables may interact to contribute to worse glycemic quality.6,8
Our sample that included a high representation of typically underrepresented racial/ethnic and SES individuals had higher hyperglycemia component scores than the sample of the original GRI article. 1 This led to some of our GRI scores crossing over 100, which were set at 100 as instructed by Klonoff et al 1 (see Figure 1). The original article determined weights for time in low/high and very low/high glucose levels based on clinicians’ percentile ranking of the overall glycemic quality of 225 individuals participating in one of four large multicenter randomized clinical trials.20 -23 These trials enrolled patients with T1D throughout North America; however, black and Hispanic participants were underrepresented. Participants in our sample reported a higher frequency of experiencing DKA (15.7%) over the previous six months than what is typically observed over 12 months (4.8%-12.8%) in the general population of individuals with T1D.24,25 Yet, GRI zones still meaningfully differentiated participants and reflected how factors like SES and race/ethnicity are related to glycemic quality. Moreover, because we were able to include a more diverse sample than that in previous publications, we can feel confident that the GRI is in fact more inclusive of a wider population and more generalizable than could be determined in previous work.
Limitations include that analyses are cross-sectional and that causal conclusions cannot be made. Another limitation is that assessment of recent episodes of level 3 hypoglycemia and DKA was based on self-report, and we were unable to provide confirmation based on medical records. However, given that level 3 hypoglycemia and DKA are memorable events and often involve health care utilization (emergency department or hospital stay), there is likely a reasonably high level of accuracy to the self-reports (eg, Jiang et al 26 ). Another limitation was that self-reported level 3 hypoglycemia and DKA were assessed over the previous six months, rather than prospectively. Thus, ROC cutoffs for DKA and level 3 hypoglycemia prediction from the GRI should be interpreted with caution, and these cutoffs should be verified in a prospective study. A strength includes that the study was conducted among a racially/ethnically and socioeconomically diverse population, strengthening its generalizability.
This study supports the use of the GRI and provides a clinical picture of GRI zones in a diverse sample of adults with T1D. We also provide evidence that GRI zones D and E are associated with increased risk of negative health events and individuals whose scores fall in zones D and E would particularly benefit from additional clinical attention. The GRI may be a good metric alongside A1c to include as a main outcome in clinical care and research; strengths include the ability to capture hypoglycemia and reliably assess glycemic quality over shorter time frames.14,15 Finally, observed demographic differences across GRI zones and the sizable contribution of demographic factors to the GRI score further underscore the need to address health inequities.
Supplemental Material
sj-docx-1-dst-10.1177_19322968231164151 – Supplemental material for Glycemic Risk Index Profiles and Predictors Among Diverse Adults With Type 1 Diabetes
Supplemental material, sj-docx-1-dst-10.1177_19322968231164151 for Glycemic Risk Index Profiles and Predictors Among Diverse Adults With Type 1 Diabetes by Claire J. Hoogendoorn, Raymond Hernandez, Stefan Schneider, Mark Harmel, Loree T. Pham, Gladys Crespo-Ramos, Shivani Agarwal, Jill Crandall, Anne L. Peters, Donna Spruijt-Metz, Jeffrey S. Gonzalez and Elizabeth A. Pyatak in Journal of Diabetes Science and Technology
Footnotes
Abbreviations
AGP, ambulatory glucose profile; AUC, area under the curve; CGM, continuous glucose monitoring; CV, coefficient of variation; DKA, diabetic ketoacidosis; DSMQ, Diabetes Self-Management Questionnaire; GRI, Glycemia Risk Index; ROC, receiver operating characteristic; SES, socioeconomic status; T1D, type 1 diabetes; TIR, time in range.
Declaration of Conflicting Interests
The author(s) declared no potential conflicts of interest with respect to the research, authorship, and/or publication of this article.
Funding
The author(s) disclosed receipt of the following financial support for the research, authorship, and/or publication of this article: This study was supported by grant R01 DK121298 from the National Institutes of Health and a grant from Abbott Laboratories (A.L.P. received donated devices from Abbott Diabetes Care). This study was also partially supported by the Einstein-Mount Sinai Diabetes Research Center (P30 DK020541) and the New York Regional Center for Diabetes Translation Research (P30 DK111022).
Supplemental Material
Supplemental material for this article is available online.
References
Supplementary Material
Please find the following supplemental material available below.
For Open Access articles published under a Creative Commons License, all supplemental material carries the same license as the article it is associated with.
For non-Open Access articles published, all supplemental material carries a non-exclusive license, and permission requests for re-use of supplemental material or any part of supplemental material shall be sent directly to the copyright owner as specified in the copyright notice associated with the article.