
Abstract
Background:
In analytical performance studies, the choice of comparator method plays an important role, as studies have shown that there exist relevant systematic differences (bias) between laboratory analyzers. The feasibility of retrospective recalibration of measurement results through comparison with methods or materials of higher metrological order to minimize bias was therefore assessed.
Method:
Existing data from performance studies of continuous and blood glucose monitoring systems were retrospectively analyzed. Comparison with a higher-order method was performed for two different data sets. In both cases, subject samples were measured, and a subset was also measured on a higher-order method. Recalibration based on higher-order materials (standard reference material [SRM]) was conducted for two different data sets containing results from SRM and subject samples. Linear regression analysis was performed for each device separately. Resulting equations were applied to the respective complete data set of subject samples. Bias between devices in a data set across all subject samples was assessed before and after recalibration.
Results:
Bias between devices was reduced from −3.6% to +0.6% in one data set and from +11.0% to +0.3% in the other by recalibration based on higher-order method. Using higher-order materials, bias was also reduced by recalibration, but mixed results were found: Bias was reduced from −3.1% to −0.1% in one data set and from −4.3% to −2.7% in the other.
Conclusions:
Recalibration did lead to a decrease in bias and thus can reduce the impact of the choice of comparator method. The procedure should be verified in a prospectively designed setting.
Keywords
Introduction
Continuous glucose monitoring (CGM) has seen increasing use especially among people with type 1 diabetes. Among the different CGM systems are some whose values can be used to guide therapeutic decisions like insulin dosing without confirmatory blood glucose (BG) measurements, and some of which can be connected to interoperable systems for automated insulin delivery.
Among other requirements, CGM systems have to show that they can reliably measure glucose concentrations to gain regulatory approval. Clinical trials are conducted, often in an in-clinic setting, to assess the performance of CGM systems. Many of these clinical trials utilized laboratory analyzers as comparator method, as they are typically viewed to exhibit higher analytical quality than point-of-care (POC) or over-the-counter (OTC) BG monitoring systems (BGMS). In a 2019 meeting, a representative of the US Food and Drug Administration explicitly stated that a good comparator method has to be a laboratory-based method. 1 However, studies have shown that there exist relevant systematic differences between laboratory analyzers.2,3 Therefore the choice of laboratory method could affect the outcome of a CGM performance study.
To avoid this, the bias of the comparator method should be sufficiently small with respect to materials and methods of higher metrological order. To that end, analytical performance specifications (APS) should be defined and any potential comparator method’s performance should be verified. This article aims at providing a rationale for analytical performance specifications for comparator methods in CGM performance studies. Furthermore, it presents a retrospective recalibration approach to reduce bias with the ultimate goal of improving a comparator method’s performance, eg, to meet APS. In addition, the possibility of using a BGMS as a comparator method in CGM performance studies is explored.
Methods
Analytical Performance Specifications
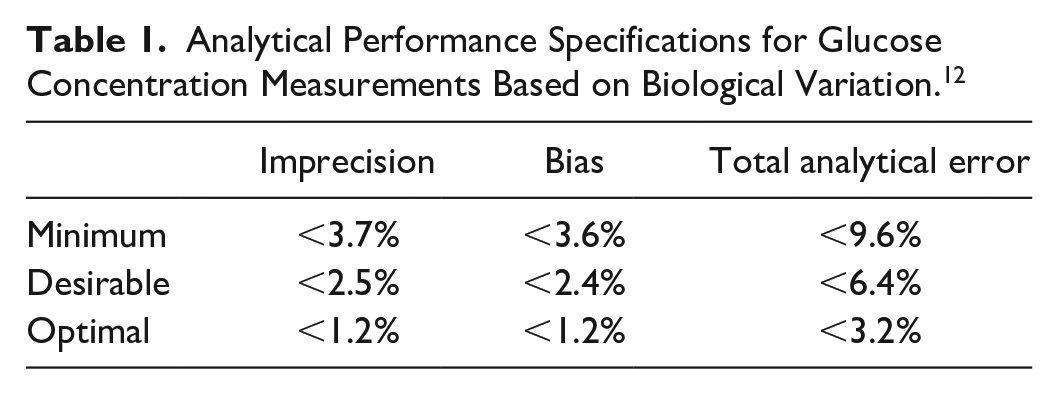
In 2011, Sacks and colleagues proposed that glucose measurements should be performed in an accredited laboratory when used for diagnosis or screening of diabetes. 4 Furthermore, these measurements should have an analytical imprecision ≤2.9%, a bias ≤2.2%, and a total analytical error ≤6.9%. 4 Sacks and colleagues also emphasized that the goal should be to minimize total analytical error and that measurements should be without bias, to avoid misclassification of diabetes patients. 4 The same numerical goals for imprecision, bias, and total analytical error are also recommended for comparator methods by the Clinical and Laboratory Standards Institute (CLSI) in performance demonstrations of BGMS for POC testing. 5
Sacks and colleagues based their goals on biological variation (BV) of glucose. 4 BV of an analyte encompasses the within-subject BV, defined as the fluctuation of a measurand around a homeostatic set point within a “healthy” individual in a steady-state condition, and between-subject BV, defined as the fluctuation of these individual homeostatic set points between different healthy individuals. 6
Minimization of Bias Through Recalibration
Performance studies, in principle, allow for retrospective minimization of bias, as opposed to clinical practice, where measurement results have to be available on a shorter time scale. To minimize bias, the relationship between results from the comparator method and those of a higher-order method is quantified by a regression analysis. The regression equation is subsequently applied to all measurement results of the comparator method.
One approach, recalibration based on a method of higher metrological order, draws aliquots from a small portion of subject samples that are measured on both the designated comparator method and the higher-order method. Recalibration of all sample results in the study is then based on pairs of values from the designated comparator method and the higher-order method. This approach has the benefit of using the same sample matrix as the measurements whose values are recalibrated. However, there is a risk of pre-analytical errors, eg, if the sample preparation for the higher-order method is complex or if samples have to be transported/stored for a long time. This approach also requires access to a higher-order method. Measurements with mass spectrometry-based methods are typically considerably more expensive than measurements with laboratory analyzers.
Another approach, recalibration based on materials of higher metrological order, uses certified reference materials that are measured on the designated comparator method on the same day as the subject samples from the study. An example for certified reference material is Standard Reference Material (SRM) 965b (National Institute of Standards and Technology [NIST]; Gaithersburg, MD). 7 Measurement results are then recalibrated based on pairs of values from the comparator method and the certified target value of the respective reference material sample. The certified target values are often assigned using mass spectrometry, as is the case with NIST SRM 965, or another higher-order method. Still, care should be taken to verify that the method used to assign target values was of sufficiently high metrological order and that the uncertainty of the certified target value is sufficiently low. This approach requires adequate storage facilities, like deep freezers, for the reference materials. The reference materials should ideally be available for a sufficiently large range of glucose concentrations. A limitation of this approach is the sample matrix, because the higher-order material samples might not be commutable for all instruments. Especially with POC or OTC BGMS, aqueous, serum, or plasma samples may not work, and whole-blood samples may have added preservatives for stabilization of glucose concentrations that might interfere with the measurement. 8 An advantage is that reference materials, like NIST SRM, may be easier to access than higher-order methods, like a mass spectrometry.
Recalibration itself is then based on linear regression analysis of the pairs of values from the designated comparator method (ylr, i) and the higher-order method or the certified target values of higher-order materials (xlr, i). This results in the linear equation
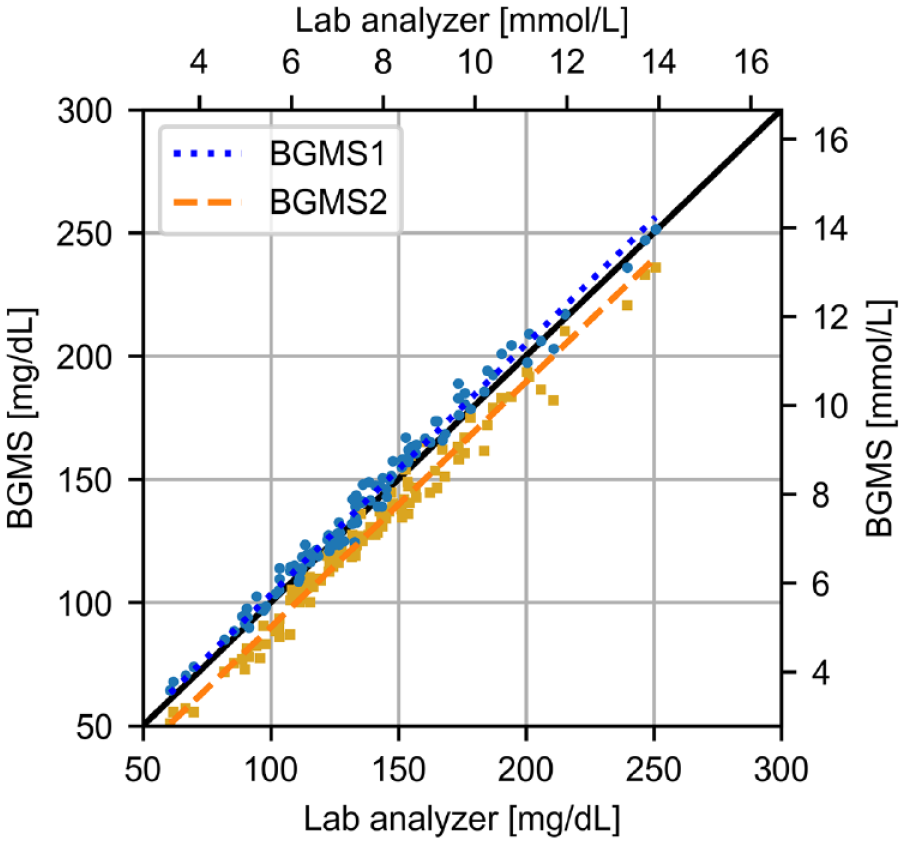
Linear regression based on the Passing-Bablok approach between laboratory analyzer and two blood glucose monitoring systems (BGMS). The resulting regression equations are BGMS1: y1 = 1.02 × x + 1.59 mg/dL (y1 = 1.02 × x + 0.09 mmol/L) and BGMS2: y2 = 1.00 × x − 9.63 mg/dL (y2 = 1.00 × x − 0.53 mmol/L).
There are many different approaches to linear regression analysis, and the selection should be based on statistical considerations regarding the specific situation in which recalibration is applied. For example, the Scandinavian Evaluation of Laboratory Equipment for Point-of-Care Testing (SKUP) reportedly uses inverse regression based on a least-squares method in their BGMS evaluations. 7 In this article, linear regression according to Passing and Bablok is used. 9 As opposed to inverse regression, Passing-Bablok regression does not require normally distributed error terms or specifically distributed samples, and it does not view one specific set of values as free from error. However, other requirements apply, for example, variances of the two methods should remain proportional across the measuring range and the range of values (highest values divided by lowest value) should be sufficiently large. 10
Data Analysis
Data analysis was performed with two distinct goals: assessment of feasibility of recalibration and assessment of its robustness. A schematic depiction of the data analysis procedure and the used data sets is provided in Figure 2. All data sets were obtained in BGMS and CGM performance studies, ie, the studies were not designed for the verification of recalibration.
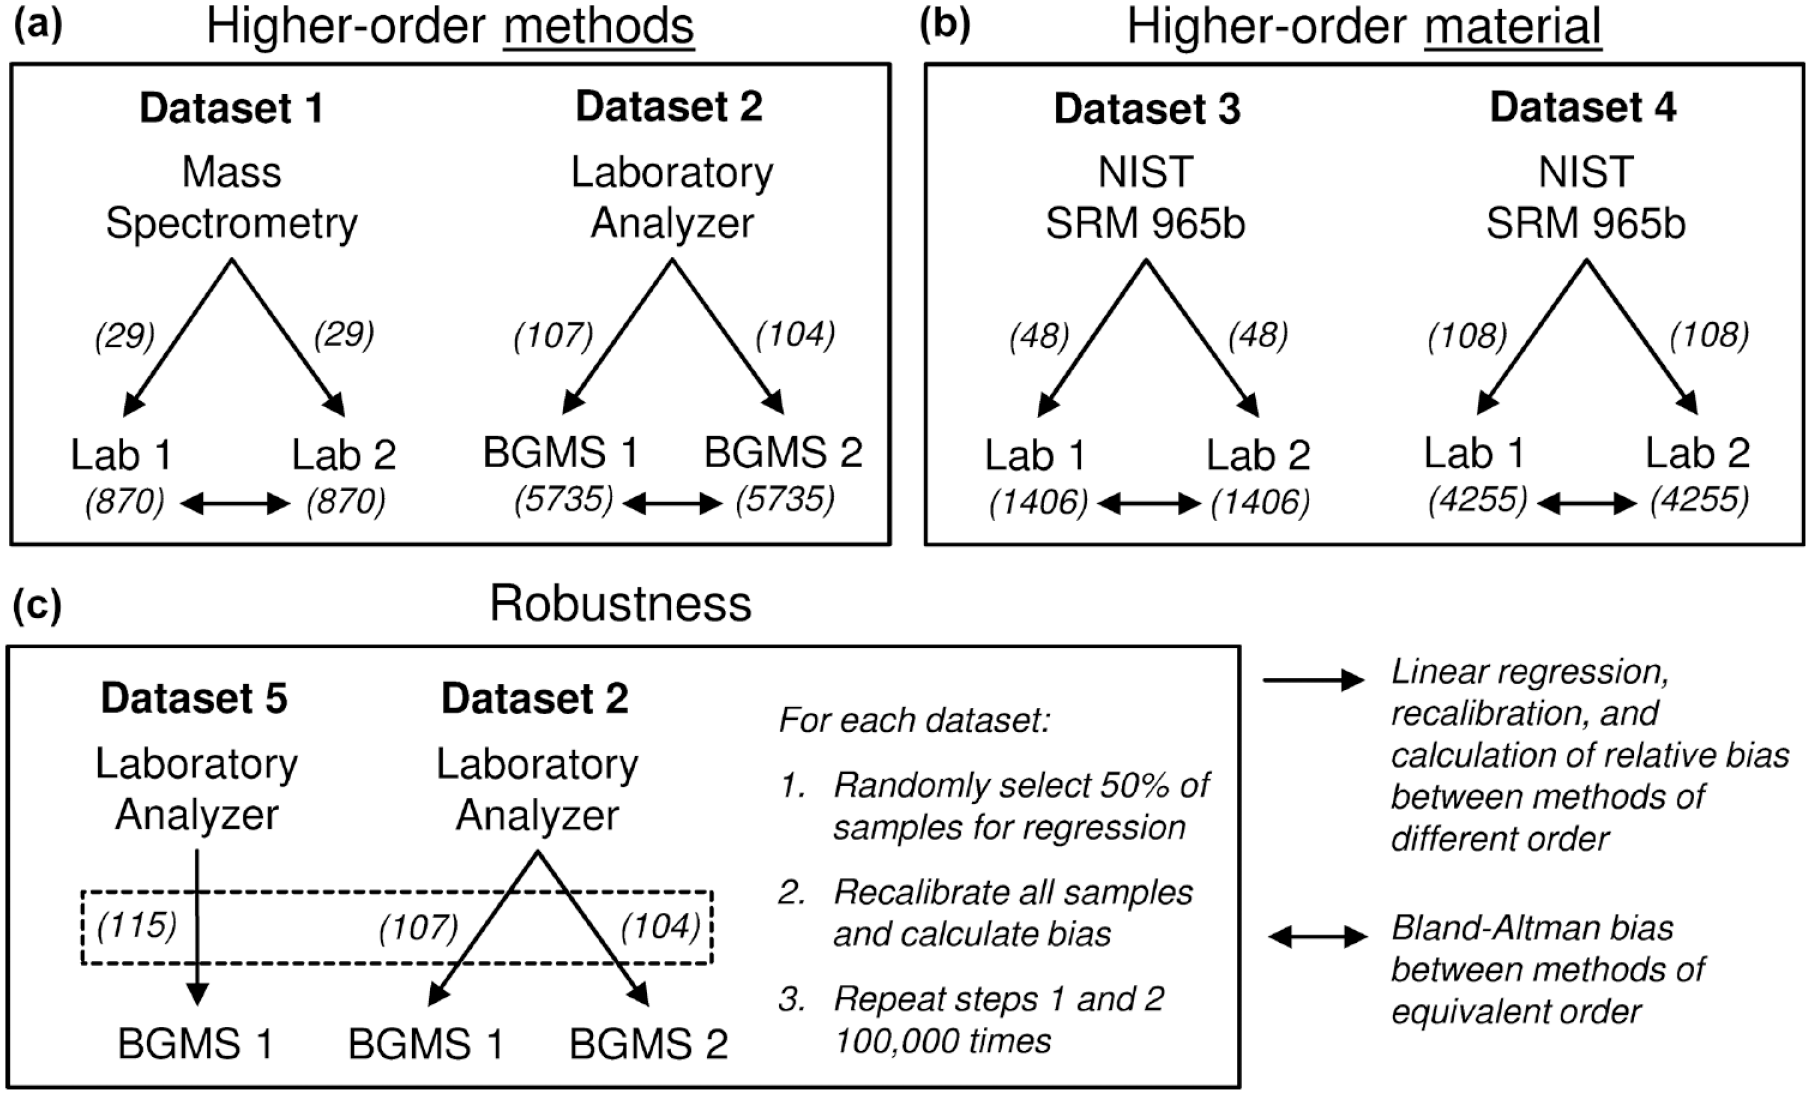
Schematic description of the data analysis procedures and data sets used to assess the feasibility of the proposed recalibration approach. In particular, the approach was assessed using higher-order methods (a) and materials (b) using NIST standard reference material (SRM), as well as in terms of robustness (c). Both measurements from laboratory analyzers (Lab) and blood glucose monitoring systems (BGMS) were considered for recalibration. The values in brackets give the number of available samples. Abbreviation: NIST, National Institute of Standards and Technology.
Feasibility of recalibration based on higher-order methods (Figure 2A) was assessed 2-fold. In data set 1, 870 subject samples were measured with two laboratory analyzers, and in addition, a subset of 29 subject samples was also measured on an isotope dilution-gas chromatography-mass spectrometry method. Two linear regression equations, one for each laboratory analyzer, were derived from this subset. These equations were used to recalibrate the results of all 870 subject samples obtained with the respective laboratory analyzer. Bias between each laboratory analyzer and mass spectrometry was calculated before and after recalibration as mean relative difference to account for the substantially lower imprecision of the mass spectrometry method. Relative bias between the two laboratory analyzers was calculated before and after recalibration according to Bland and Altman. 11 In data set 2, two different BGMS were used to measure the same 5735 subject samples, and a subset of 107 (BGMS1) and 104 (BGMS2) subject samples was also measured on a laboratory analyzer. Again, linear regression analysis was performed, analogous to what was done for data set 1: For each BGMS separately, a linear regression equation was derived from the subset of 107 (BGMS1) and 104 (BGMS2) subject samples (see Figure 1). The respective BGMS’s equation was used to recalibrate the results of all 5735 subject samples obtained from the BGMS. Bias between each BGMS and the laboratory analyzer was again calculated before and after recalibration as mean relative difference, and bias between the two BGMS was calculated before and after recalibration according to Bland and Altman. 11
Feasibility of recalibration based on higher-order materials (Figure 2B) was assessed based on two other data sets, data set 3, and data set 4. Subject samples (n = 1406 for data set 3, n = 4255 for data set 4) were measured on two laboratory analyzers. On the morning of each day on which subject samples were measured in these studies, NIST SRM 965b was used on the two laboratory analyzers for quality control (QC), leading to 48 results in data set 3 and 108 results in data set 4. NIST SRM 965b was available in four different glucose concentrations: 33.08 mg/dL, 75.56 mg/dL, 118.5 mg/dL, and 294.5 mg/dL (1.836 mmol/L, 4.194 mmol/L, 6.575 mmol/L, and 16.35 mmol/L). For data sets 3 and 4, the linear regression equations were derived for each analyzer separately from the QC measurements. These equations were then applied to all 1406 and 4255 results in data set 3 and data set 4, respectively, that were obtained from the respective analyzer. Again, bias was calculated as either mean relative difference, for comparisons of laboratory analyzer results to SRM target values, or according to Bland and Altman, for comparisons between the two laboratory analyzers. 11
Robustness of recalibration (Figure 2C) was analyzed by performing Monte Carlo simulations on data set 2 containing results of two BGMS used on the same samples and paired with a laboratory analyzer (see above). This data set was selected to address robustness of recalibration of two different devices using the same higher-order method. In addition, another data set (data set 5) containing the same type of data from one of the BGMS models used in data set 2 was used. It was selected because the BGMS in that data set had comparably low bias toward the laboratory analyzer before recalibration (+1.3%). These are primarily illustrative data sets, making no general claim about the potential usefulness of data sets for recalibration. From each BGMS in each data set, half of the samples were randomly drawn. This half of samples was used to establish a linear regression equation for that BGMS which was then applied to recalibrate all samples of the BGMS in the data set. After recalibration, bias between BGMS results and the laboratory analyzer results was calculated again. Random sampling was performed 100 000 times for each data set, and the resulting 100 000 values for bias after recalibration were plotted in box-whisker plots.
Results
Updated Analytical Performance Specifications
A comparator method should provide evidence that it is fit for purpose. As mentioned above, Sacks and colleagues based their goals on biological variation (BV) of glucose. 4 A BV database was hosted by Westgard QC at that time, but has since been moved and is now hosted by the European Federation of Clinical Chemistry and Laboratory Medicine (EFLM). 12 Using the current (as of submission of this article) values for within-subject BV of glucose (median coefficient of variation [CV] estimate 4.9%) and between-subject BV of glucose (median CV estimate 8.1%), minimum, desirable, and optimal APS can be calculated using formulae provided by the BV database. The results are shown in Table 1. 12 Although optimal APS are ideally met, compliance with desirable APS might suffice, as they are similar to the goals defined by Sacks and colleagues. 4
Analytical Performance Specifications for Glucose Concentration Measurements Based on Biological Variation. 12
Local or national quality assurance guidelines may allow even larger imprecision and bias than the values shown in Table 1. As such, laboratory analyzers that are used in routine healthcare settings might not be sufficiently accurate for CGM or BGMS performance studies. Considering that performance studies represent a niche use for laboratory analyzers, operators may face the dilemma of having to use whatever quality of devices and materials is available on the market.
Recalibration Based on Higher-Order Method
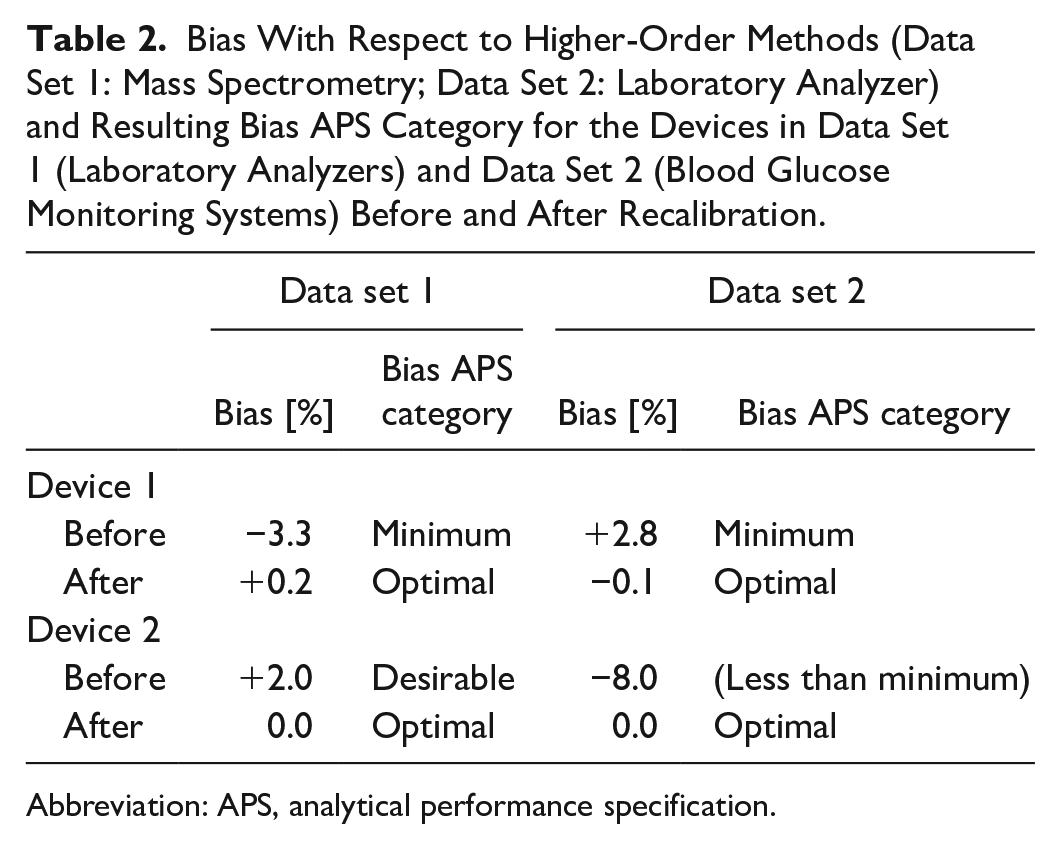
As outlined above, recalibration based on higher-order methods was performed for two laboratory analyzers based on mass spectrometry (data set 1) as well as for two BGMS based on a laboratory analyzer method (data set 2). Values for bias before and after recalibration with respect to the higher-order methods as well as their respective APS category are shown in Table 2.
Bias With Respect to Higher-Order Methods (Data Set 1: Mass Spectrometry; Data Set 2: Laboratory Analyzer) and Resulting Bias APS Category for the Devices in Data Set 1 (Laboratory Analyzers) and Data Set 2 (Blood Glucose Monitoring Systems) Before and After Recalibration.
Abbreviation: APS, analytical performance specification.
The Bland-Altman bias between the two devices (laboratory analyzer and BGMS) before and after recalibration is shown in Figure 3. Here it is demonstrated that there was some bias in the original data sets of subject samples between the two analyzers (−3.6%) and the two BGMS (+11.0%), respectively. Recalibration yielded a markedly lower bias close to zero of +0.6% and +0.3%, respectively.
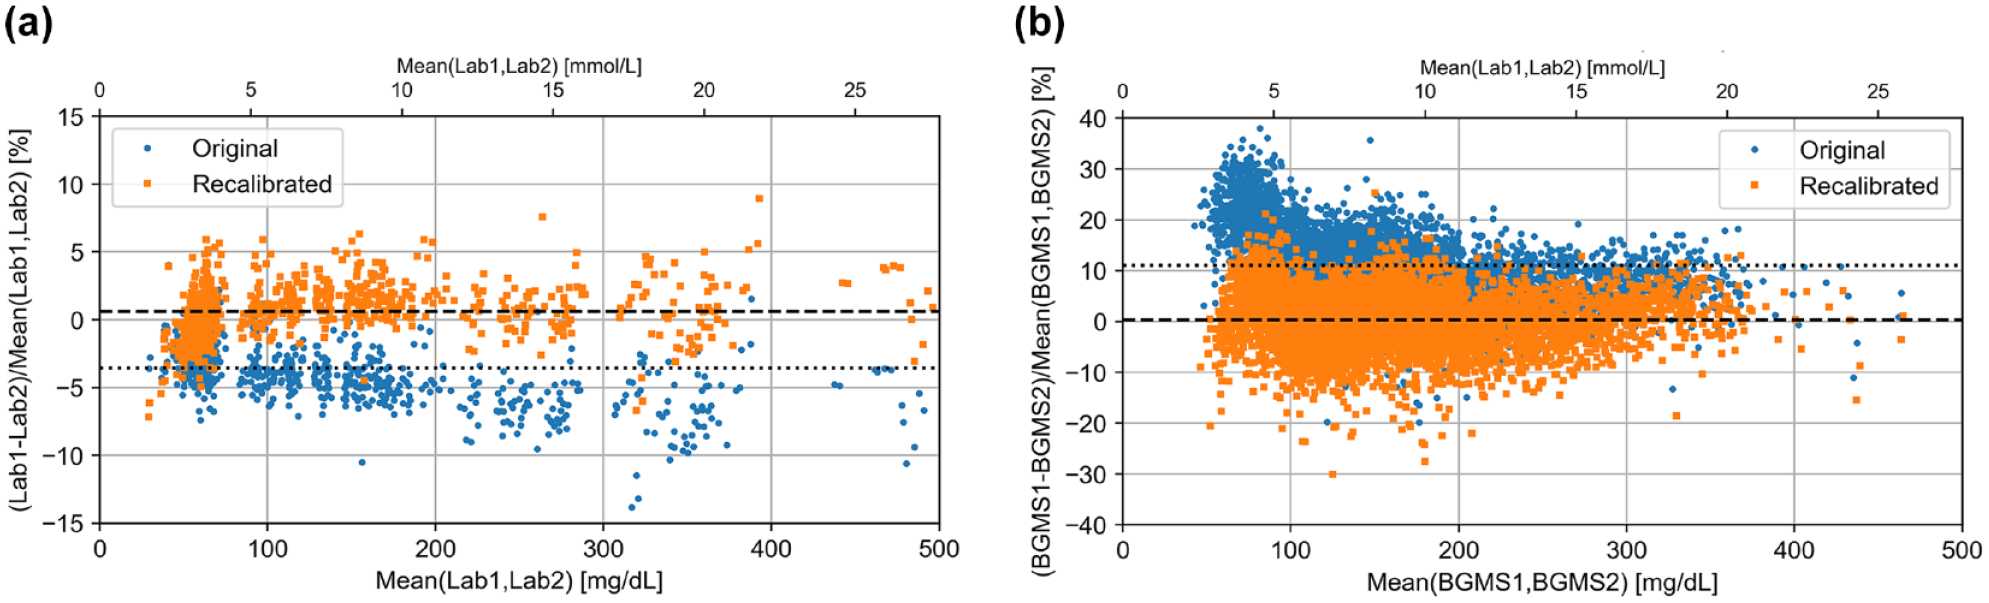
Bland-Altman bias plot for recalibration based on higher-order method (a: data set 1, mass spectrometry (n=870), b: data set 2, laboratory analyzer (n=5735)). Original pairs of measurement results in subject samples are shown as blue circles, pairs after recalibration are shown as orange squares. Dotted lines indicate bias before recalibration (a: −3.6%, b: +11.0%). Dashed lines indicate bias after recalibration (a: +0.6%, b: +0.3%). Abbreviations: BGMS: blood glucose monitoring system; Lab, laboratory analyzer.
Recalibration Based on Higher-Order Materials
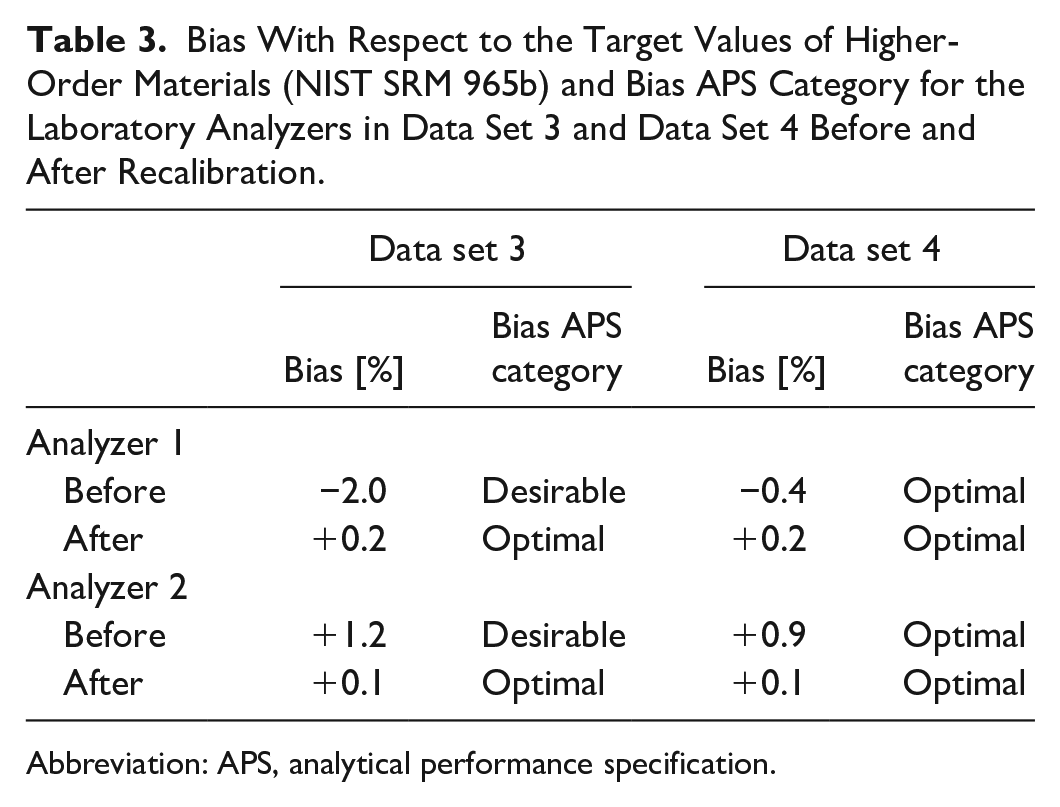
NIST SRM 965b samples were measured on 12 and on 27 days in data sets 3 and 4, respectively. Table 3 shows the bias of the laboratory analyzer results with respect to the SRM target values and their respective APS category before and after recalibration.
Bias With Respect to the Target Values of Higher-Order Materials (NIST SRM 965b) and Bias APS Category for the Laboratory Analyzers in Data Set 3 and Data Set 4 Before and After Recalibration.
Abbreviation: APS, analytical performance specification.
The Bland-Altman bias between the two laboratory analyzers before and after recalibration is shown in Figure 4. Here, the bias in the subject sample data sets 3 and 4 between analyzers was −3.1% and −4.3% before calibration, respectively, and −0.1% and −2.7% after recalibration.
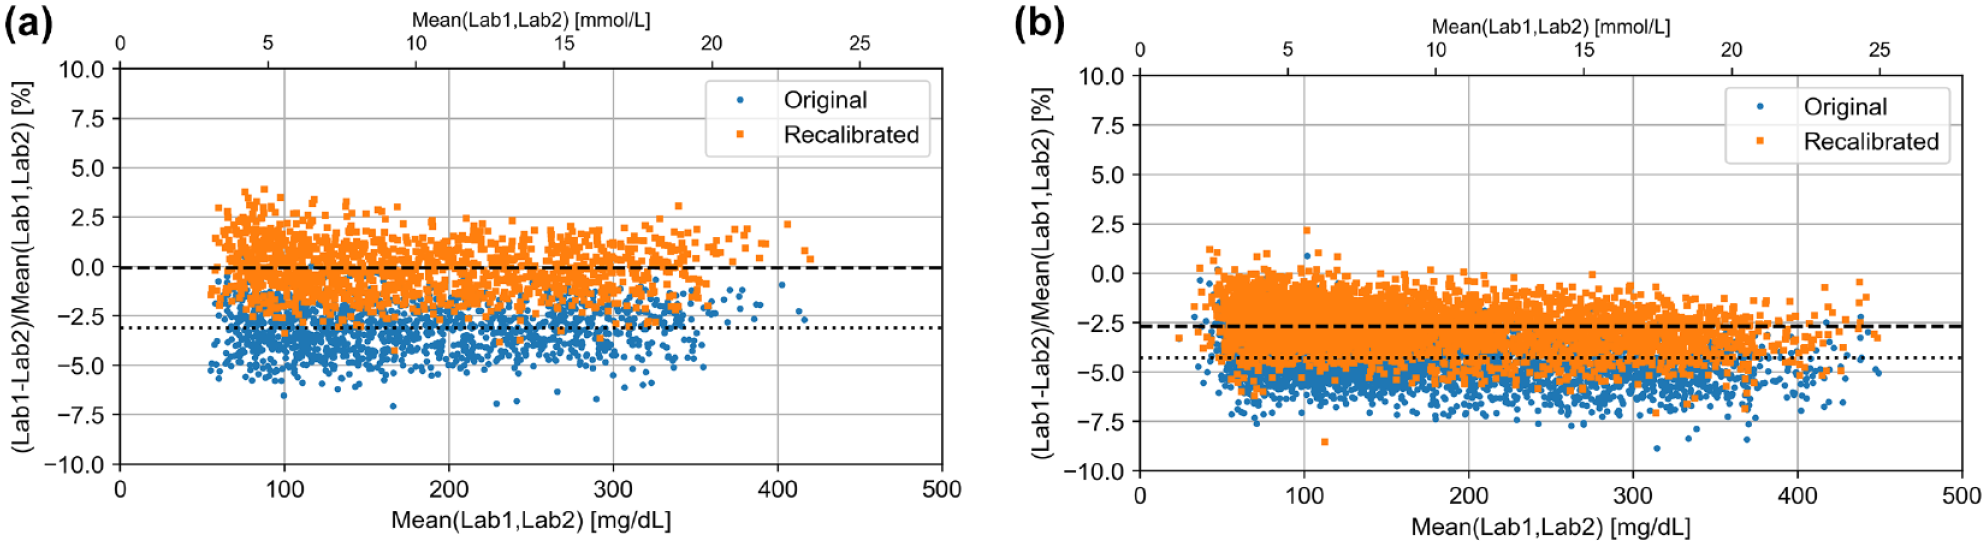
Bland-Altman bias plot for recalibration based on higher-order material (NIST SRM 965b) (a: data set 3 (n=1406), b: data set 4 (n=4255)). Original pairs of measurement results in subject samples are shown as blue circles, pairs after recalibration are show as orange squares. Dotted lines indicate bias before recalibration (a: −3.1%, b: −4.3%). Dashed lines indicate bias after recalibration (a: −0.1%, b: −2.7%). Abbreviations: NIST, National Institute of Standards and Technology; SRM, standard reference material; Lab, laboratory analyzer.
Robustness of Recalibration
Robustness was assessed based on recalibration of BGMS results. Recalibration was performed and assessed with respect to a laboratory analyzer (ie, higher-order method). The training data comprised 58, 54, and 52 pairs of subject sample results, ie, half of the number of recalibration samples, rounded up (see Figure 2C). As demonstrated by the variability in bias toward the laboratory analyzer after recalibration in Figure 5, the specific random sample drawn to establish the recalibration equation impacted the success of the recalibration. BGMS1 in data set 5 is the same model as BGMS1 in data set 2. In data set 5, the bias of BGMS1 was +1.3% before recalibration. In less than 50 out of 100 000 simulations (<0.05%), bias was further away from zero after recalibration. In data set 2, bias after recalibration was always closer to zero than before recalibration for both BGMS.
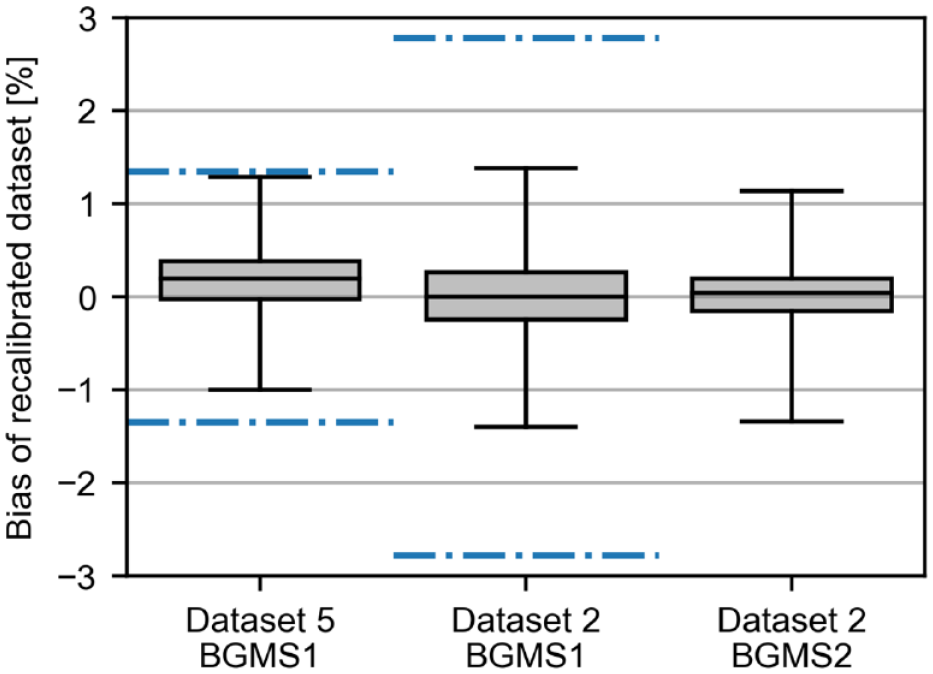
Box-whisker plots of bias between BGMS and laboratory analyzer for 100 000 simulations of recalibration based on a 50% subset of data for two illustrative data sets. Whiskers indicate the range within which 99.9% of individual bias results were found. Bias toward the higher-order method was +1.3%, +2.8%, and −8.0%, respectively, before recalibration. Blue dash-dotted lines indicate ± 1 × bias. The original bias for data set 2 BGMS2 is outside of y-axis scaling due to scaling for better visibility of bias after recalibration. Abbreviation: BGMS, blood glucose monitoring system.
Discussion
General feasibility of recalibration both based on higher-order methods and based on higher-order material could be shown through the reduction of bias toward the higher-order methods/materials. Furthermore, bias between different analyzers/BGMS was also reduced in the assessed data sets. When addressing robustness of recalibration, variability of linear regression equations showed that in the vast majority of cases, bias after recalibration was lower than the bias before recalibration regardless of which subset of data used to establish the equation. Only when bias before recalibration was small (1.3%), there was a slight chance (<0.05%) of recalibration yielding a bias farther away from zero. It is, therefore, sensible to verify the effect of recalibration in case of small bias in the original data set.
Recalibration could be beneficial in large studies, eg, CGM performance studies to gain regulatory approval. Such studies are often conducted at multiple study sites or on multiple analyzers at the same site simultaneously. Even if each individual analyzer fulfills optimal APS of <1.2% bias toward a higher-order method, any two analyzers might still exhibit up to 2.4% bias between each other. Since such studies typically view comparator measurements as “true” values, any bias would be treated as if it were the investigated system’s measurement error. With manually calibrated CGM systems, the calibration can be performed with the same analyzer that is used as comparator method to minimize the average deviation; this is not possible with factory-calibrated systems. The proposed recalibration procedures could be implemented to minimize systematic differences between sites and/or analyzers, so that ultimately, the performance would be assessed more consistently.
However, recalibration may not work in all situations. Data set 4 showed that although bias toward the higher-order material was reduced by recalibration, the bias between laboratory analyzers remained above the APS optimal criterion. It remains unclear why this was the case. One possible explanation might be that the original bias between the laboratory analyzers in data set 4 was much more pronounced for subject samples than for the SRM (−4.3% vs −1.3%). The recalibration might thus not have had sufficiently large effect, as opposed to data set 3 where the bias between analyzers for subject samples was similar to the bias for the SRM (approx. −3% each). A caveat is that existing data from a CGM performance study were used, meaning that the study was not designed to validate the recalibration procedure. Measurements with NIST SRM 965b were used as part of daily internal QC, and the documentation of procedures was not designed to record all potential influences. For example, detailed procedures for the start-up of analyzers or the thawing of NIST SRM 965b samples could impact how representative the analyzers’ performance during daily QC was for the rest of the day. Official QC targets in Germany state that individual measurement results have to be found within ±11% of the target value, 13 and the study center’s own, more stringent target goals, ±3 mg/dL (0.17 mmol/L) or ±5% for Lab1, whichever is greater; and ±5% for Lab2, were met, so no further action was required at the time. In addition, there might have been commutability issues due to sample matrix, although the laboratory analyzers were intended to be used with serum samples, among others. A verification study with more detailed documentation and/or more standardized procedures may yield further insights.
Considering APS based on biological variation, a bias goal of <1.2% (current “optimal” APS) for a comparator method in a CGM performance study seems feasible after recalibration. This recalibration procedure is aimed to be applied retrospectively to account for any influences that occurred while data were gathered. Although the procedure could be used prospectively, there are a number of influences that would not be accounted for and that could impact the quality of recalibration. Greater benefit can be expected, for example, in performance assessment studies for BGMS or CGM systems, as well as for calibration of POC and OTC BGMS and (factory-calibrated) CGM systems during manufacturing. This would likely lead to minimization of bias between systems from different manufacturers. 14
Feasibility of recalibration was shown for both laboratory analyzers and BGMS. Although recalibration of BGMS was only assessed based on higher-order method, the approach using higher-order materials could likely also work, as long as commutability is ensured for the specific BGMS.
As described earlier, there is a preference for laboratory analyzers as comparator methods in CGM performance studies. 1 As these studies often incorporate phases of high-frequency BG measurements, 15 the use of laboratory analyzers demands the measurement of BG in venous (whole blood or plasma) samples, because high frequency sampling of capillary blood in sufficient quantities is not feasible. However, the argument can be made that CGM systems should provide values similar to capillary BG concentrations. For example, people with diabetes who switch from BGMS to CGM systems typically retain their therapy rules, like correction factors or target values/ranges. In this situation, the rules are based on capillary values. The choice of comparator sample material is particularly important, as physiologic differences exist between glucose concentrations in venous blood, capillary blood, and interstitial fluid. Direct measurement in the interstitial fluid is currently not feasible, because sufficiently large sample volumes cannot reliably be obtained in sufficiently short time. Therefore, the comparator method in CGM performance studies should also use capillary samples. 16 Using a laboratory analyzer with venous samples introduces variable errors in a CGM performance study,17-19 as well as a higher potential for pre-analytical errors in comparison to a BGMS. If recalibration based on higher-order method is applied in a study, the blood sampling has to be timed appropriately, especially at times of rapid glucose changes. In addition, both the lower- and the higher-order methods should use the same sample type; otherwise, the physiologic differences do have an impact. When selecting a comparator method for CGM performance studies, these differences have to be kept in mind. A high-quality BGMS measuring capillary samples combined with the proposed recalibration procedure might ultimately yield results of equivalent or even superior quality than a laboratory analyzer measuring venous samples, if the CGM system whose performance is assessed is intended to display capillary-like values.
Conclusions
For laboratory analyzers, feasibility of recalibration based on higher-order methods or higher-order materials could be shown. Recalibration based on higher-order methods also seems feasible for BGMS. These procedures can be used, for example, to improve the quality of comparator measurements in CGM or BGMS performance studies as well as for factory calibration of CGM systems and BGMS.
The proposed procedure could also allow the use of high-quality BGMS as comparator method in CGM performance studies, which would eliminate a number of potential issues associated with the standard approach of using venous BG concentrations as comparator.
Footnotes
Acknowledgements
The authors express their gratitude to the members of the International Federation of Clinical Chemistry and Laboratory Medicine’s working group on continuous glucose monitoring for their discussion of and feedback to the content of this article. The authors also thank the Diabetes Center Berne for financially supporting this work.
Abbreviations
APS, analytical performance specifications; BG, blood glucose; BGMS, blood glucose monitoring system; BV, biological variation; CGM, continuous glucose monitoring; CLSI, Clinical and Laboratory Standards Institute; CV, coefficient of variation; EFLM, European Federation of Clinical Chemistry and Laboratory Medicine; Lab, laboratory analyzer; NIST, National Institute of Standards and Technology; OTC, over the counter; POC, point of care; QC, quality control; SKUP, Scandinavian Evaluation of Laboratory Equipment for Point-of-Care Testing; SRM, standard reference material.
Declaration of Conflicting Interests
The author(s) declared the following potential conflicts of interest with respect to the research, authorship, and/or publication of this article: G.F. is general manager and medical director of the IfDT (Institut für Diabetes-Technologie Forschungs- und Entwicklungsgesellschaft mbH an der Universität Ulm, Ulm, Germany), which carries out clinical studies on the evaluation of BG meters, with CGM systems and medical devices for diabetes therapy on its own initiative and on behalf of various companies. G.F./IfDT have received speakers’ honoraria or consulting fees from Abbott, Ascensia, Berlin Chemie, Beurer, BOYDsense, CRF Health, Dexcom, i-SENS, Lilly, Metronom, MySugr, Novo Nordisk, Pharmasens, Roche, Sanofi, Sensile, Terumo, and Ypsomed. S.P., M.E., and C.H. are employees of the IfDT. T.G. is an employee of Diabetes Center Berne, Switzerland. E.E.B. is an employee of Equalis AB, Sweden, and also working in the Scandinavian Evaluation of Laboratory Equipment for Point-of-Care Testing (SKUP) group. K.M. is an employee of KAT General Hospital, Kifissia, Athens, Greece.
Funding
The author(s) disclosed receipt of the following financial support for the research, authorship, and/or publication of this article: This study was financially supported by Diabetes Center Berne, Switzerland.