
Abstract
Background:
A wide suite of methods are available to evaluate delivery accuracy of insulin pumps. However, these methods do not capture any temporal information, which may be critical for design of artificial pancreas (AP) systems. We propose a novel video microscopy method to understand the delivery accuracy and temporal nature for a new durable pump under development (IFP), and a commercially available pump (Medtronic 722G, M722G).
Methods:
The cannula tip of an infusion set is inserted into a graduated pipette placed under a digital microscope. A video of the delivery is captured to track the fluid meniscus, to measure volumetric delivery rate and accuracy. This was done for a programmed value of 0.5 and 1 U. A similar procedure was adopted to track linear motion of the piston rod, which actuates the reservoir plunger, for a programmed value of 10 U.
Results:
It was observed that the commercially available pump delivers insulin in pulses of 0.05 U every two seconds. The mean absolute volumetric delivery error (MAE) for both pumps was found to be within the values reported previously. More importantly, it was found that a significant fraction of the programmed value is delivered, after completion of the planned bolus duration (IFP: 14.31% vs M722G: 9.38% for 1 U delivery).
Conclusions:
The methods presented in this article help understand the delivery dynamics of liquid drug delivery devices. Our results indicate that a significant fraction of insulin delivery happens after the planned bolus duration, which might be important consideration for design of AP systems.
Keywords
Introduction
Closed-loop insulin delivery (artificial pancreas [AP]) is characterized by real-time glucose-responsive insulin administration, combining glucose-sensing and insulin-delivery components. 1 These include commercially available continuous glucose monitors (CGM) and insulin pumps, respectively. Accuracy of CGM devices is impaired by errors arising from incorrect calibration, rapid glucose changes. Most AP systems attempt to model and account for such factors, including delays due to pharmacokinetics of insulin absorption via subcutaneous tissue. On the contrary, models for error in insulin delivery do not factor in temporal variations in delivery volumes/rate.2,3 In AP systems that calculate insulin infusion output rapidly (in the order of a few minutes), 3 this can potentially lead to an incorrect insulin-on-board calculation and significant delivery errors. Besides errors due to nonpersonalized estimation of insulin pharmacokinetics, these delivery errors can also lead to hypoglycaemia, and diminished time in range. Furthermore, the importance of delivery accuracy (particularly at lower values) has been recognized by the Food and Drug Administration (FDA) in a request to Zisser et al. 4 The FDA requested a demonstration of OmniPod’s accuracy at the lowest dosing increment, as an integral part of the AP system's validation. The potential to cause such adverse clinical events in AP systems underscores the need to understand temporal variations in delivery and accuracy of insulin pumps.
Keith et al 5 compared the accuracy and precision of low-dose insulin administration on an insulin pump using an analytical weighing scale. Each dose was delivered in a small plastic container which was monitored for changes in weight. This manual method of measurement can only be used for individual doses.
Zisser et al proposed two methods to determine the accuracy of the OmniPod insulin pump, using a pipette, a digital microscope, and imaging software to measure the mean bolus delivery. The first method used a linear scale beside a pipette to measure the net volume delivered for multiple pulses. The second method measured the volume of a spherical droplet for a bolus of 0.05 U of insulin, equivalent to the delivery resolution of the device. 4 This method provides volumetric delivery information sufficient to resolve dose-to-dose accuracy 6 but does not provide any temporal information.
Kamecke et al 7 proposed an approach to test the bolus and basal rate accuracy from a clinical perspective, using a sensitive weighing scale in accordance with the IEC 60601-2-24:2012 standard. The cannula of the infusion pump is securely connected to a glass capillary which extends into a beaker placed on the balance. The change in weight of the balance is noted over the different observation windows as specified in the standard to plot a trumpet curve. 8 These curves only show the minimal and maximal deviation averaged over the observational window which does not directly represent the temporal performance of a pump. Such methods have been extended for tubeless pumps to capture the planned bolus duration. 9 While this can determine bolus delivery accuracy, limitations of the scale least count and stabilization time make it impossible to visualize the temporal nature of pulsated delivery.
A wide suite of methods is available in the literature to evaluate delivery accuracy of different pump types. They make use of gravimetric or optical techniques to calculate the outcome of delivery. However, these methods do not allow capture of any temporal information. In this work, we explore the usage of video microscopy for the evaluation of delivery accuracy and understand its temporal nature.
Methods
We propose two different methods which are aimed at extracting temporal information about insulin delivery. Method 1 evaluates delivery accuracy at lower bolus doses (0.5 and 1 U) for the prototype of Insuflo, a novel, durable pump under development by the authors (subsequently referred to as IFP) with Medtronic’s MiniMed Paradigm 722G pump 10 (subsequently referred to as M722G). In line with the most commercially available pumps, IFP is also based on the syringe pump principle and delivers insulin via an infusion set (cannula attached to a tube). This method builds upon work done by Zisser et al. 4 Method 2 evaluates the linear motion of the piston for a programmed delivery value, which can help benchmark and evaluate functioning of the device prototypes. The obtained value of linear motion per pulse corresponds to the volumetric delivery resolution of the device.
Method 1: Pipette Test
A standard graduated pipette (BLAUBRAND, class A, total volume: 0.1 mL, resolution: 0.001 mL) is used to determine the delivered volume. The pump is loaded with a reservoir that contains the dyed distilled water in place of insulin. Distilled water serves as a neutral fluid representing various rapid-acting insulin mixtures. Insulin analogues consist of 96% to 98% water and have a density comparable with that of water. 11 The use of purified water also complies with a requirement in the IEC 60601-2-24 international standard that calls for the use of a liquid that provides similar results as the intended liquid for use. 12 However, for the purpose of calculations in this article, 1 mL of fluid is assumed to contain 100 international units (U) of insulin. The cannula is connected to the pipette tip and placed horizontally under the view of a digital microscope (Celestron 44308-DS, capable of 200× magnification). An external DC light source is placed at an angle to the pipette to avoid reflections from the fluid, with the microscope video recorded at maximum magnification. The setup of the test apparatus and the EUT (Equipment Under Test) is shown in Figure 1. Manual priming as recommended by the manufacturer is conducted on the EUT before the cannula is attached to the pipette tip. A fixed prime of 1 U is then done, with additional 0.1 U values programmed until the meniscus travels to the first graduation mark on the pipette. The entire priming process is restarted if air bubbles are visible in the pipette. The programmed value of the bolus for EUT is then set at 0.5 and 1 U, respectively. Video recording is started on the digital microscope, and the programmed bolus is then activated on the EUT. After completion of the programmed delivery, the meniscus takes a few minutes to reach its final location; therefore, the video is captured for more than 5 minutes after the last delivery pulse is observed (see video included as Supplementary Material). The captured video is broken down into individual frames and the meniscus position is tracked by the difference in contrast between the dyed fluid and the background. The pixel position of this moving meniscus is then converted to volumetric information by using the pipette graduations (in the first frame of the video) for calibration. For calibration, this procedure calculates the mean distance (in pixels) between five manually selected graduation marks of 0.1 U (or 0.001 mL) in the frame. The experiment is conducted for 20 runs (for each bolus dose). After each run, the pipette is cleaned with water, flushed with alcohol to remove traces of any remaining fluid, and then dried by heating the pipette vertically in a convection heater (at 60°C for 5 minutes). This removes any residual fluid/impurities, which might affect meniscus movement. The number of pixels defining the meniscus width provides a volumetric resolution of 0.005 U, and the microscope video frame rate provides a temporal resolution of 0.067 (1/15) seconds.
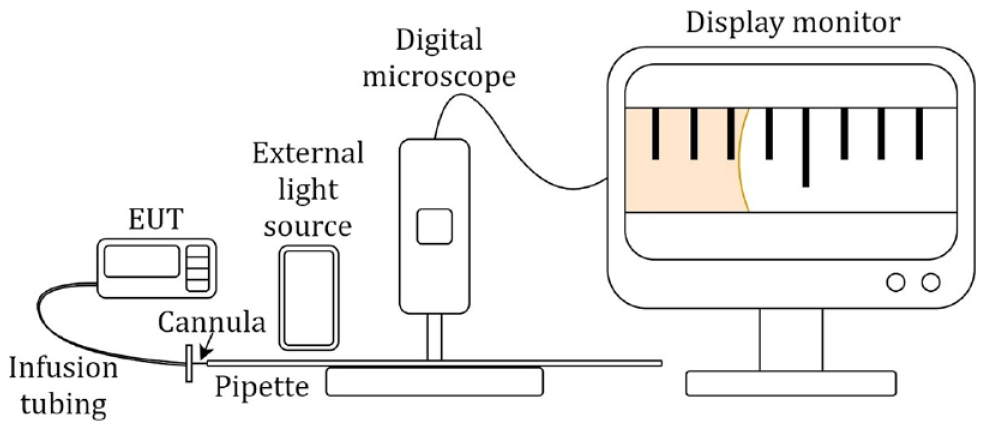
Experimental setup of Method 1: Pipette test. Cannula at the end of the infusion tubing from the reservoir installed in EUT is connected to the tip of the pipette. Abbreviation: EUT, Equipment Under Test.
A MATLAB program developed by the authors for tracking the meniscus first aligns the pipette to the horizontal axis, by rotating video frames along manually selected reference points. A horizontal band (roughly 10% of the meniscus diameter) is extracted from the center of the meniscus, and the contrast in individual frames is enhanced by selecting the blue channel (the dye is orange in color). Images were binarized by choosing a threshold of 30% of full scale to remove any effects of a gradient induced by lighting. The meniscus position is determined by locating the edge in the binary image of the extracted band. The volume delivered is plotted against time using timestamps of the frames in the video (see Figure 2).
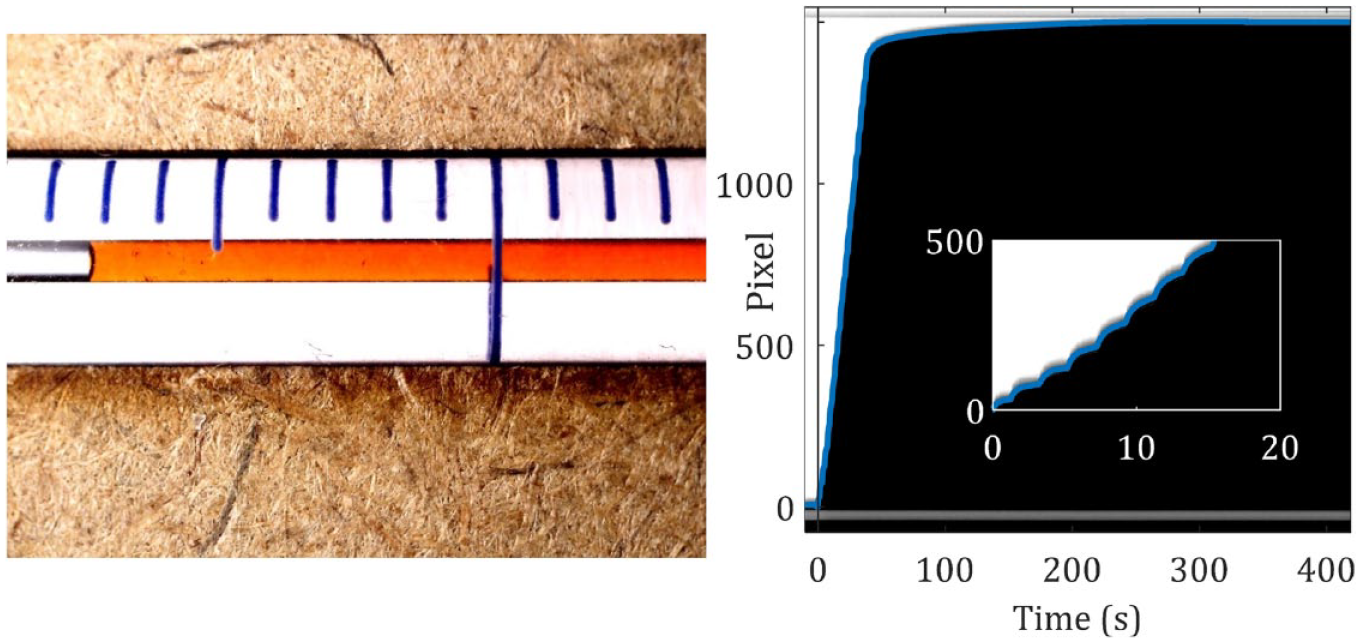
(Left) the image of the pipette with dyed distilled water under the digital microscope. (Right) the extracted band (pixels) from the middle of the meniscus is plotted against the time. The blue line is the line plot obtained after the application of the threshold and locating the edge in the binarized extracted band.
Method 2: Linear Piston Motion
In the second method, linear motion of the piston is measured. The piston actuates the syringe plunger in any device based on the syringe pump principle. A 1-mm glass calibration slide (0.05 ± 0.01 mm) was placed on the piston of the EUT within the microscope’s field of view, and the first frame of the recorded video was used to set the calibration factor. As the reservoir chamber obscures the M722G piston, a 3D-printed extension was affixed to the piston as shown in Figure 3. The change in position of the calibration slide graduations was recorded and tracked in each frame, which was then plotted against time (determined from the video frame rate). The MATLAB program accuracy for method 2 was verified against displacement measured using a Vision Measuring System (Insize ISD-V250, resolution of 0.001 mm). Linear resolution of the optical system was estimated to be 0.003 mm, and the microscope video frame rate provides a temporal resolution of 0.033 (1/30) seconds.
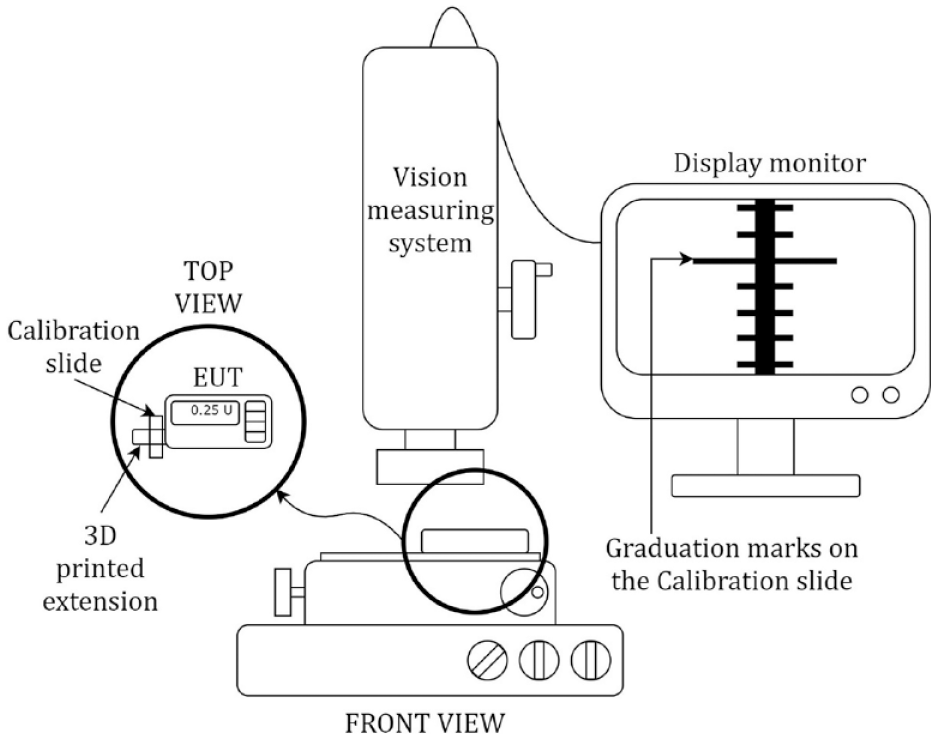
Experimental test setup of Method 2: Linear piston motion. The 3D-printed extension with calibration slide is attached to the piston of the EUT and placed under the view of the Vision Measuring System. Abbreviation: EUT, Equipment Under Test.
The program for tracking the graduation mark is derived from the previous program, differing only in the method of alignment and calibration orientation. Alignment is done by comparing the first and last frame of the video and aligning two known position markers to the horizontal (see Figure 4).
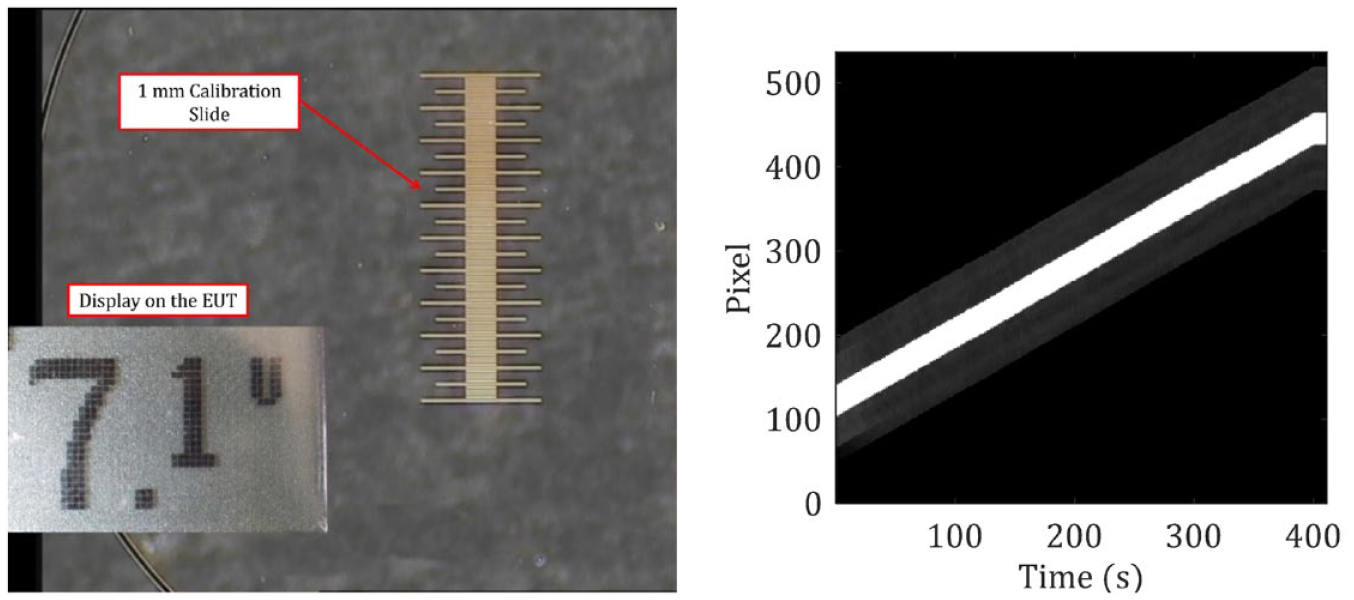
(Left) The graduation marks on the calibration glass slide coupled with the piston recorded by the optical camera of vision measuring system at 4× magnification. (Left inset) The display from the EUT was captured to track the bolus delivery. (Right) The extracted band from the middle of the calibration slide is plotted with respect to time. Abbreviation: EUT, Equipment Under Test.
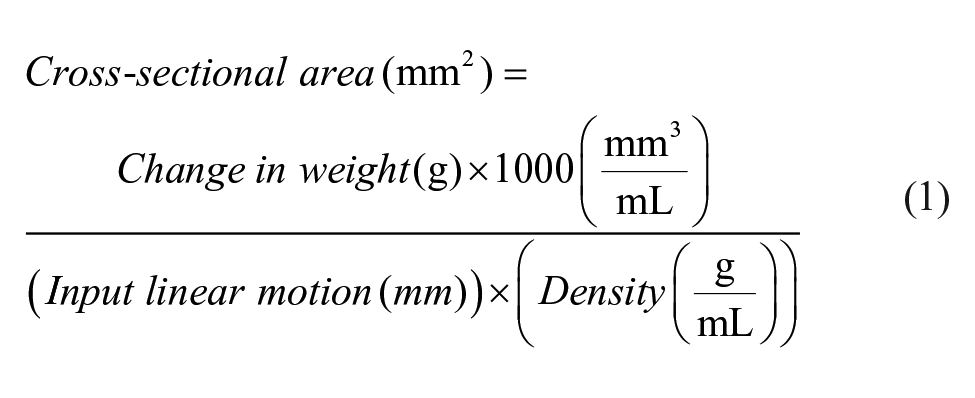
As a prerequisite to relate the delivery volume to piston linear motion, the cross-sectional area of the reservoir (Medtronic MiniMed 3ml reservoir) 13 must be known. This was determined by evaluating the delivered volume for a known displacement, provided via a 3D-printed piston mounted on a linear stage (Thorlabs, LTS300). The reservoir via the infusion set cannula was attached to a capillary placed within a beaker. The beaker was prefilled with distilled water and a 5-mm layer of mineral oil to avoid evaporation of water. This was then placed on the platform of a sensitive weighing scale (±0.001 g) to record changes in weight. A displacement of 2 mm (±0.001 mm) was set as input on the linear stage, and the difference in weight (after stabilization) was recorded. The change in weight was converted to volume using the known density of distilled water used (0.9982 g/mL at 20°C). This experiment was repeated five times, with the plunger at different portions of the reservoir. The overall mean across runs was calculated to determine the cross-sectional area:
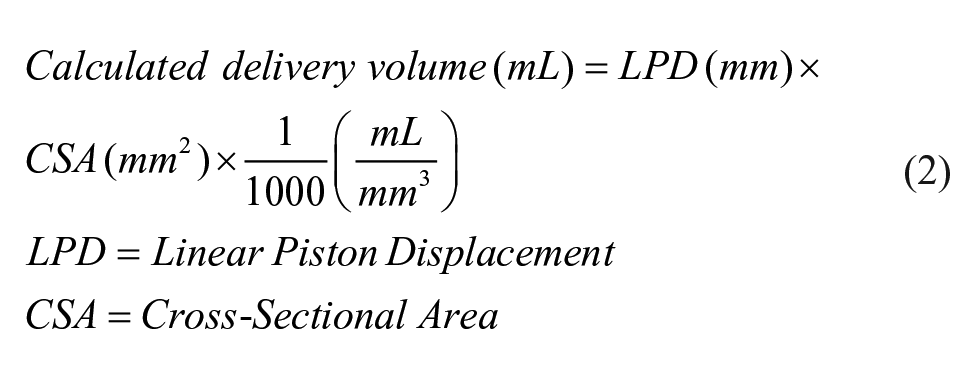
The cross-sectional area (calculated using equation 1) and linear piston motion (obtained from method 2) are multiplied to determine the expected delivery volume for a programmed bolus of 10 U:
Results
The mean delivery error using method 1 for IFP, averaged over 20 runs, is 2.62 % vs −0.26% for M722G for 1 U (0.01 mL) of programmed delivery. The delivery inaccuracies in IFP are higher than that of the M722G, but within the range of previously reported values for other commercially available insulin pumps. 14 Table 1 summarizes the results of method 1. Temporal dynamics as revealed in Figure 5 show that a significant portion of insulin delivery happens after bolus duration for both IFP and M722G. For 1U programmed delivery, after the bolus duration of 40 seconds, 14.31% insulin was delivered in IFP vs 9.38% for M722G, whereas for 0.5U programmed delivery (bolus duration of 20 seconds) respective numbers were 25.71% and 16.16% (see Table 1).
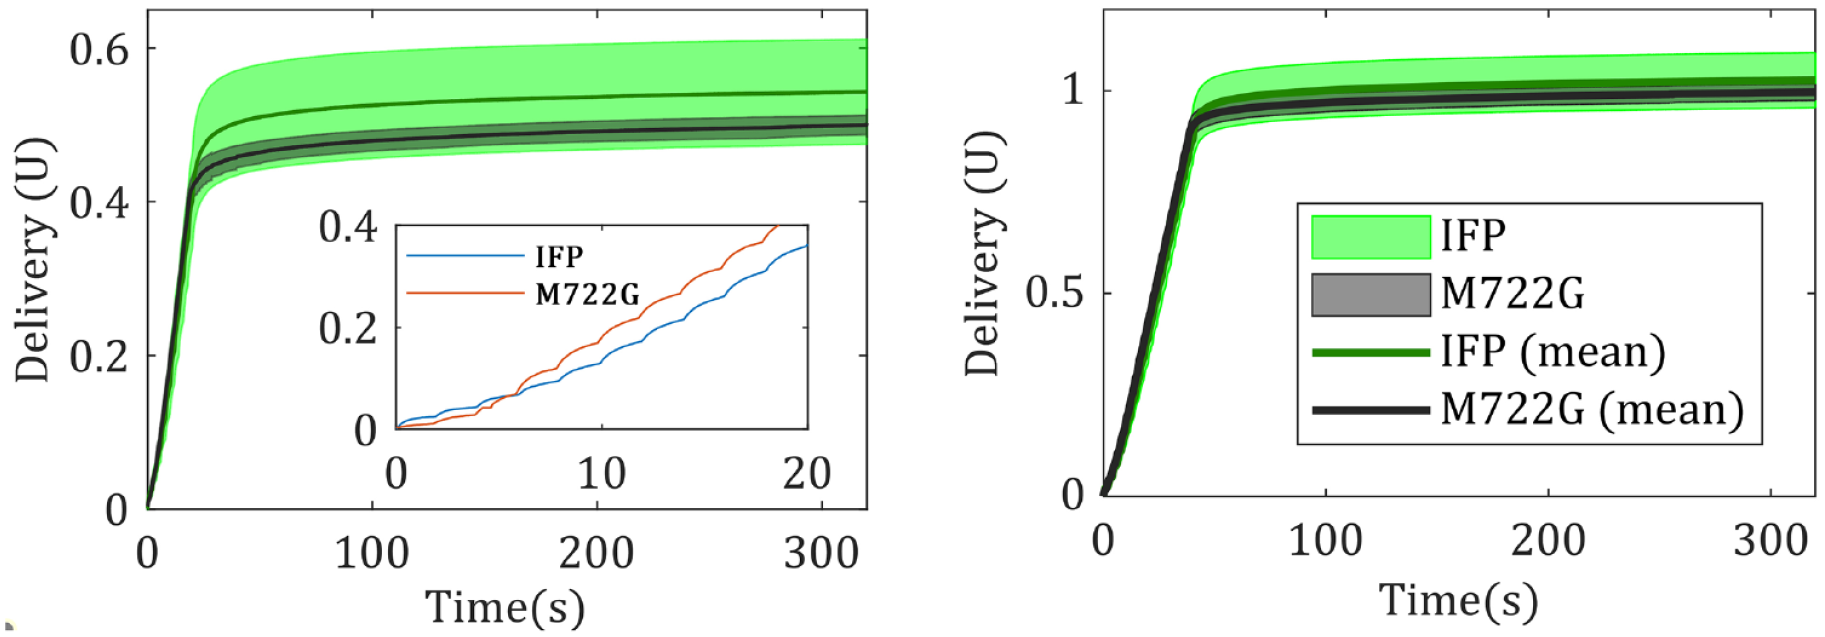
Delivery plots for pipette test of 0.5 U of programmed delivery (left). The delivery of IFP and M722G for an exemplar experiment (left inset). Delivery plots for pipette test of 1 U of programmed delivery (right). Abbreviation: IFP, InsuFlo Prototype.
Result Summary for Method 1 (Pipette Test).
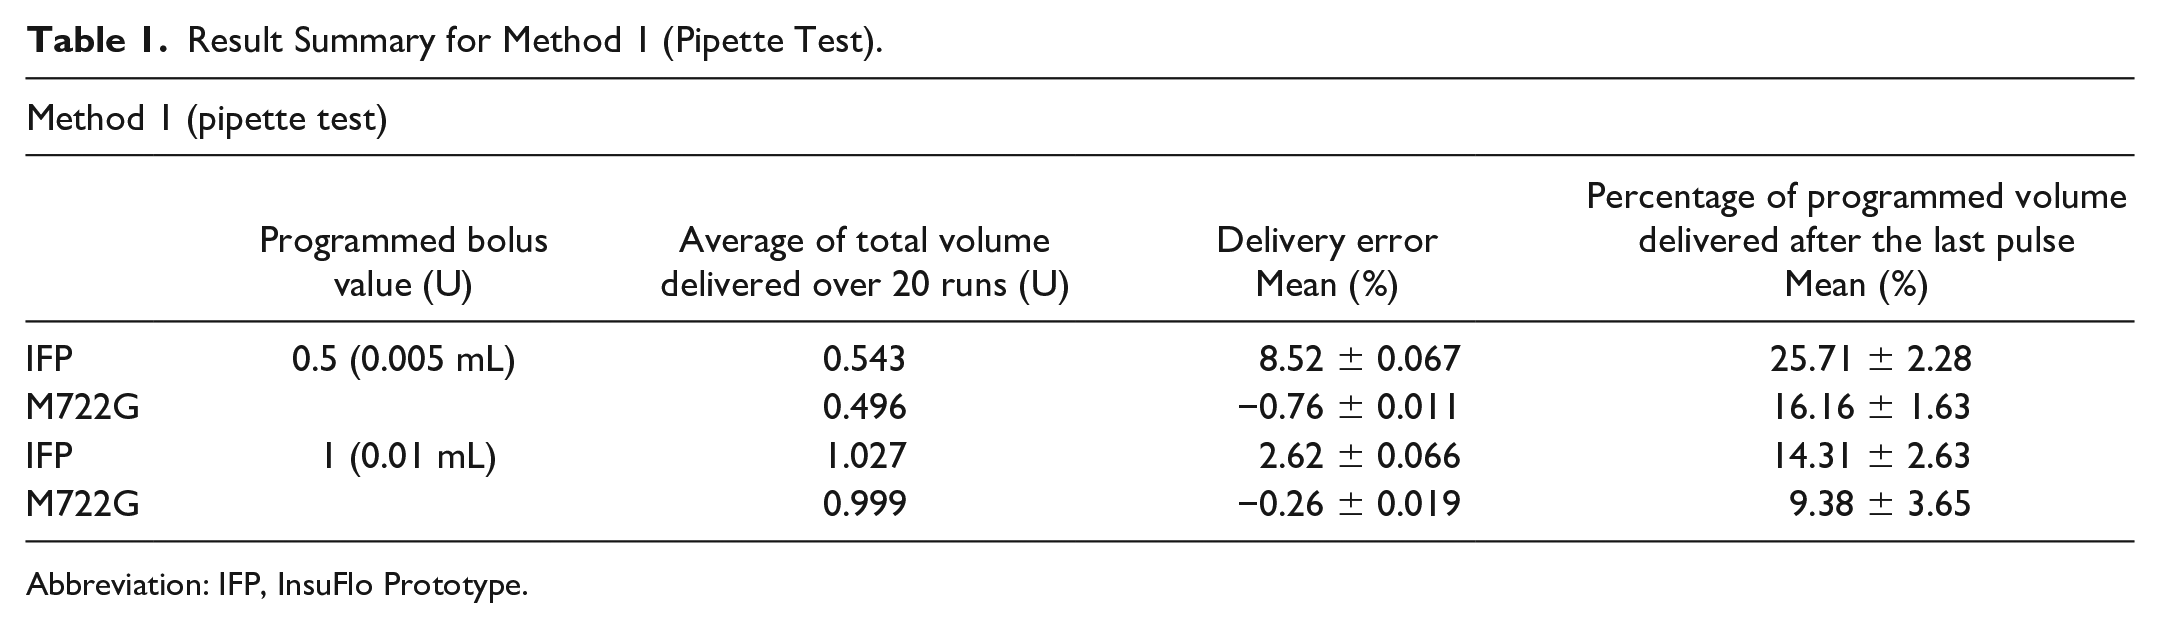
Abbreviation: IFP, InsuFlo Prototype.
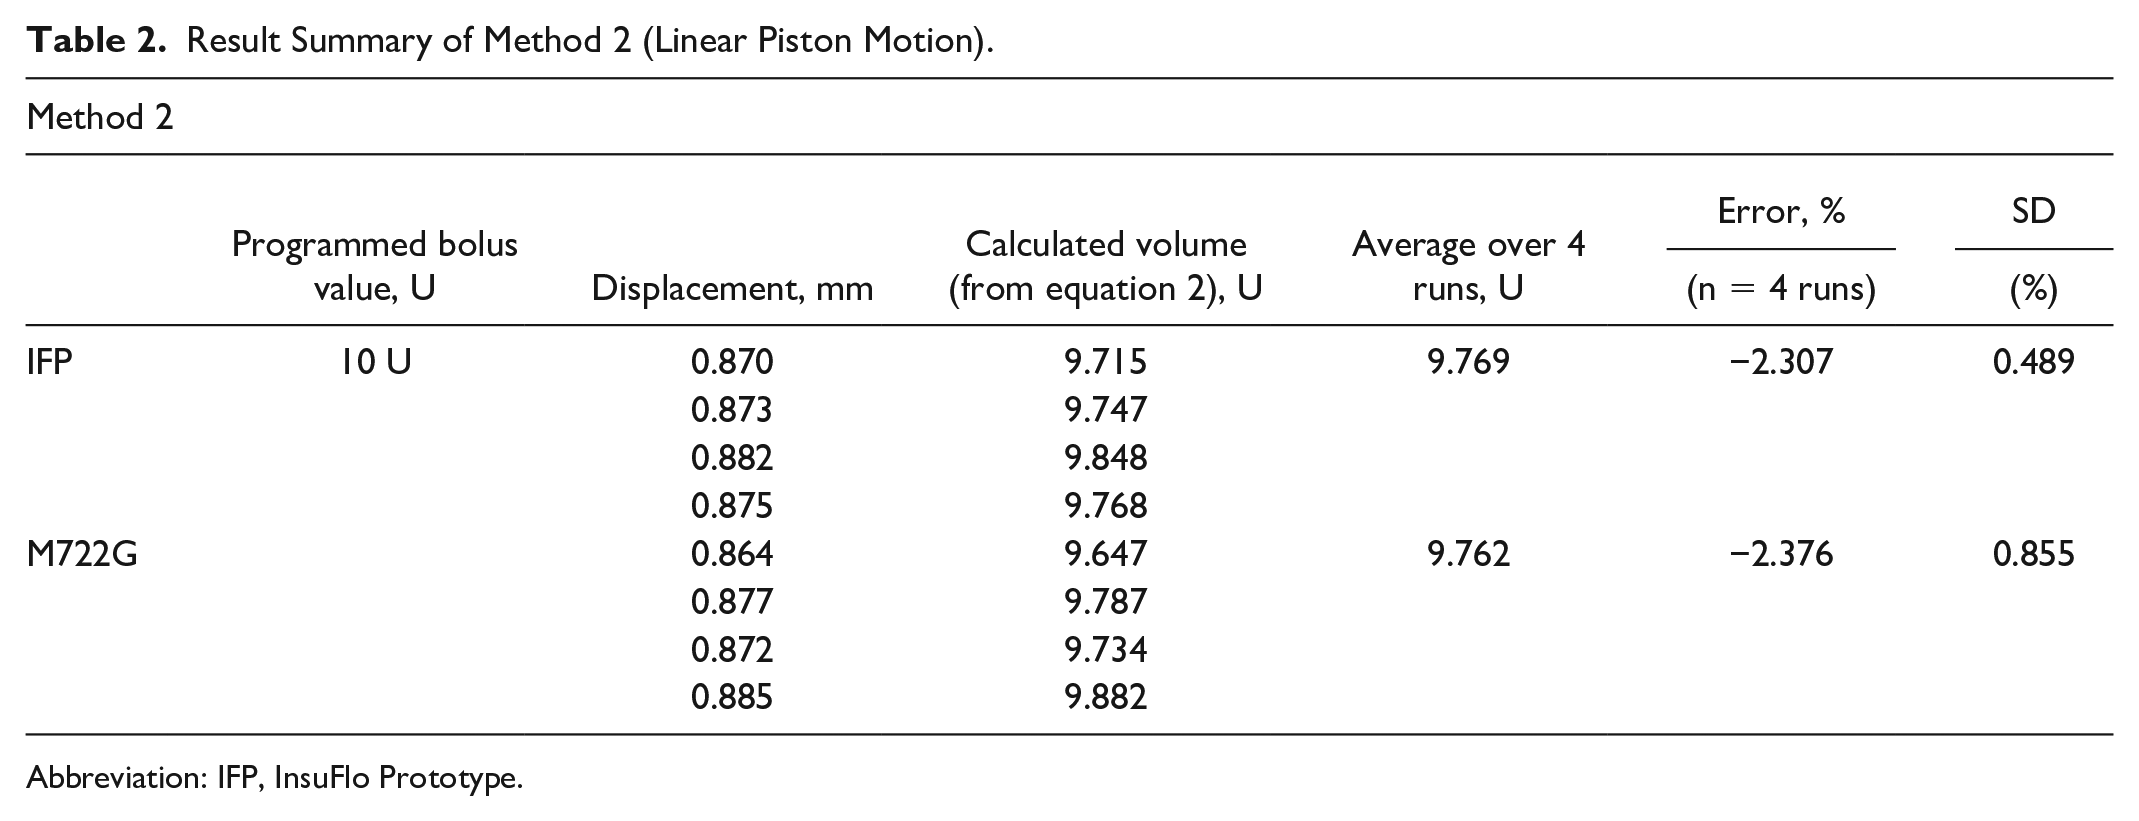
The cross-sectional area was calculated to be 112 ± 1 mm2 for a linear piston input of 2000 μm ± 1 μm, averaged over 5 runs (using equation 2). The mean delivery error (for calculated volume) using method 2 for IFP is −2.3% vs 2.4% for M722G (n = 4). Tracked linear motion of the piston, for IFP and M722G, is shown in Figure 6 for a single run and Table 2 summarizes the results.
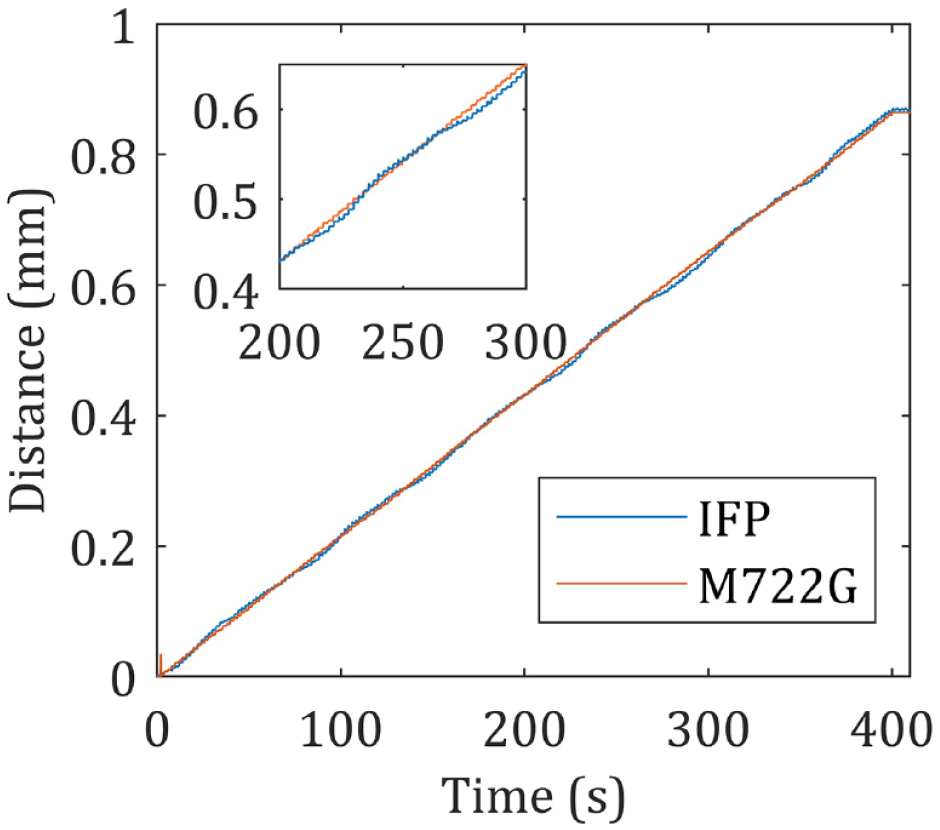
Linear motion of the piston of IFP. The zoomed-in view shows the periodic nature of linear motion (inset). Abbreviation: IFP, InsuFlo Prototype.
Result Summary of Method 2 (Linear Piston Motion).
Abbreviation: IFP, InsuFlo Prototype.
Discussion
The volumetric delivery accuracy of an insulin pump is critical as accumulation of errors can potentially cause episodes of hyperglycemia/hypoglycemia. This article presents methods to extract temporal delivery information for insulin pumps, and by extension, liquid drug delivery systems. They are relatively easy to set up and economical as compared with standard microgravimetric techniques. These methods can be used by device designers/engineers/regulators to benchmark devices under development, against commercially available pumps. Furthermore, device developers can also leverage this information to devise algorithmic compensation strategies for potential sources of errors, such as frictional forces between the insulin reservoir and plunger. As evident in Figure 5, the programmed delivery volume is achieved in a few minutes after the last pulse. This has implications for the design of an AP system, which may need to model temporal response and resulting errors of the insulin delivery device. In the case of open-loop systems, temporal delay in completion of delivery should be accounted for by patients, prior to pump disconnection.
Temporal plots of volumetric delivery and linear motion provide crucial insights into the delivery dynamics of IFP to the authors. Pipette tests reveal that the delivery flow rate varies from pulse to pulse, and the first few pulses are particularly slow to respond. The authors hypothesize that viscoelastic effects of the O-ring, frictional forces between it and the reservoir wall, and silicon oil lubrication 15 are probable reasons behind the deviation in delivery. The IFP prototype makes use of a novel, actuator-agnostic kinematic chain to achieve micro-motion. However, component alignment issues in a 3D-printed prototype can lead to minor delivery errors. This can potentially explain the periodic variation visible in plots of the piston linear motion (see Figure 6). Addressing these issues can subsequently improve the overall performance of IFP.
Method 1 can be further extended to account for subcutaneous backpressure, by adding appropriate attachments to the exit port of the pipette. Method 2 only checks for piston movement and does not account for other factors that may affect delivery volume, such as compliance of delivery pathway, variation in cross-section of the insulin reservoir, and viscoelastic effects.
Conclusions
Pipette test results of IFP show an error value which is well within the acceptable limit of ±5% put forth by most manufacturers in their instruction manuals. Error for the calculated delivery volume using linear piston motion analysis for IFP is comparable with M722G; however, IFP has a lower variation.
The experiments and methodology proposed build upon the work put forth by Zisser et al 4 by digitally tracking the meniscus in place of manual measurements of its position. The two methods presented in this article help understand the delivery dynamics of liquid drug delivery devices (based on the syringe pump principle). Our results indicate that a significant fraction of insulin delivery happens after the planned bolus duration, which might be important consideration for design of AP systems.
Footnotes
Abbreviations
AP, artificial pancreas; CSA, cross-sectional area; EUT, Equipment Under Test; FDA, Food and Drug Administration; IEC, International Electrotechnical Commission; IFP, InsuFlo Prototype; LPD, linear piston displacement; M722G, Medtronic Paradigm Real time 722G; SD, standard deviation; U, international units.
Authors’ Note
An earlier version of our work was reported as a poster in the Advanced Technologies & Treatments for Diabetes (2021) conference held online.
Declaration of Conflicting Interests
The author(s) declared no potential conflicts of interest with respect to the research, authorship, and/or publication of this article.
Funding
The author(s) disclosed receipt of the following financial support for the research, authorship, and/or publication of this article: This work is funded and supported by the GYTI-SITARE award and BIG scheme of BIRAC, with C-CAMP as our BIG partner. Additioal support has also been receievd from the Honeywell CSR program via SID and CPDMeD at IISc, Bangalore. The work has been previously supported by the IMPRINT program of MHRD, GoI.
Supplemental Material
Supplemental material for this article is available online.
References
Supplementary Material
Please find the following supplemental material available below.
For Open Access articles published under a Creative Commons License, all supplemental material carries the same license as the article it is associated with.
For non-Open Access articles published, all supplemental material carries a non-exclusive license, and permission requests for re-use of supplemental material or any part of supplemental material shall be sent directly to the copyright owner as specified in the copyright notice associated with the article.