
Abstract
Background:
Emerging data highlight the interactions of preadmission glycemia, reflected by admission HbA1c levels, glycemic control during critical illness, and mortality. The association of preadmission insulin treatment with outcomes is unknown.
Methods:
This observational cohort study includes 5245 patients admitted to the medical-surgical intensive care unit of a university-affiliated teaching hospital. Three groups were analyzed: patients with diabetes with prior insulin treatment (DM-INS, n = 538); patients with diabetes with no prior insulin treatment (DM-No-INS, n = 986); no history of diabetes (NO-DM, n = 3721). Groups were stratified by HbA1c level: <6.5%; 6.5%-7.9% and >8.0%.
Results:
Among the three strata of HbA1c, mean blood glucose (BG), coefficient of variation (CV), and hypoglycemia increased with increasing HbA1c, and were higher for DM-INS than for DM-No-INS. Among patients with HbA1c < 6.5%, mean BG ≥ 180 mg/dL and CV > 30% were associated with lower severity-adjusted mortality in DM-INS compared to patients with mean BG 80-140 mg/dL and CV < 15%, (P = .0058 and < .0001, respectively), but higher severity-adjusted mortality among DM-No-INS (P = .0001 and < .0001, respectively) and NON-DM (P < .0001 and < .0001, respectively). Among patients with HbA1c ≥ 8.0%, mean BG ≥ 180 mg/dL was associated with lower severity-adjusted mortality for both DM-INS and DM-No-INS than was mean BG 80-140 mg/dL (p < 0.0001 for both comparisons).
Conclusions:
Significant differences in mortality were found among patients with diabetes based on insulin treatment and HbA1c at home and post-admission glycemic control. Prospective studies need to confirm an individualized approach to glycemic control in the critically ill.
Introduction
The uneven results of randomized controlled trials (RCTs) of intensive insulin therapy (IIT) have been attributed to low time in targeted blood glucose (BG) range, treatment protocol violations, differences in nutritional therapy, differences in BG monitoring technologies, and high rates of hypoglycemia among patients treated with the “tight” BG target.1-6 Importantly, patients in the interventional arms of IIT were treated with the same BG target, ignoring differences in preadmission glycemic or treatment status.
A host of observational cohort studies have reported different relationships between mean BG,7-10 glucose variability,9-11 and time in targeted BG range12,13 to mortality when comparing patients with and without diabetes. Presumably, in patients with diabetes, a protective response to chronic hyperglycemia may develop, while in those without prior hyperglycemia, no protective mechanisms have been activated. 14 There is also evidence from the IIT RCTs of a difference in therapeutic benefit, favoring patients without diabetes.15,16 Egi et al 17 found that preadmission glycemia, reflected by HbA1c levels, modulated the relationship of mean BG to mortality in a cohort of patients with diabetes. Subsequent investigations have evaluated the interaction of admission BG and preadmission glycemia, derived from HbA1c measurement, 18 consistently finding that increasing divergence from chronic glycemia, rather than the absolute level of acute glycemia, was strongly associated with mortality.19-21
A recently published cohort investigation evaluated the relationship of acute glucose metrics to mortality using all ICU BG data instead of just the admission BG value, and stratified patients by bands of HbA1c obtained at or near ICU admission. 22 This study reported that for patients with HbA1c < 6.5%, higher mean BG during ICU stay was associated with increased risk of death but for patients with HbA1c ≥ 8.0%, the opposite relationship was seen, with higher mean BG during ICU stay associated with reduced risk of mortality.
Previous studies did not evaluate the treatment that patients with diabetes received before hospitalization.1,4-13,17,22 Compared to non-insulin requiring patients prior to admission, insulin-treated patients likely had longer durations of disease and greater vascular complication burden at the time of ICU admission. Moreover, exogenous insulin can also exert other metabolic and non-metabolic effects that could affect the response to critical illness.23,24
Accordingly, we expanded the dataset analyzed in the former study 22 to include preadmission insulin use in patients with diabetes. We hypothesized that prior insulin treatment of patients with diabetes admitted to the ICU would be associated with changes in BG control during ICU stay as well as the relationship of ICU glucose control metrics to mortality.
Research Design and Methods
This is an observational cohort study including prospectively collected data. It was approved by the institutional review board of Stamford Hospital (Western IRB #1-1167662-1); the need for informed consent was waived.
Description of Institution, Included Patients, and Glucose Management Protocol
Stamford Hospital is a major teaching affiliate of Columbia Vagelos College of Physicians and Surgeons. The 20-bed intensive care unit (ICU) treats a heterogeneous population of medical and surgical patients, with care delivered by intensivist-led teams including house staff and mid-level practitioners.
The investigation included patients with at least four BG values during ICU stay who were admitted between 10/11/11 and 11/30/19 and had HbA1c level obtained at ICU admission or within three months prior to admission. Exclusions included patients admitted for diabetic ketoacidosis or following cardiovascular surgery (due to their very low mortality) or with a new diagnosis of diabetes (patients without prior history of DM but with HbA1c ≥ 6.5%). Patient flow showing included and excluded patients is detailed in Figure 1. A subset of these patients has been included in a previously published study. 25
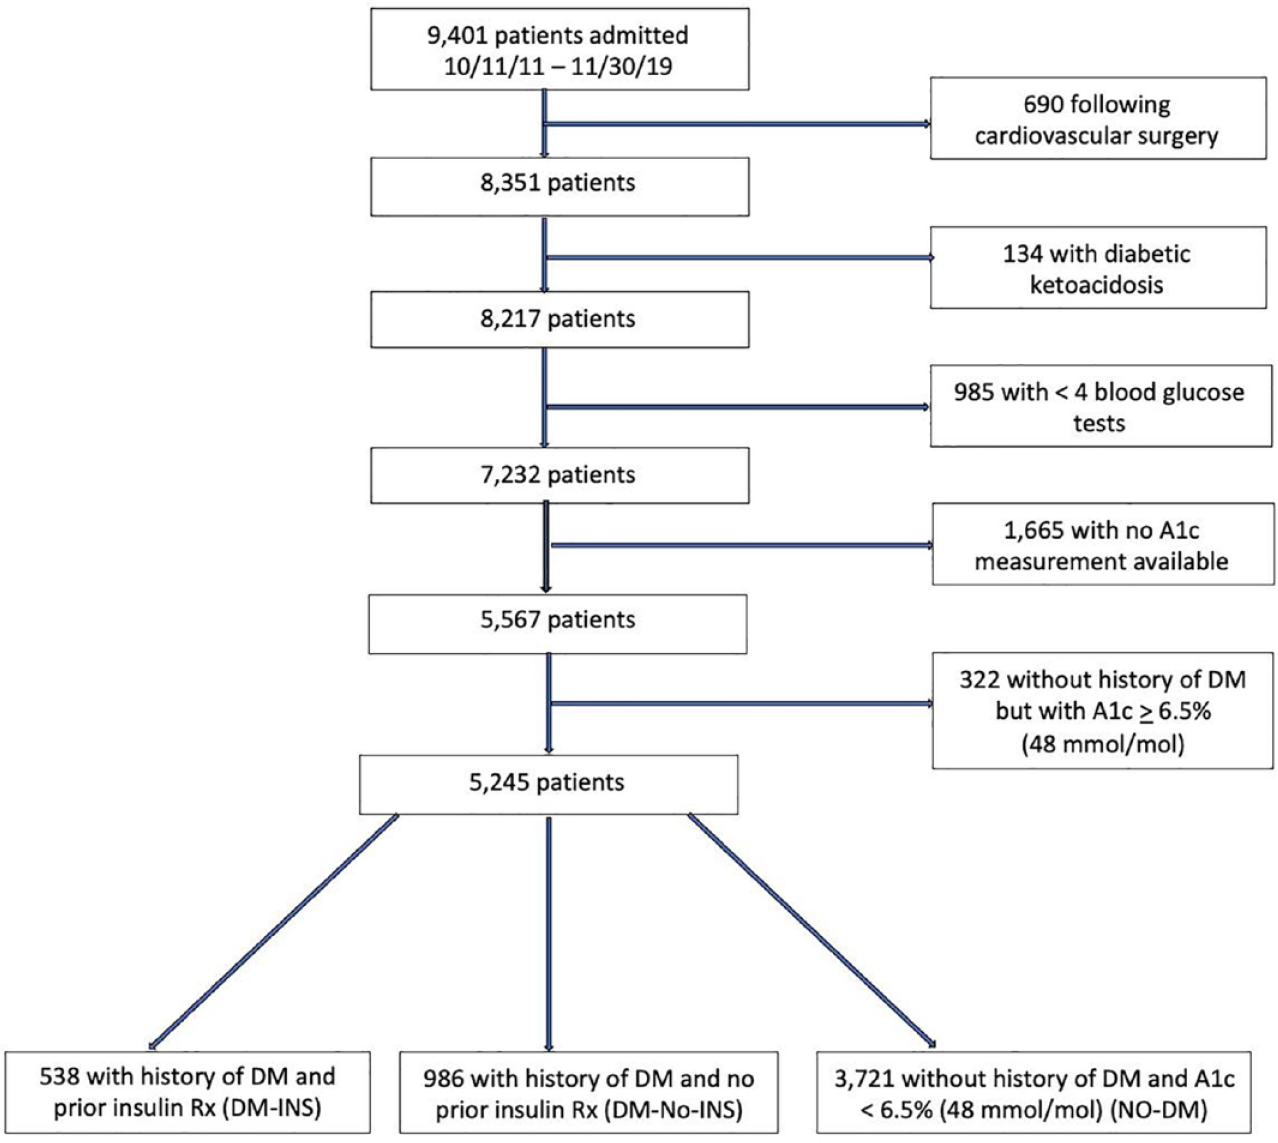
Patient flow of excluded and included patients.
Before 9/14/14, all patients were treated to a BG target 90-120 mg/dL (n = 1614). After this date, patients with HbA1c < 7.0% and ≥ 7.0% were treated to BG targets 80-140 and 110-160 mg/dL, respectively (n = 3953). The decision to adopt two BG targets, based on available literature,3,7-10 was approved by hospital administration.
Blood glucose monitoring interval was a minimum of every three hours for all patients. If a patient required intravenous insulin the interval was changed to every one hour. Though capillary blood was used, arterial or venous blood was preferred. BG was measured using the GEM 4000 arterial blood gas analyzer (Instrument Laboratories, Bedford, MA, USA) or Accu-Chek Inform II glucose meter (Roche Diagnostics, Indianapolis, IN, USA). Between 2011 and 2016, HbA1c was measured using ADVIA 1800 (Siemens AG, Munich, Germany); subsequently, the Architect 8000 chemistry system was used (Abbot Laboratories, Chicago, ILL, USA).
Patients were treated with intravenous insulin when BG exceeded 180 mg/dL on two consecutive evaluations. For milder degrees of hyperglycemia, subcutaneous short acting analogue insulin was administered every three hours. Treatment was guided by a protocol, and nurses were empowered to make decisions regarding insulin dosing. 26
Data Abstraction
Information abstracted from the ICU’s comprehensive database included BG values, patient demographics and comorbidities, diabetes diagnosis, ICU admitting diagnosis, severity of illness scores (calculated prospectively by one of the authors [JSK] and entered prospectively into the database before 2018 and subsequently by the Phoenix software application [Medical Decisions Network, Charlottesville VA, USA]), ICU length of stay (LOS), and mortality status at hospital discharge. Details regarding preadmission medications were collected from the hospital’s electronic medical record.
Statistical Plan
We stratified patients into three groups based on history of diabetes, presence or absence of insulin treatment as an outpatient immediately prior to admission, and HbA1c level:
*Diabetes with prior insulin treatment (DM-INS)
*Diabetes with no prior insulin treatment (DM-No-INS)
*No diabetes, defined as no history of DM and HbA1c < 6.5% (NO-DM)
Glucose Metrics
*Mean BG was calculated for each patient. It was not time-weighted due to the frequency of testing, included all BG obtained during ICU admission, and was subsequently displayed as bands: 80-139, 140-179, and ≥180 mg/dL.
*Hypoglycemia was defined as having one or more BG ≤ 70 mg/dL. Additional analyses included hypoglycemia defined as <55 and <40 mg/dL.
*Glucose variability was assessed using coefficient of variation (CV, calculated as the standard deviation [SD] of mean BG divided by mean BG) and displayed in bands: <15%, 15%-30%, and ≥30%.
Mortality was defined as status at hospital discharge, including mortality on the general ward that occurred after ICU discharge.
The primary analysis compared DM-INS and DM-No-INS regarding (1) differences in ICU glucose metrics, and (2) differences in the relationship of these glucose metrics to mortality. These two analyses included the entire cohort of the two groups as well as stratification by bands of HbA1c: <6.5%, 6.5%-7.9%, and ≥ 8.0% following the strategy of previously published studies.22,26 A secondary analysis compared NO-DM with DM-No-INS.
Continual variables are reported as median (interquartile range [IQR]) or mean (SD) and compared using the Mann-Whitney rank sum or Student’s t-test, as appropriate. Categorical variables are reported as percentages and compared using the Chi Square test. We defined severity-adjusted mortality by calculating observed:expected mortality ratios (the ratio of actual mortality and expected mortality, using the Acute Physiology and Chronic Health Evaluation IV model of mortality prediction [APIV PM]). 27 We compared these ratios using the Z-test for independent proportions for between group comparisons to assess the relationship of glucose metrics to mortality. 28
A P value of <.05 was considered statistically significant.
We used MedCalc Statistical Software version 18.11.6 (MedCalc Software bvba, Ostend, Belgium; https://www.medcalc.org; 2019) for statistical analysis.
Results
The investigation includes 5245 patients who had 195 428 BG tests obtained during ICU stay. For the entire cohort there were 11.4 (18.8) (mean, SD) BG tests per 24 hours.
Clinical Characteristics
Table 1 compares the groups regarding comorbidities, outpatient treatments, severity of illness, and distribution of admitting diagnoses.
Clinical Characteristics of the Patients.
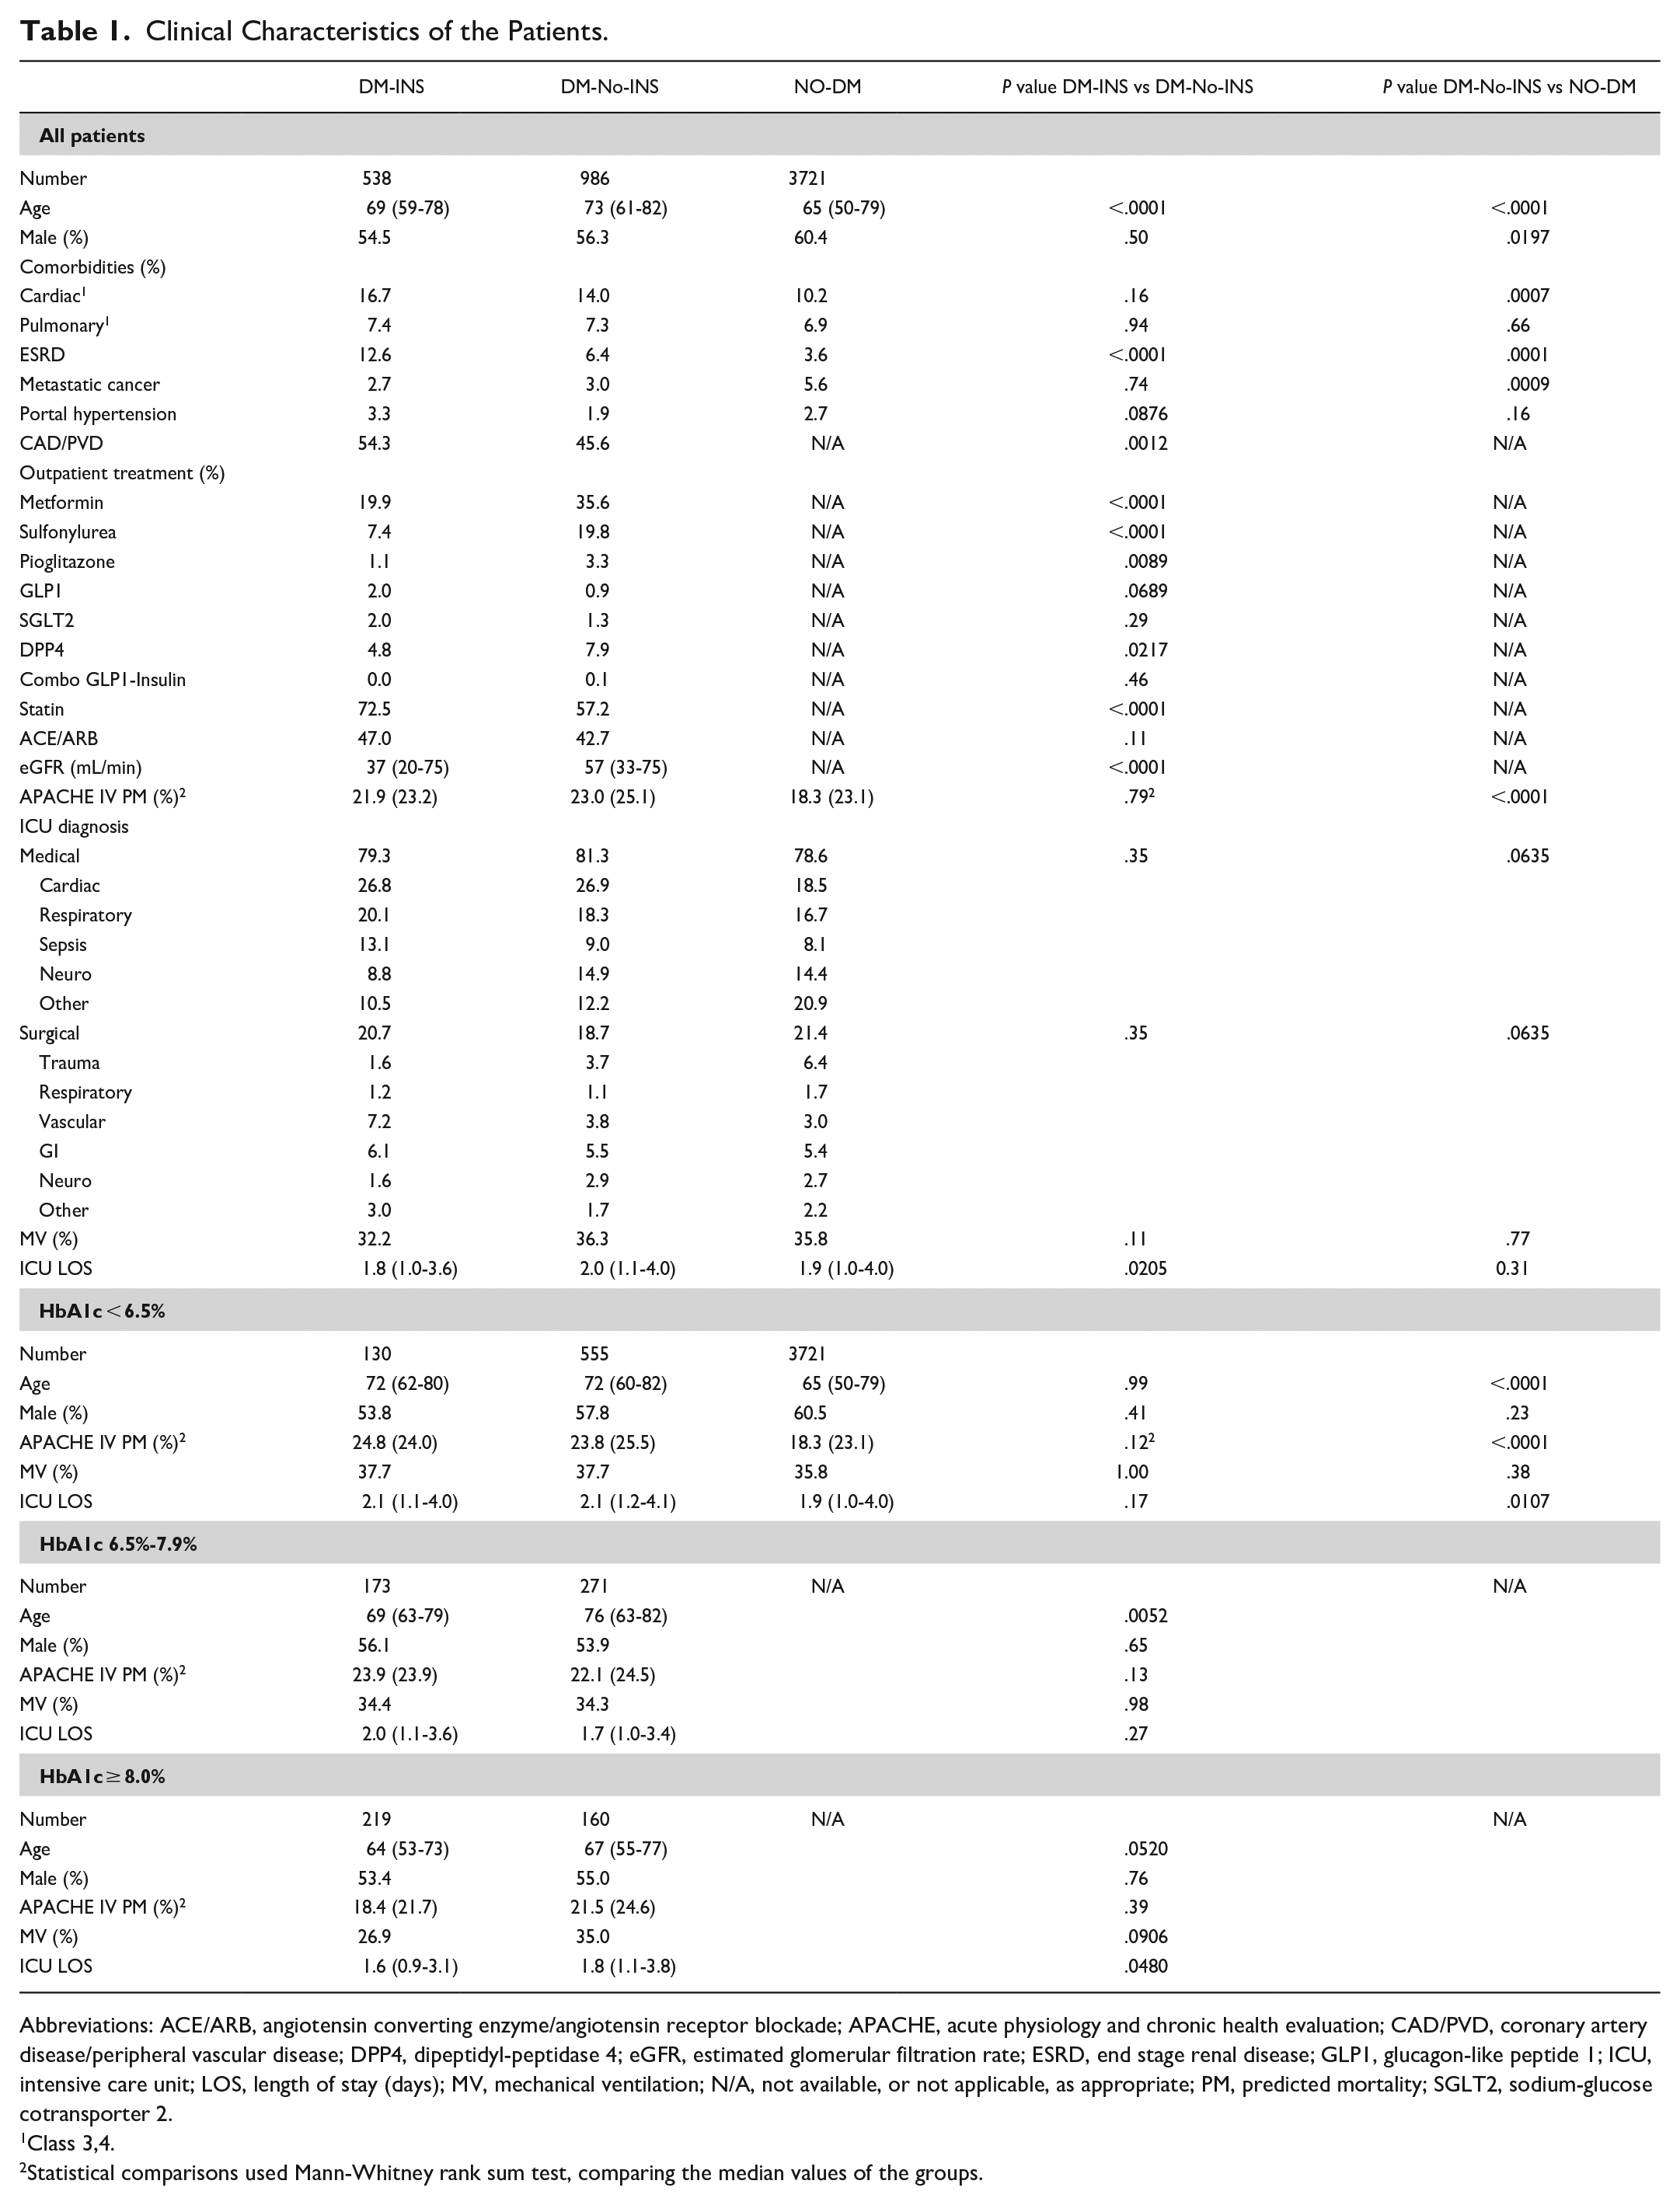
Abbreviations: ACE/ARB, angiotensin converting enzyme/angiotensin receptor blockade; APACHE, acute physiology and chronic health evaluation; CAD/PVD, coronary artery disease/peripheral vascular disease; DPP4, dipeptidyl-peptidase 4; eGFR, estimated glomerular filtration rate; ESRD, end stage renal disease; GLP1, glucagon-like peptide 1; ICU, intensive care unit; LOS, length of stay (days); MV, mechanical ventilation; N/A, not available, or not applicable, as appropriate; PM, predicted mortality; SGLT2, sodium-glucose cotransporter 2.
1Class 3,4.
2Statistical comparisons used Mann-Whitney rank sum test, comparing the median values of the groups.
Glucose Metrics and HbA1c
Table 2 shows the relationship of glucose metrics to strata of HbA1c. Mean BG and CV increased with increasing HbA1c for DM-INS and DM-no-INS (P < .0001 for each comparison), and mean BG, CV, and hypoglycemia were higher for all strata of HbA1c among DM-INS than among DM-No-INS.
Intensive Care Unit Glucose Metrics.
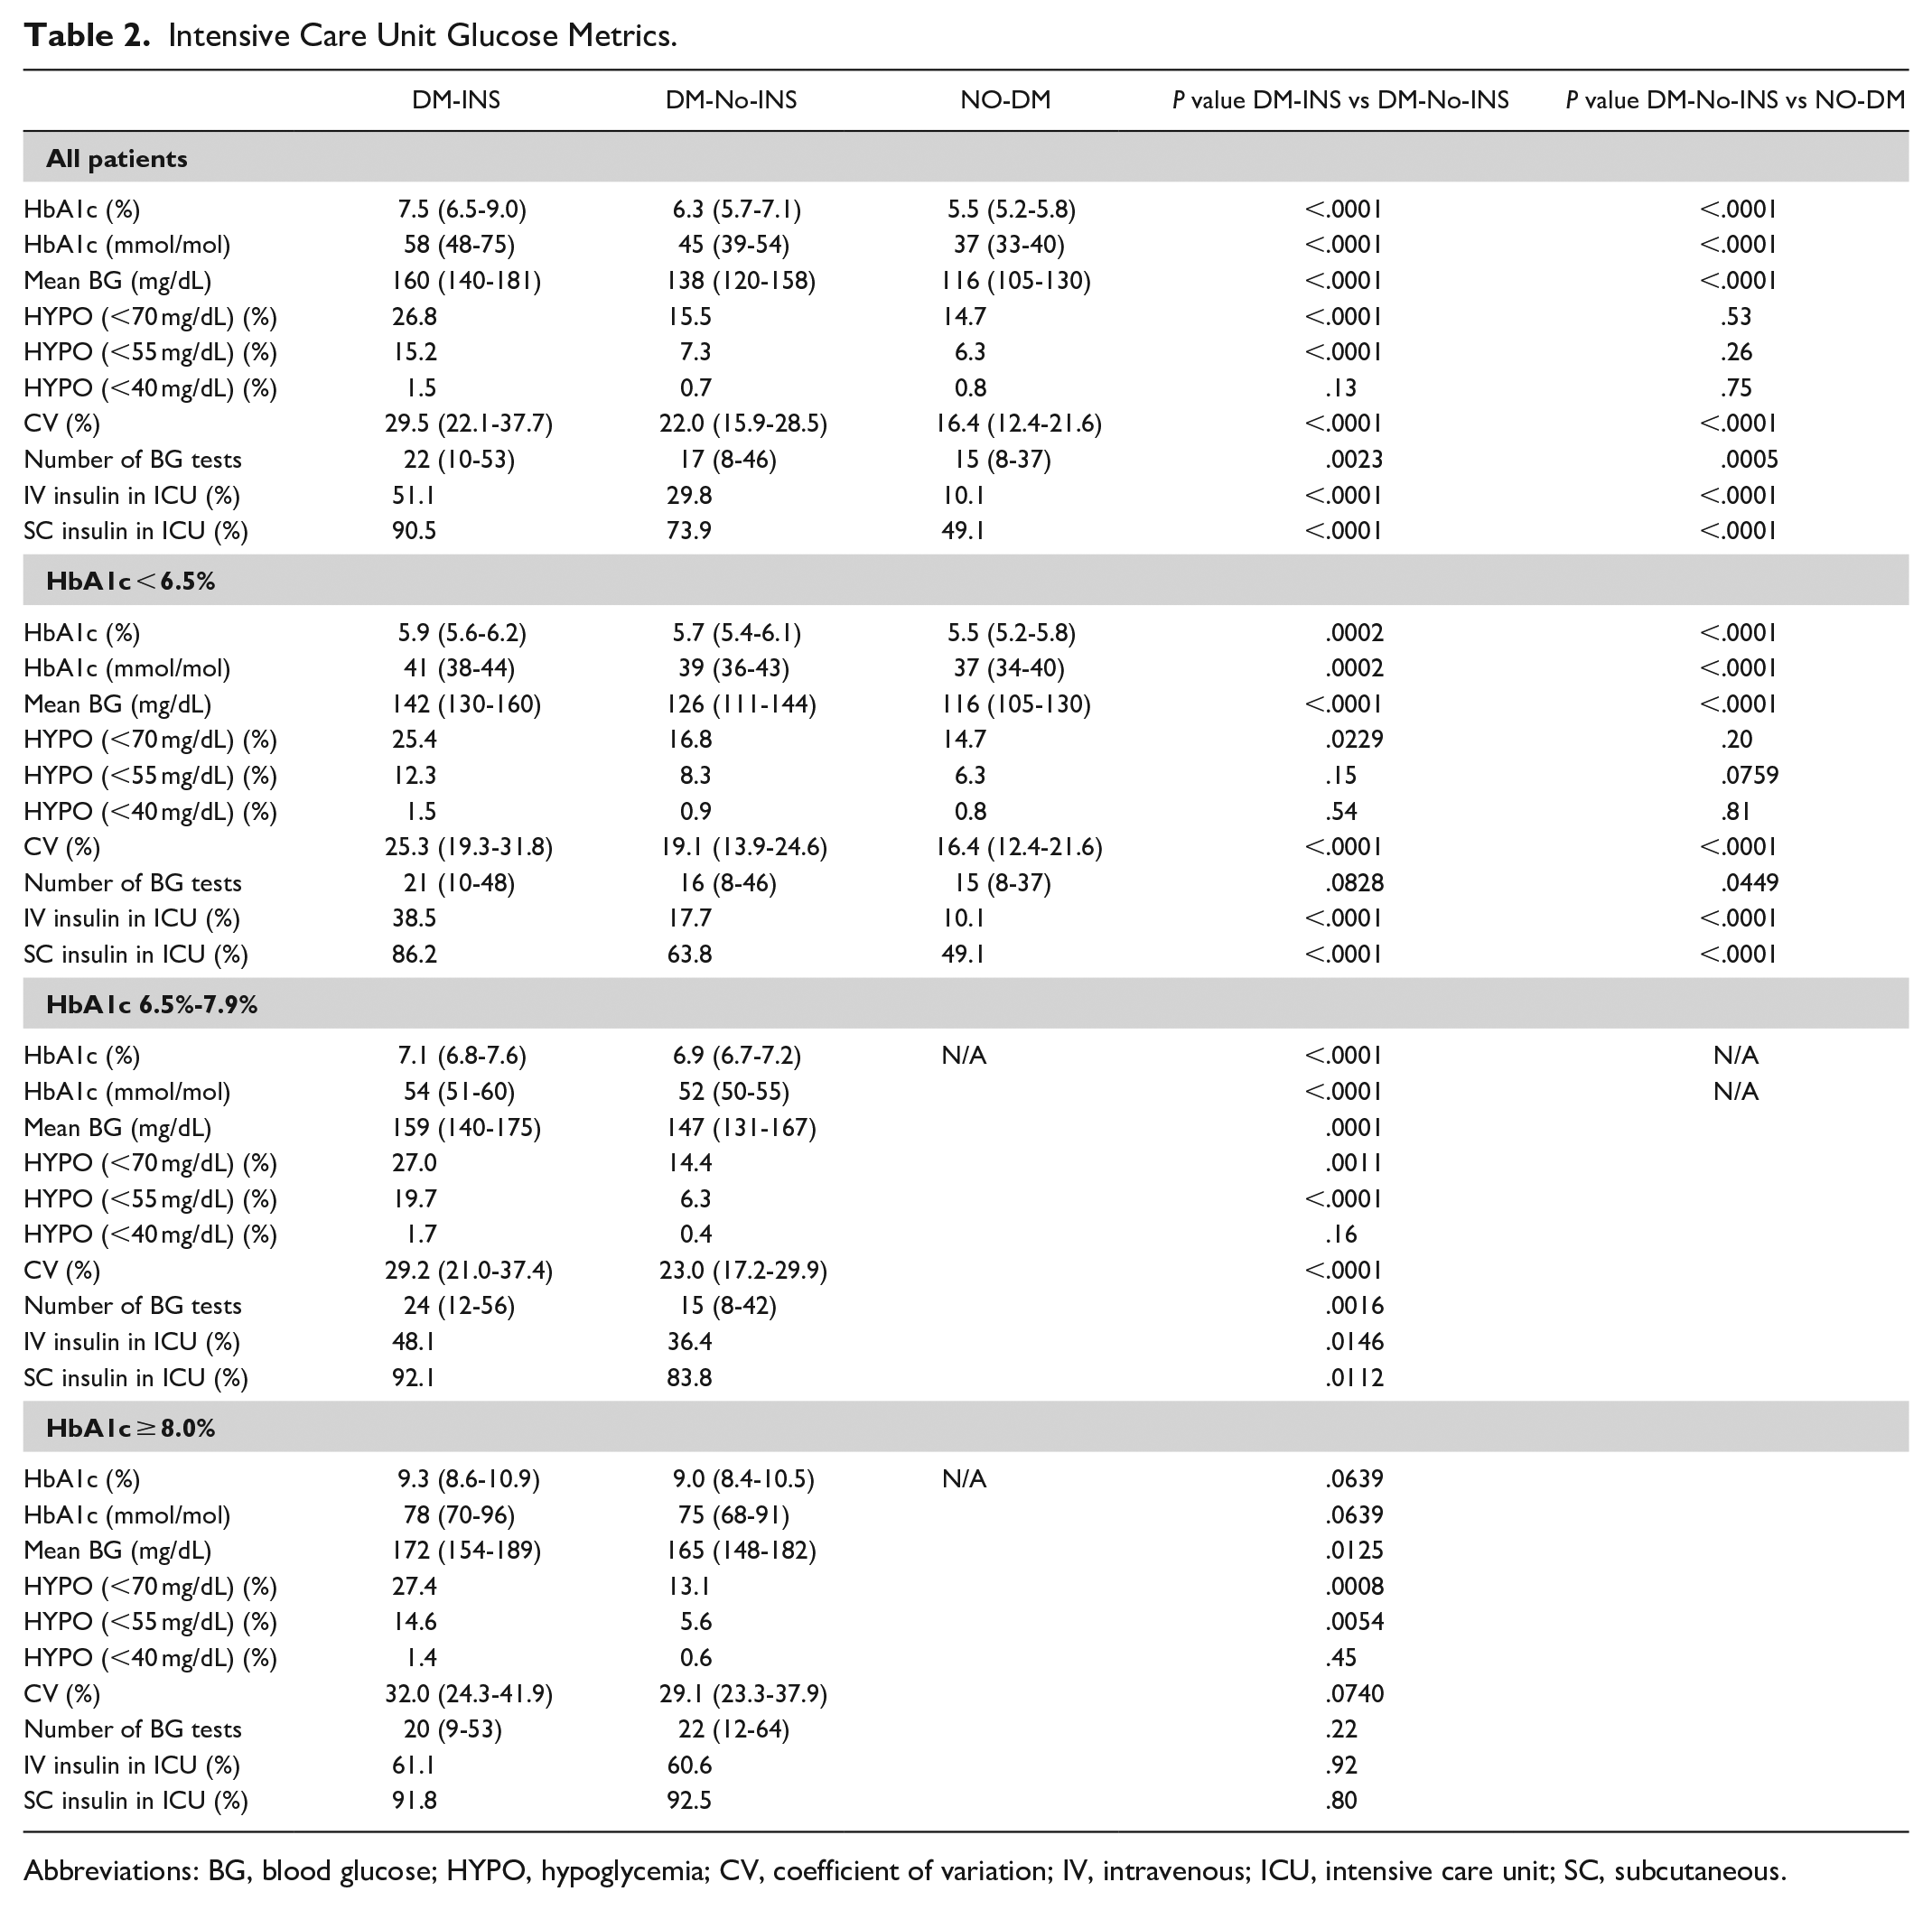
Abbreviations: BG, blood glucose; HYPO, hypoglycemia; CV, coefficient of variation; IV, intravenous; ICU, intensive care unit; SC, subcutaneous.
Table 3 displays the changes in glucose metrics before and after the change from one BG target for all patients to two targets. Mean BG increased during the second period among DM-INS and DM-No-INS, as expected. Hypoglycemia and CV were higher among DM-INS than DM-No-INS in both periods.
Comparison of Glucose Metrics Before and After Change to Two BG Targets on 9/14/14.
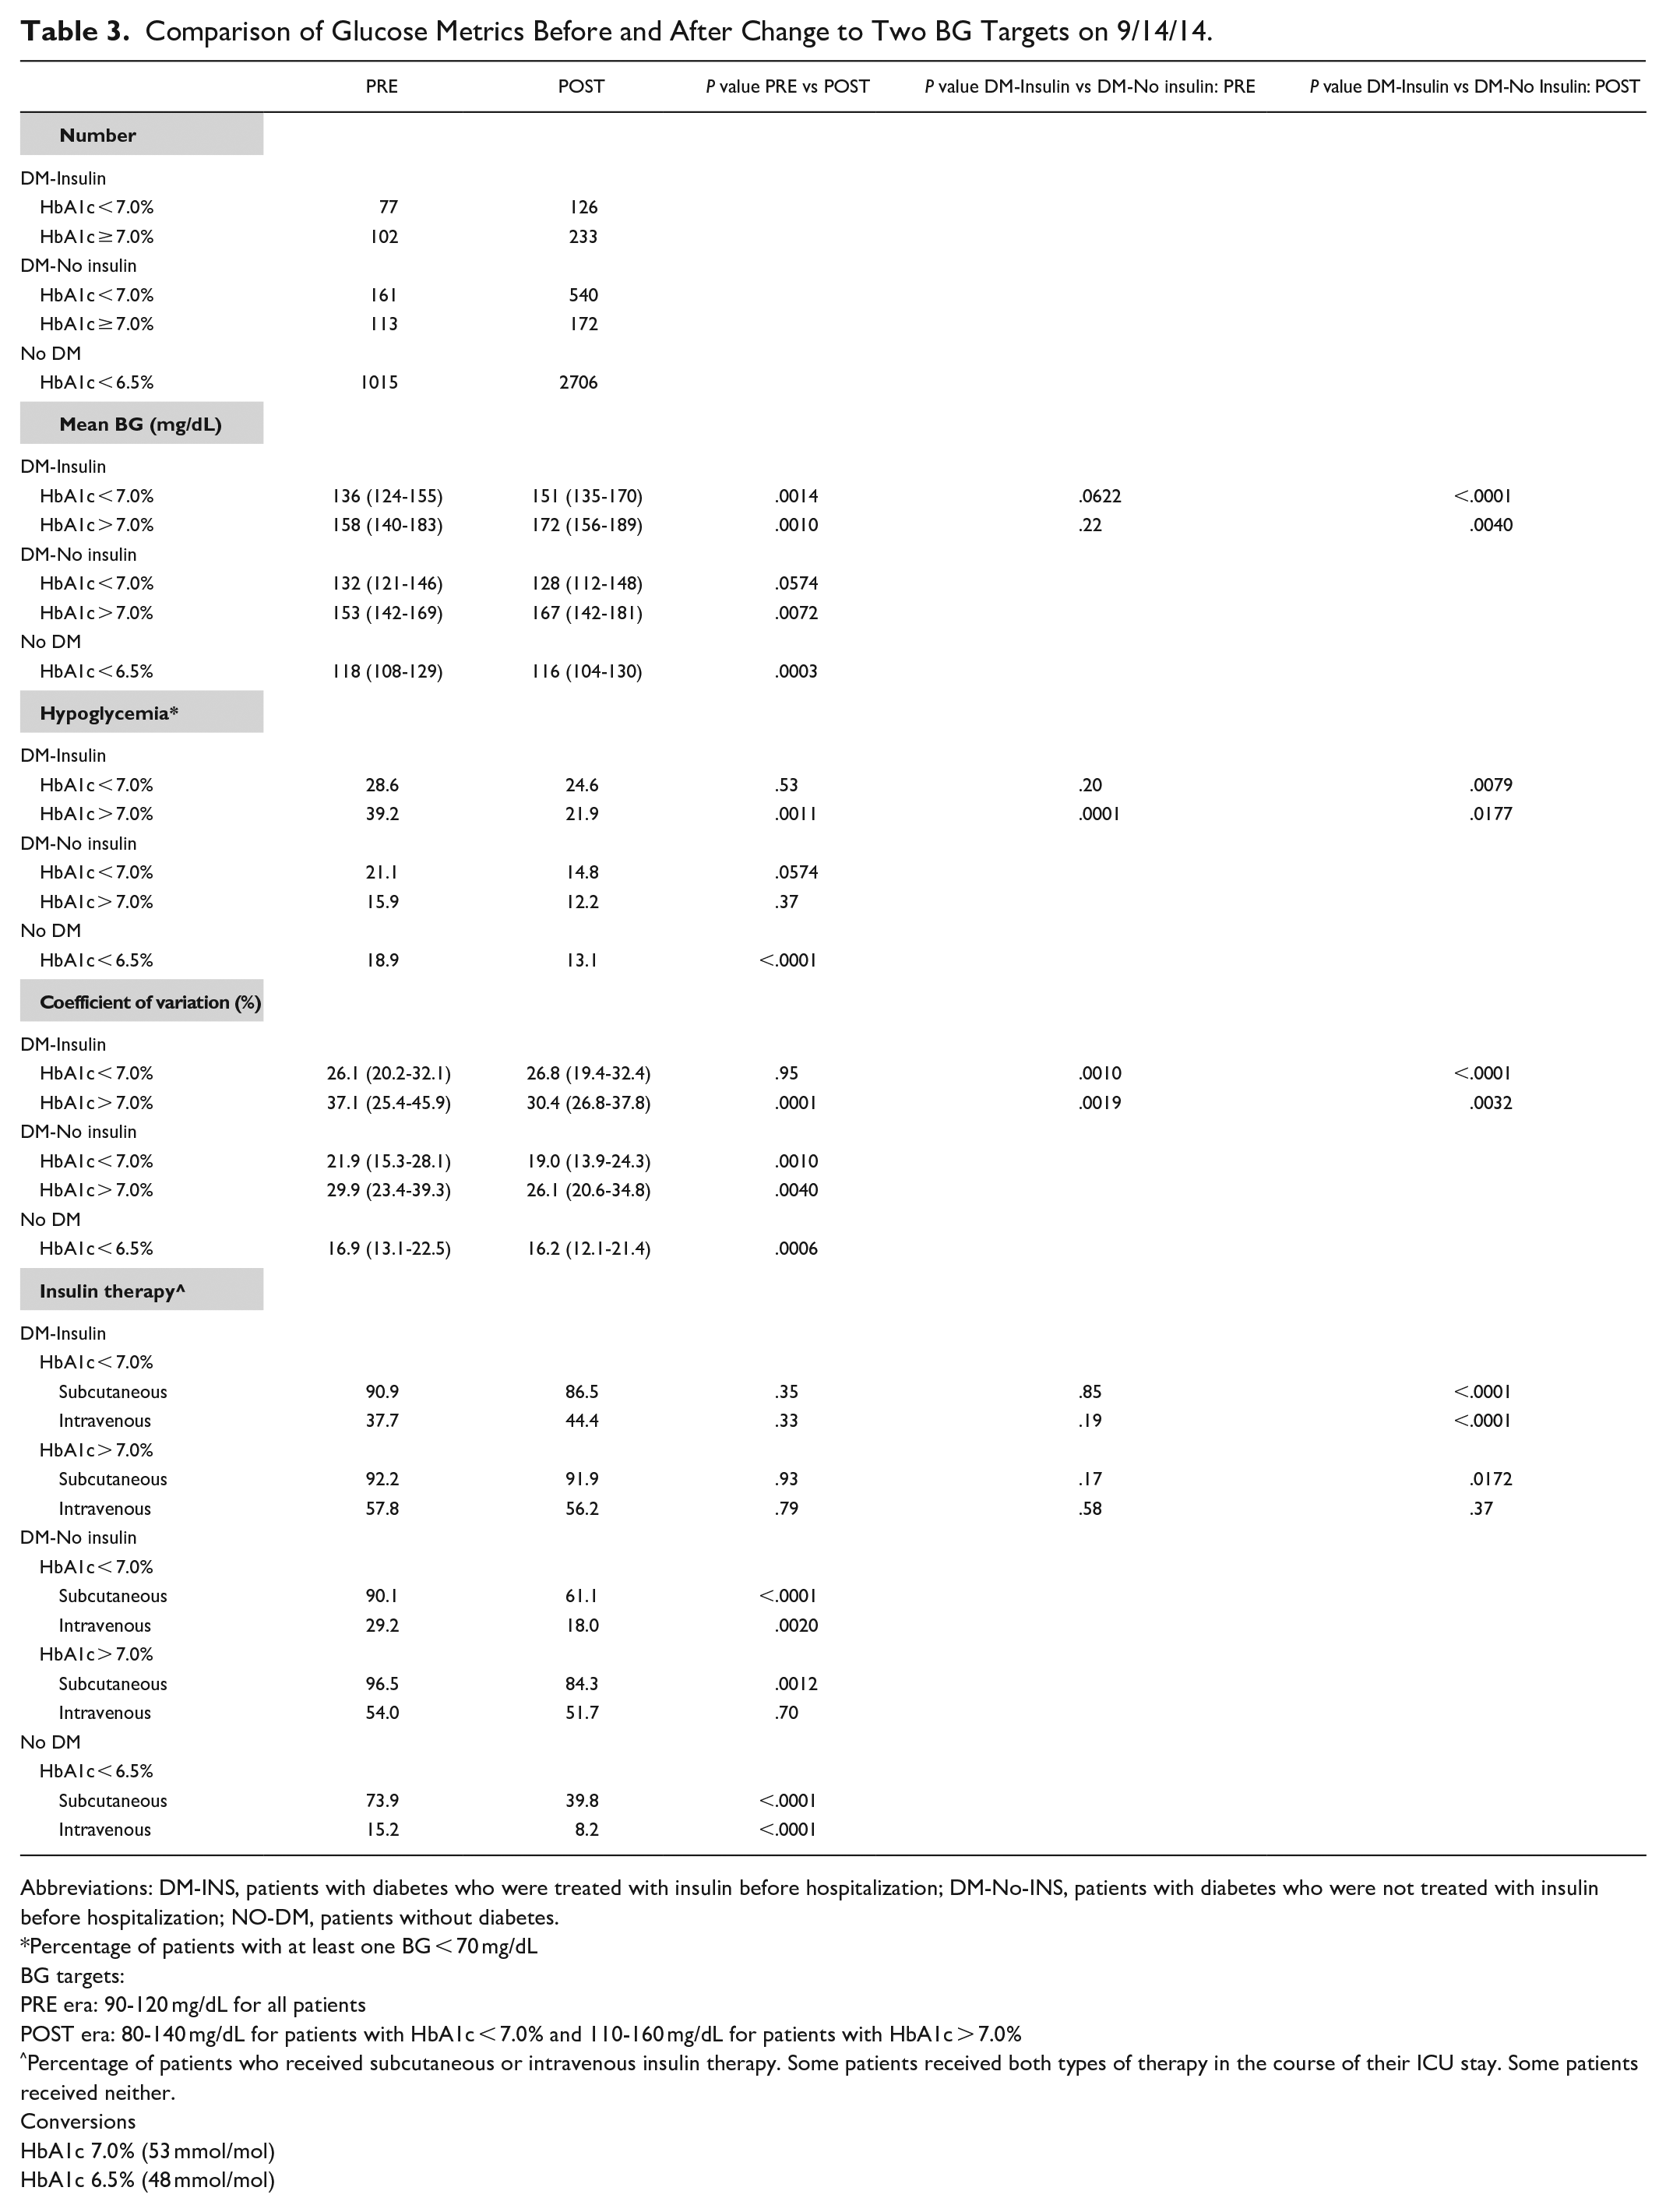
Abbreviations: DM-INS, patients with diabetes who were treated with insulin before hospitalization; DM-No-INS, patients with diabetes who were not treated with insulin before hospitalization; NO-DM, patients without diabetes.
Percentage of patients with at least one BG < 70 mg/dL
BG targets:
PRE era: 90-120 mg/dL for all patients
POST era: 80-140 mg/dL for patients with HbA1c < 7.0% and 110-160 mg/dL for patients with HbA1c > 7.0%
Percentage of patients who received subcutaneous or intravenous insulin therapy. Some patients received both types of therapy in the course of their ICU stay. Some patients received neither.
Conversions
HbA1c 7.0% (53 mmol/mol)
HbA1c 6.5% (48 mmol/mol)
Comparison of Glucose Metrics and Outcome for DM-INS and DM-No-INS
Unadjusted mortality
Figure 2A displays the relationship between mean BG and unadjusted mortality, stratified by HbA1c for DM-INS and DM-No-INS
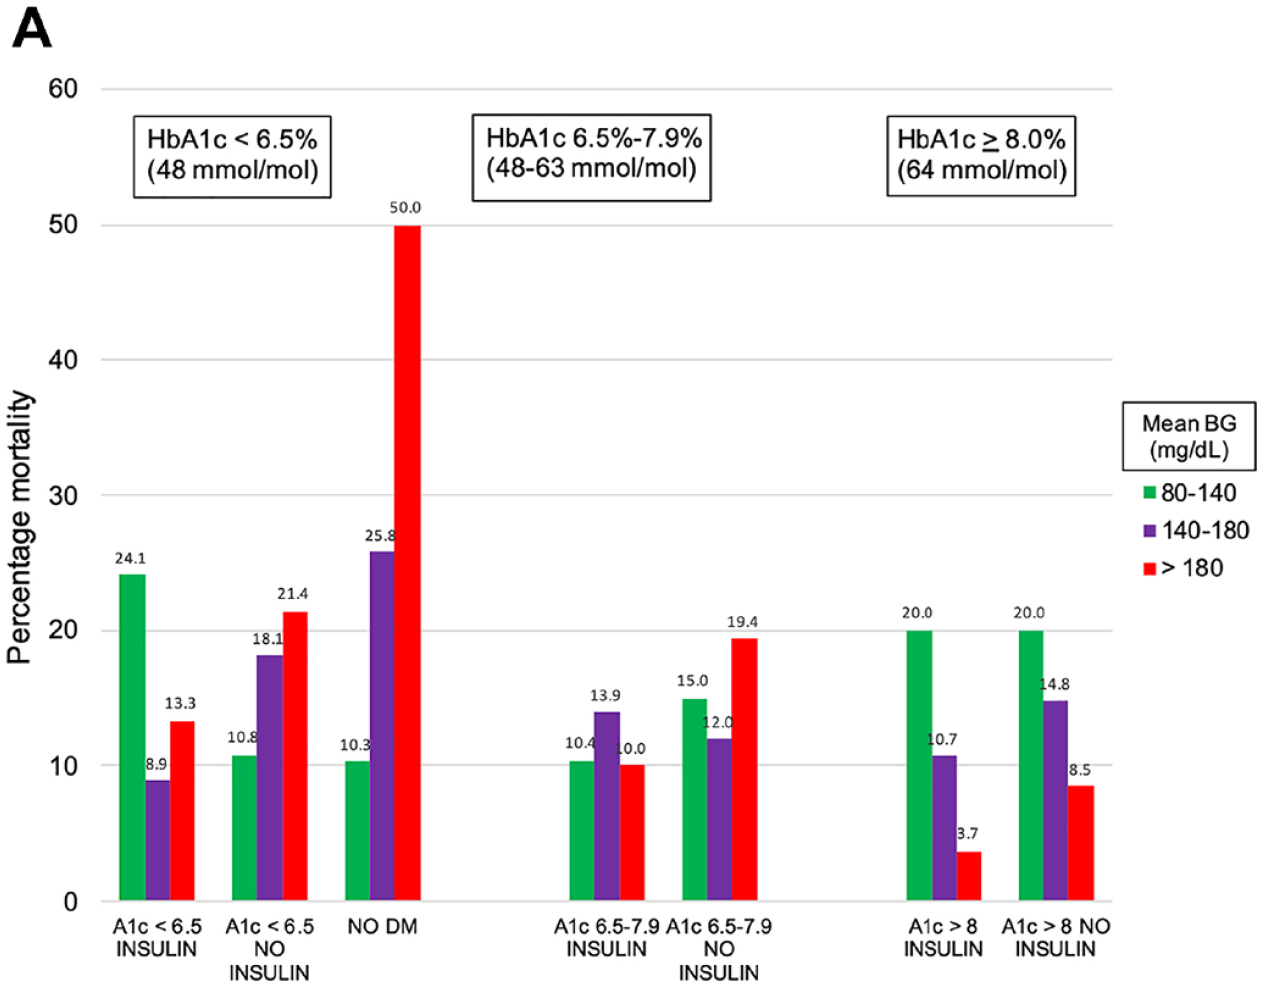
Relationship between mean BG (mg/dL) during ICU admission and mortality, stratified by HbA1c level and preadmission insulin treatment status.
Among patients with HbA1c < 6.5%, mortality decreased with increasing mean BG among DM-INS, but the opposite relationship was observed among DM-No-INS and NON-DM.
Table 4 and Figure 2B reports the relationship between glucose metrics and unadjusted mortality for the subgroups of patients, stratified by the three bands of HbA1c. Among patients with HbA1c < 6.5%, higher CV was associated with lower unadjusted mortality for DM-INS, but higher unadjusted mortality for DM-No-INS. Hypoglycemia was associated with mortality in both groups but had a stronger association among patients with HbA1c < 6.5%.
Observed:Expected Mortality Ratios for Glucose Metrics, Stratified by HbA1c levels
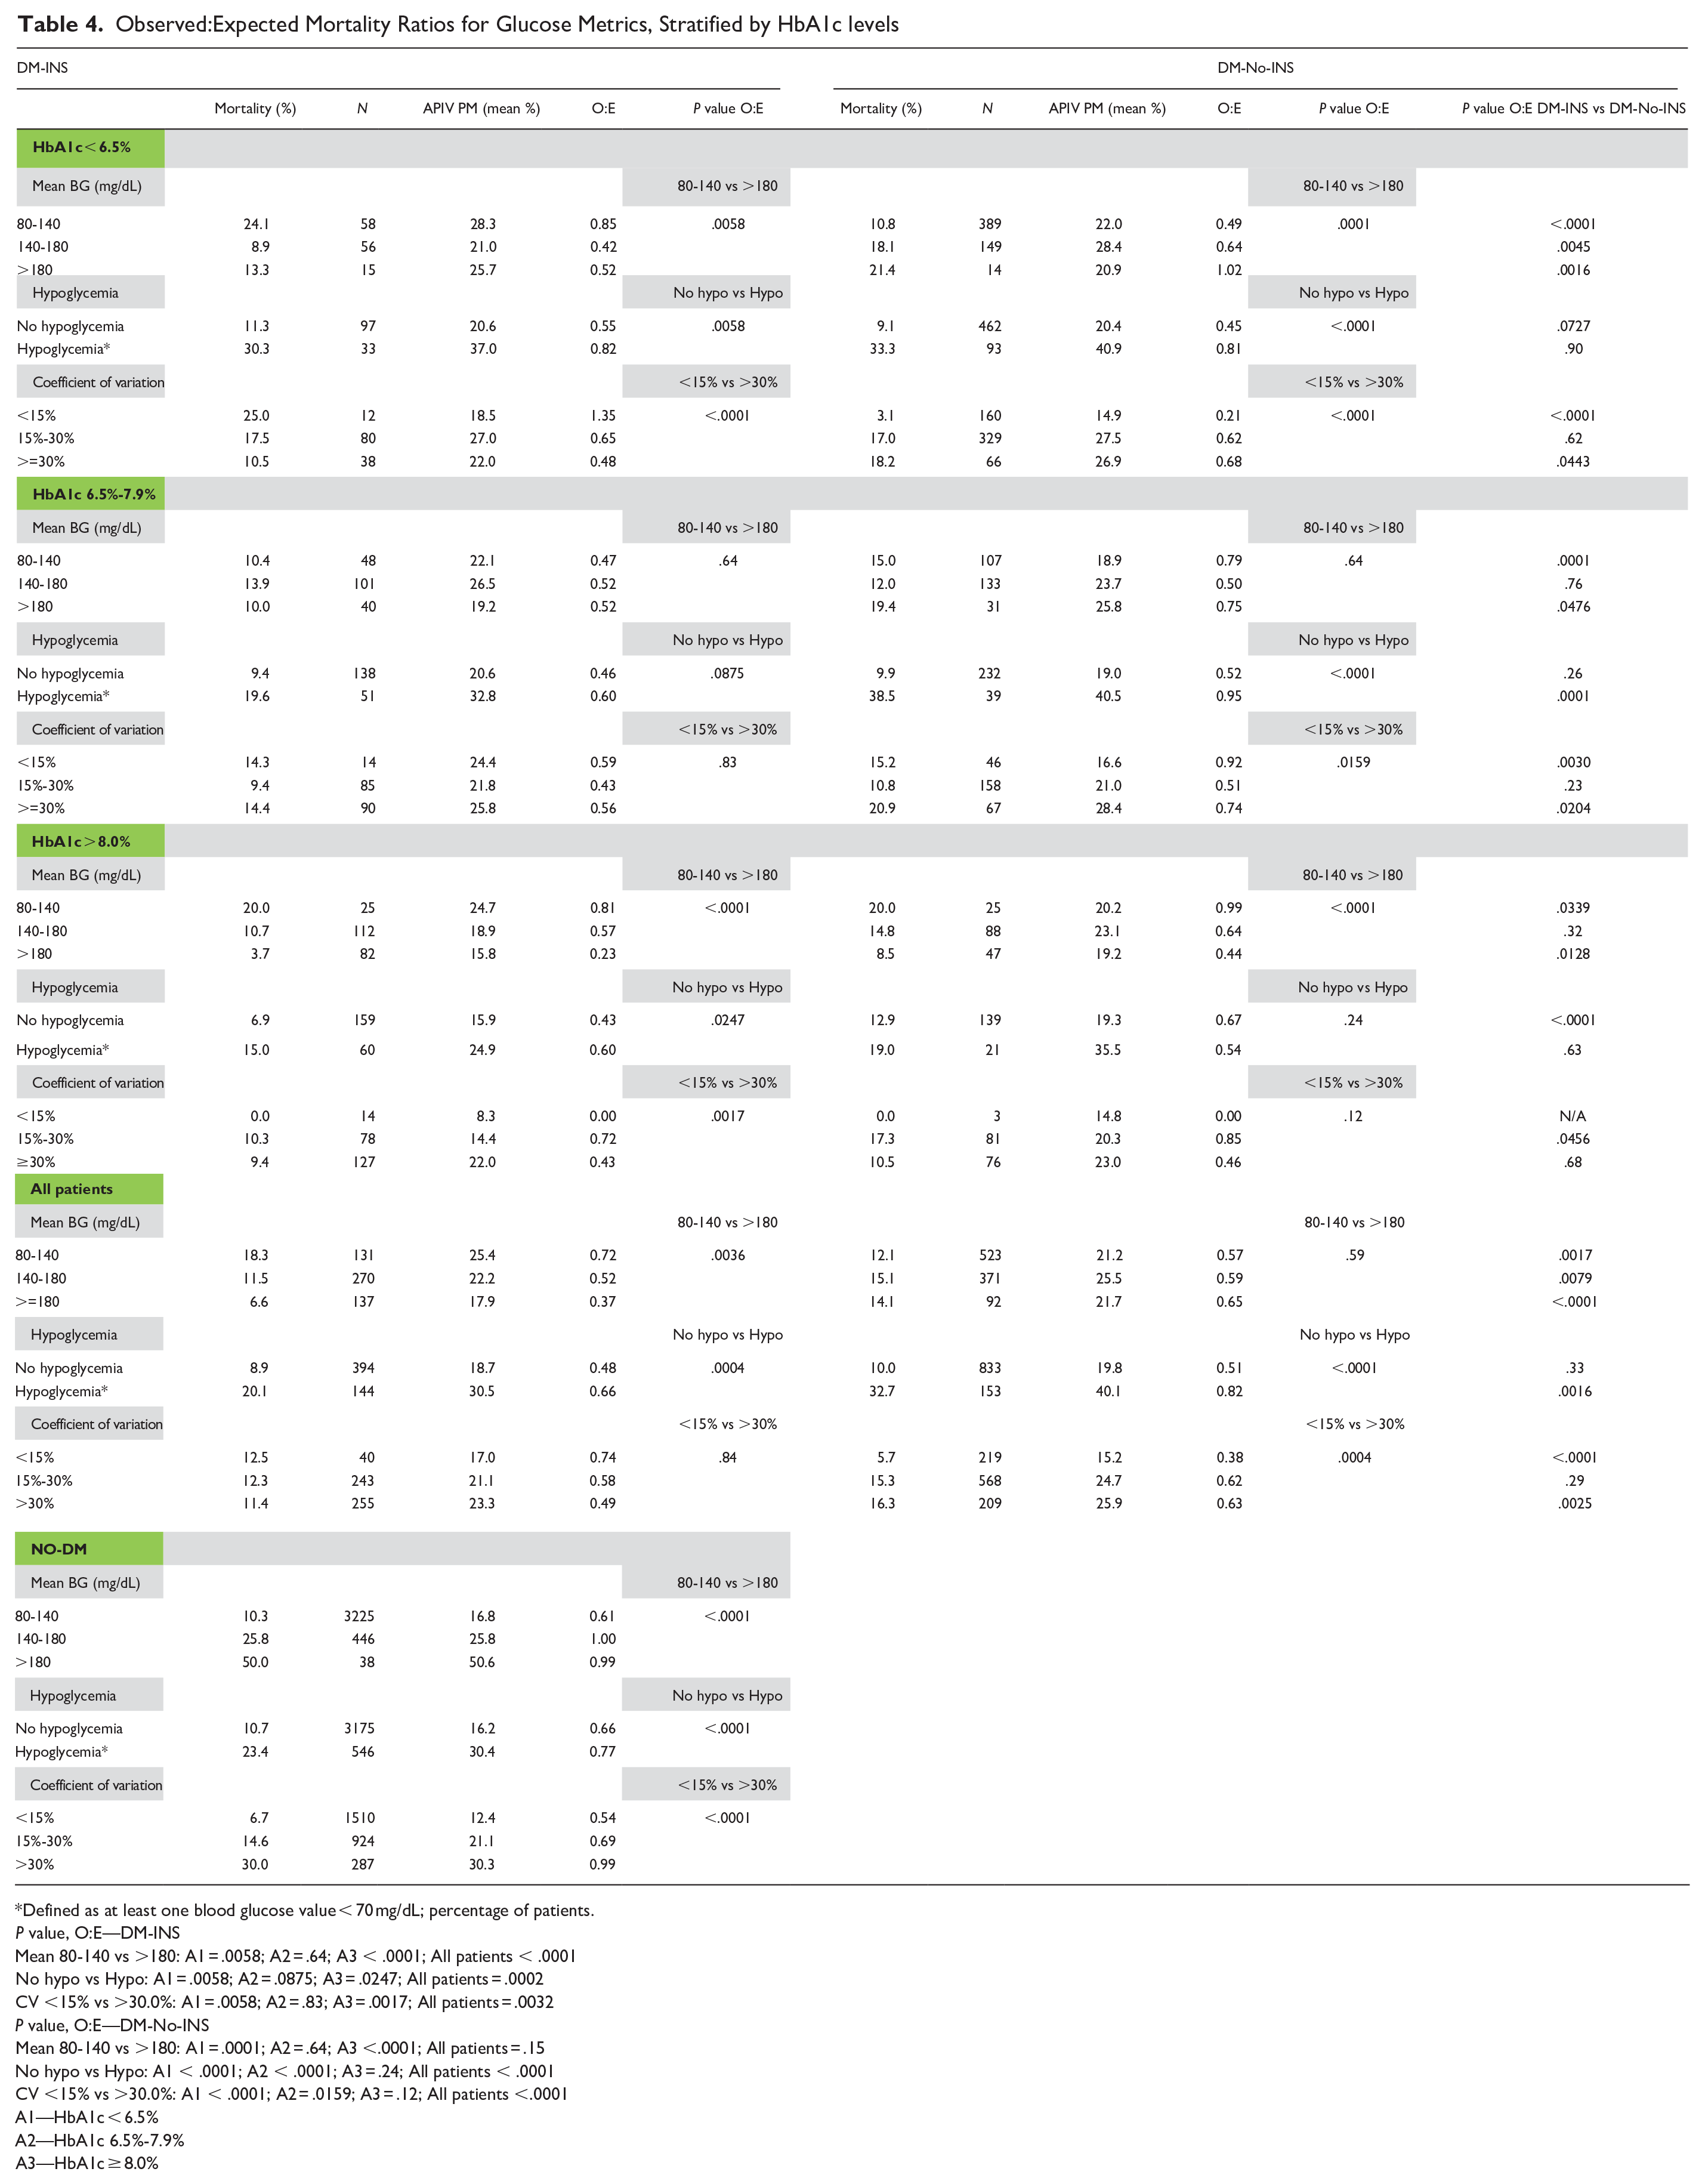
Defined as at least one blood glucose value < 70 mg/dL; percentage of patients.
P value, O:E—DM-INS
Mean 80-140 vs >180: A1 = .0058; A2 = .64; A3 < .0001; All patients < .0001
No hypo vs Hypo: A1 = .0058; A2 = .0875; A3 = .0247; All patients = .0002
CV <15% vs >30.0%: A1 = .0058; A2 = .83; A3 = .0017; All patients = .0032
P value, O:E—DM-No-INS
Mean 80-140 vs >180: A1 = .0001; A2 = .64; A3 <.0001; All patients = .15
No hypo vs Hypo: A1 < .0001; A2 < .0001; A3 = .24; All patients < .0001
CV <15% vs >30.0%: A1 < .0001; A2 = .0159; A3 = .12; All patients <.0001
A1—HbA1c < 6.5%
A2—HbA1c 6.5%-7.9%
A3—HbA1c ≥ 8.0%
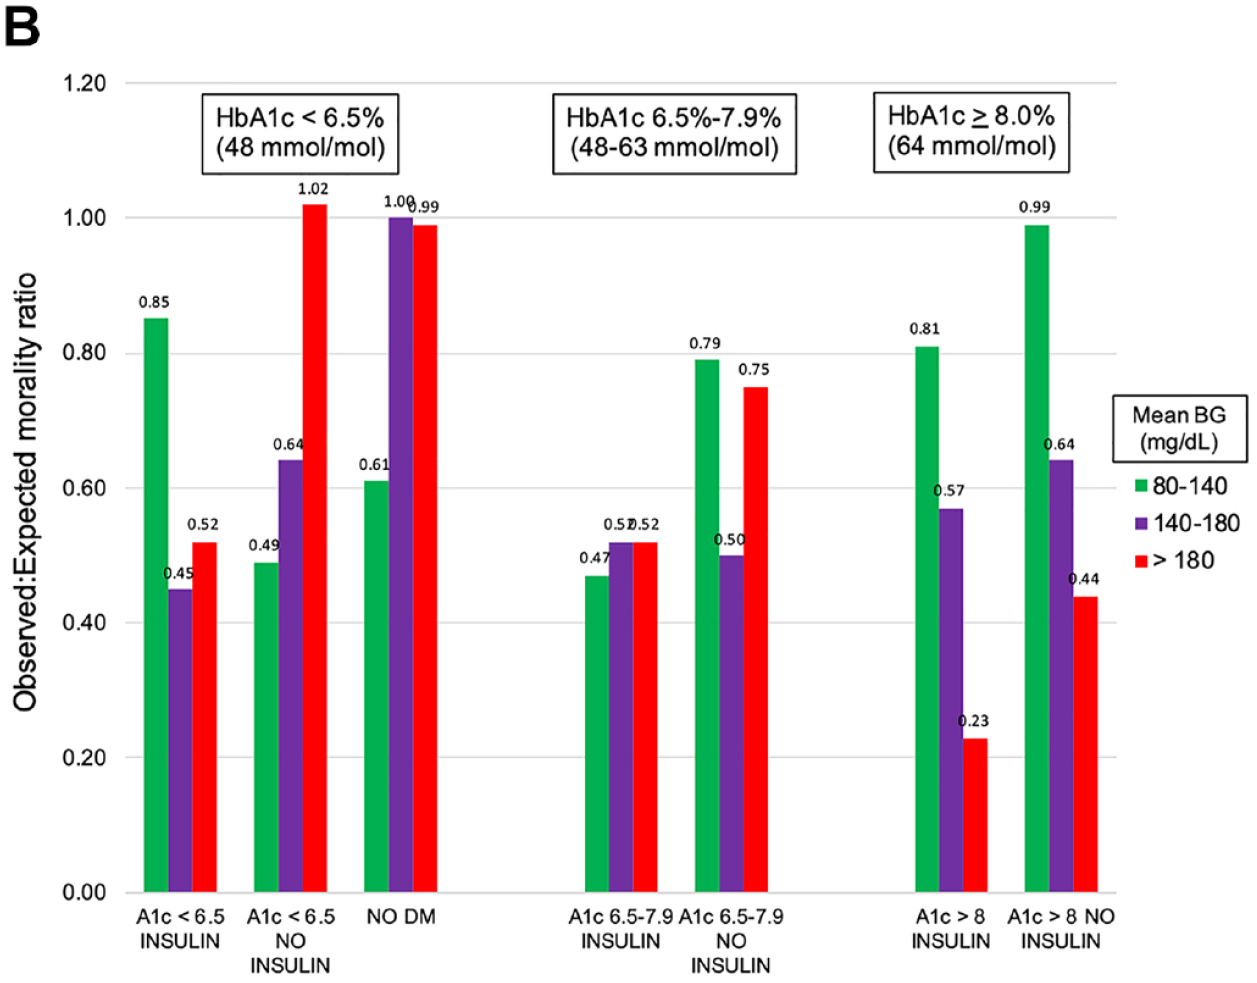
Relationship between mean BG (mg/dL) during ICU admission and observed:expected mortality ratio, stratified by HbA1c level and preadmission insulin treatment status.
Severity-adjusted mortality
Table 4 details the relationship of glucose metrics to severity-adjusted mortality, using O:E mortality ratios.
*Among patients with HbA1c < 6.5%, DM-INS patients with mean BG 80-140 mg/dL had a higher severity-adjusted mortality than did those with mean BG ≥ 180 mg/dL, but the opposite relationship was seen with DM-No-INS. Similar relationships were noted for CV; among DM-INS patients, those with CV < 15% had higher severity-adjusted mortality than did those with CV ≥ 30%, but the opposite relationship was seen with DM-No-INS. Patients with hypoglycemia had higher severity-adjusted mortality in both groups than did those without hypoglycemia.
*Among patients with HbA1c 6.5%-7.9% for both groups of patients, severity-adjusted mortality was similar among patients with mean BG 80-140 mg/dL and ≥180 mg/dL. Among DM-INS, severity-adjusted mortality was similar among those with CV < 15% and ≥ 30%, but among DM-No-INS patients, those with CV ≥ 30% had lower severity-adjusted mortality. There was a stronger association of hypoglycemia with mortality among DM-No-INS than among DM-INS.
*Among patients with HbA1c ≥ 8.0%, for both groups of patients those with mean BG 80-140 mg/dL had higher severity-adjusted mortality than did those with mean BG ≥ 180 mg/dL. The number of patients with CV < 15% was too low to make meaningful statistical comparisons. Severity-adjusted mortality was higher among DM-INS with hypoglycemia but similar among DM-No-INS with hypoglycemia.
Comparison of Glucose Metrics and Outcome for Patients With DM-No-INS and NO-DM
The relationship of glucose metrics to severity-adjusted mortality was similar for NO-DM and those DM-No-INS patients with HbA1c < 6.5%. The NO-DM patients with mean BG 80-140 mg/dL had lower severity-adjusted mortality than did those with mean BG ≥ 180 mg/dL, lower severity-adjusted mortality among those with CV < 15% than with CV ≥ 30%, and higher severity-adjusted mortality among those with hypoglycemia than among those without.
Discussion
Our salient findings include:
* Mean BG, CV but not hypoglycemia during ICU admission increased with increasing HbA1c, and were higher in each case for DM-INS than for DM-No-INS.
* Among patients with HbA1c < 6.5%, mean BG ≥ 180 mg/dL and CV ≥ 30% were associated with lower unadjusted as well as severity-adjusted mortality in DM-INS than were mean BG 80-140 mg/dL and CV < 15%, respectively, but higher unadjusted as well as severity-adjusted mortality among DM-No-INS and NO-DM.
* Among patients with HbA1c ≥ 8.0%, mean BG ≥ 180 mg/dL was associated with lower unadjusted as well as severity-adjusted mortality for both DM-INS and DM-No-INS than was mean BG 80-140 mg/dL.
* The relationship of glucose metrics to unadjusted as well as severity-adjusted mortality was similar for NO-DM and those DM-No-INS patients with A1c < 6.5%.
Relationship to Prior Literature
Previous observational studies evaluating differences in glycemic control in ICU patients with and without diabetes have reported a steep increase in mortality rates as mean BG increases among patients without diabetes but no consistent relation in patients with diabetes.7-10 Data from interventional trials have suggested that the survival benefit of the IIT was limited to patients without DM.15,16,29
The interaction of acute and chronic glycemia has been evaluated in a group of studies that compared admission BG values to chronic glycemia estimated by measurement of HbA1c at or near hospital admission, 18 by calculating their quotient (“stress hyperglycemia ratio”19,20) or their difference (“glycemic gap” 21 ). These provided a very clear signal: increasing deviation of admitting BG from chronic glycemia was strongly associated with increased mortality.
Egi et al extended these findings by studying 415 patients with diabetes admitted to two Australian ICUs and found that for patients with low HbA1c levels on admission, there was a positive association between mean BG during ICU stay and mortality, but that for patients with high HbA1c the opposite was seen—patients with high mean BG during ICU stay had lower mortality rates than did patients with low mean BG. 17 A recently published investigation involving the 5567 patients in the current investigation stratified the patients by bands of HbA1c—<6.5%, 6.5%-7.9%, and ≥8.0%—and confirmed these findings. 22 For patients with HbA1c < 6.5%, increased mean BG during ICU stay was associated with increased mortality, but for patients with HbA1c ≥ 8.0%, higher mean BG during ICU stay was associated with lower mortality. Similar findings were noted for coefficient of variation, the metric reflecting glucose variability.
To our knowledge, this is the first investigation of glucose metrics and their relationship to mortality among a cohort of critically ill patients with diabetes that has stratified the analysis based on preadmission treatment with insulin.
Biologic Plausibility
Chronic tissue exposure to different levels of insulin and glycemia prior to ICU admission likely underlies the different associations between ICU mean BG levels and mortality among the three groups. Glucose entry into most cell types is regulated by the GLUT1 and GLUT4 transport mechanisms. 30 GLUT1 is a facilitated transporter dependent solely on glucose concentration, while GLUT4 is insulin-regulated. In the group with HbA1c < 6.5%, DM-No-INS and NO-DM patients had no reason for the number and function of both transporters to be abnormal, since they had low peripheral insulin concentration and near-normal glucose concentration; higher ICU mean glucose would result in higher intracellular glucose flux, causing glucotoxicity in critical tissues. 31 In contrast, among DM-INS, higher mean glucose levels in the ICU would help maintain normal intracellular glucose metabolism, since the iatrogenic hyperinsulinemia caused by subcutaneous insulin injections causes whole-body insulin resistance.30,32
While increasing glucose variability has been previously demonstrated to be independently associated with risk of mortality in the critically ill, especially among patients without diabetes.4,9,11,33 the influence of preadmission treatment with insulin has not been investigated. Physiologic portal insulin delivery occurs in both NO-DM and DM-No-INS, reducing glucose variability and lowering the risk of hypoglycemia, possibly explaining the similar relationship of CV to mortality among these groups. 32
Among patients with HbA1c ≥ 8.0%, sustained exposure to hyperglycemia prior to critical illness leads to decreased expression and function of both glucose transporters. 32 Increased mitochondrial production of reactive oxygen species impairs insulin-regulated GLUT4 translocation and causes insulin resistance in both muscle cells and adipocytes. 34 Consequently, while mean BG between 80-140 mg/dL during ICU stay in both DM-INS and DM-No-INS groups may overcome defective GLUT1 glucose transport, impaired GLUT4 translocation would lead to reduced intracellular glucose flux. In addition, sustained hyperglycemia prior to critical illness among patients with diabetes may induce a new “set point,” in which rapid exposure to more normal glucose concentrations causes tissue pathology. One example is the well-documented association of rapid reduction in BG levels with early diabetic retinopathy. 35 This is consistent with the emerging importance of findings regarding acute decreases in relative glycemia for hospitalized patients in critical care. 36
Strengths and Limitations
The strengths of this investigation include its large cohort that includes a broad array of medical and surgical critically ill patients, increasing its external validity. The prospectively collected comprehensive database allows detailed analysis of glucose metrics as well as robust adjustment for clinical factors that may impact outcome. Moreover, the center has a long history of interest in and experience with glucose control, including the use of protocols mandating a higher frequency of BG monitoring than many ICUs. 9
We acknowledge several limitations.
*Accuracy of HbA1c as a representation of recent glycemia may be confounded by a number of factors, including but not limited to race, hemoglobin level and hematologic, mechanical heart valves, and hypothyroidism.37,38
*While the current cohort includes a wide variety of medical and surgical patients, a strength, it does not include cardiovascular surgery patients, due to their very low mortality, and the study was conducted in a single center, reducing its generalizability.
*Most of the BG testing was performed using point of care glucose meters; this technology has been associated with analytic inaccuracies compared to the use of central lab chemistry analyzers. 39
*We do not have data on nutritional support, a critical factor impacting glucose control, or the quantity of insulin received by the patients during ICU stay, precluding analysis of insulin resistance.
*There is a possibility of selection bias as the investigation excluded patients without available HbA1c measurement. However, while DM patients were likely underrepresented in this group, this still represents only 23% of the patients (1665/7232), so it is unlikely to be a significant factor.
*The investigation spanned a period of eight years and included a change in the glucose control regimen, from one BG target to two. However, we have previously reported that there was no overall change in severity-adjusted mortality overall when comparing the two periods of time. 22
*The large number of subgroups analyzed limited statistical analysis and inferences.
*The final limitation regards the study’s design; these data are observational, with the risk of residual confounding, and therefore can only be considered hypothesis generating.
Clinical Implications and Future Directions
We believe these findings may have been a confounding factor in the design, performance, and interpretation of the RCTs of IIT. In addition, they have significant clinical implications regarding the choice of an appropriate BG target for critically ill patients, especially for those with well-controlled glycemia, reflected by HbA1c < 6.5% in this cohort. Notably, current guidelines published by the American Diabetes Association recommend a BG target of 140-180 mg/dL for all critically ill patients. 40 Future investigations of glucose control in acutely and critically ill patients—observational cohort studies as well as randomized trials of insulin therapy—should include both an evaluation of longer-term preadmission glycemia and a determination of preadmission treatment of the diabetes cohort.
In conclusion, these data demonstrate that the relationship of ICU glucose control and glucose metrics to mortality differed significantly when comparing patients with diabetes with or without prior insulin treatment, adding further support for the concept of a personalized approach to glucose control in the critically ill. To further clarify these findings, a treat-to-target prospective trial accounting for HbA1c and home insulin therapy is needed.
Supplemental Material
sj-pdf-1-dst-10.1177_19322968211032277 – Supplemental material for Acute and Chronic Glucose Control in Critically Ill Patients With Diabetes: The Impact of Prior Insulin Treatment
Supplemental material, sj-pdf-1-dst-10.1177_19322968211032277 for Acute and Chronic Glucose Control in Critically Ill Patients With Diabetes: The Impact of Prior Insulin Treatment by James S. Krinsley, Peter Rule, Michael Brownlee, Gregory Roberts, Jean-Charles Preiser, Sherose Chaudry, Krista Dionne, Camilla Heluey-Rodrigues, Guillermo E. Umpierrez and Irl B. Hirsch in Journal of Diabetes Science and Technology
Footnotes
Acknowledgements
JK drafted the manuscript and wrote subsequent revisions, performed statistical analysis and abstracted data from the ICU’s historical and Phoenix database. JK vouches for the integrity of the data. PR, MB, GR, JCP, GU, and IH participated in revisions of the manuscript and contributed critical intellectual content. SC, KD, and CHR abstracted data from the hospital’s electronic medical record. All authors read and approved the final submitted manuscript.
Abbreviations
APIV PM, APACHE IV predicted mortality; BG, blood glucose; CV, coefficient of variation; DM, diabetes mellitus; HbA1c, hemoglobin A1c; ICU, intensive care unit; IQR, interquartile range; INS, insulin; LOS, length of stay; RCT, randomized controlled trial; SD, standard deviation.
Declaration of Conflicting Interests
The author(s) declared the following potential conflicts of interest with respect to the research, authorship, and/or publication of this article: We do not believe that this is relevant, but in the interest of transparency, James Krinsley and Jean-Charles Preiser have each served on advisory boards or been consultants in the last five years for the following companies, involved in the field of glucose monitoring technology: Edwards Life Sciences Medtronic Roche Diagnostics OptiScan Biomedical Neither author has had any relationship with these companies in the last two years. The other authors report no relevant conflicts.
Funding
The author(s) received no financial support for the research, authorship, and/or publication of this article.
Supplemental Material
Supplemental material for this article is available online.
References
Supplementary Material
Please find the following supplemental material available below.
For Open Access articles published under a Creative Commons License, all supplemental material carries the same license as the article it is associated with.
For non-Open Access articles published, all supplemental material carries a non-exclusive license, and permission requests for re-use of supplemental material or any part of supplemental material shall be sent directly to the copyright owner as specified in the copyright notice associated with the article.