
Abstract
Background:
There is a clear need to transition from batch-level to vial/syringe/pen-level quality control of biologic drugs, such as insulin. This could be achieved only by noninvasive and quantitative inspection technologies that maintain the integrity of the drug product.
Methods:
Four insulin products for patient self-injection presented as prefilled pens have been noninvasively and quantitatively inspected using the water proton NMR technology. The inspection output is the water proton relaxation rate R2(1H2O), a continuous numerical variable rather than binary pass/fail.
Results:
Ten pens of each product were inspected. R2(1H2O) displays insignificant variation among the 10 pens of each product, suggesting good insulin content uniformity in the inspected pens. It is also shown that transferring the insulin solution out of and then back into the insulin pen caused significant change in R2(1H2O), presumably due to exposure to O2 in air.
Conclusions:
Water proton NMR can noninvasively and quantitatively inspect insulin pens. wNMR can confirm product content uniformity, but not absolute content. Its sensitivity to sample transferring provides a way to detect drug product tampering. This opens the possibility of inspecting every pen/vial/syringe by manufacturers and end-users.
Introduction
Noninvasive Inspection and its Potential Applications
In this paper, we describe an innovative technique—water proton NMR (wNMR)—for noninvasive and quantitative inspection of insulin products. Existing drug product inspection techniques are either invasive (eg, mass spectrometry) or qualitative (eg, human visual inspection).
By noninvasive, we mean that an insulin product is inspected as is, without taking the solution or suspension out of the primary container (pen, vial, prefilled syringe, etc.). The inspection maintains the integrity of the drug product. After inspection, the product can still be used if no aberration is detected. By quantitative, we mean the inspection output is a continuous numeric parameter, rather than a binary pass or fail, as in visual inspection. A continuous numeric parameter is more informative about product quality than pass/fail.
Noninvasive and quantitative inspection technologies, such as wNMR, have many potential applications for insulin products, and biologics in general. Below are a few examples.
Detection of pre-release product defects caused by manufacturing errors
Current quality control (QC) practice is that a fraction of the vials/pens/syringes in a batch of a finished drug product is subjected to quantitative but destructive analysis, a process called statistical sampling. Such sampling is probabilistic by nature and may miss rare but serious product defects caused by errors occurred in fill-finish unit operations, the last step of the manufacturing process of the drug product. One example is wrong insulin dose level, off by up to ±50%, in Novomix®30 pens, caused by filling errors. 1 0.14% of the 3.3 million recalled Novomix®30 pens/cartridges, spreading over 33 batches, contained wrong insulin dose. To catch 0.14% error through statistical sampling, one needs to destructively analyze ca. 40,000 out of 100,000 pens per batch in order to reach a confidence level of 90%. 2 This is unrealistic. With noninvasive analytical technologies like wNMR, the manufacturer will have the option to quantitatively inspect every pen/vial/syringe in a batch. Such 100% quantitative inspection can reduce the probability of releasing defective insulin products.
Detection of post-release product defects caused by delivery mishandling
Insulin products, like other biologic products, require the cold chain (2°C-8°C) for delivery. Strict adherence to the cold chain is very challenging even for professional vaccine distributors 3 and becomes much more so for individual patients. A recent study found that many patients with diabetes expose their insulin products to inappropriate temperatures. 4 For a comprehensive appraisal of insulin storage conditions and potential vulnerabilities, see a recent review by Heinemann and coworkers. 5 Product mishandling, such as cold chain breaches, may damage the product. If the damage is not visually obvious, such as protein degradation, then it cannot be detected by the end-user, whose only QC capability currently is visual inspection. A quantitative inspection before injection may detect damaged products, whether the damage is visually obvious or not, and alert the patient or the care provider. Such point-of-care QC measures may reduce adverse drug events associated with insulin and other biologic products.
Determination of in-use insulin products expiry date
After a patient starts using a multi-dose insulin vial or pen, that product, called an in-use product, may be kept at room temperature for n days, as specified in the product package insert. N is also referred as the utilization period of a product. 6 But for the same product, n varies between jurisdictions and presentation formats. For example, for Novolin 70/30 presented in vials, nis 28 days in the United States but 42 days in the E.U.; for Novolin 70/30 presented in prefilled syringes and cartridges, n is 10 days in the United States but 42 days in the E.U. 7 Such variations indicate an element of arbitrariness in setting the utilization period of in-use insulin products. In any event, even a universally adopted utilization period of in-use insulin products might not serve all patients with diabetes because of likely significant variability of the real-world in-use conditions of insulin products. It is conceivable that due to variability of these real-world conditions some in-use products may have significantly changed before the end of the utilization period but are nonetheless injected, a situation that may cause harm. While other in-use products may have hardly changed at the end of the utilization period but are nonetheless discarded, a situation that leads to waste. In the real-world, many patients, 72% in one study 8 and 81% in another, 9 use their insulin products beyond the utilization period for various reasons. It might be advisable to replace the utilization period, which bears no direct relationship to in-use product quality, by tolerable extent of change (TEC), which specifies the maximum quantitative extent of quality change of an in-use product that is acceptable. TEC could be established by the product manufacturer using wNMR and validated by orthogonal invasive analytical techniques. Before injection, the actual extent of change (AEC) of a given in-use pen/vial/syringe would be measured by wNMR to enable the following decision: if AEC> TEC, discard, if AEC≤ TEC, inject. Here, both TEC and AEC are continuous numeric parameters measured by wNMR. This is an individualized approach to in-use insulin product expiry that takes real-world conditions into account.
Manufacturing control of innovator vs. follow-on insulin products
Biologics are complex, such that the exact copy of an innovator biologic product cannot be made at the present time; only highly similar products, called biosimilars, are possible. To demonstrate similarity between innovator and biosimilars, comparative analytical assessment is critical. The FDA draft guidance on this topic stipulates that “Whenever possible, if the finished drug product is best suited for a particular analysis, the sponsors should analyze the finished drug product”. 10 The ability to quantitatively inspect a finished drug product as is can greatly facilitate such comparison. For example, when data are collected on every vial in a batch, then product variability, both intra- and inter-batches, can be assessed more accurately compared to statistical sampling, which collects data on only a fraction of the vials in a batch. Product variability data may be used to compare how tightly the manufacturing processesare controlled for innovators and biosimilars respectively.
Detection of counterfeit products
As on-line ordering of insulin products, sometimes crossing national boundaries, becomes more common, the probability of counterfeits increases. Customs and health authorities may not be able to catch every counterfeit, especially if counterfeits are blended with authentic ones. A quantitative inspection of every vial before injection by the patient or care provider may help to catch counterfeit products.
Water proton NMR (wNMR) as a noninvasive inspection technology
The aforementioned applications require analytical technologies that cannon invasively and quantitatively inspect every insulin vial/pen/syringe. In addition to being noninvasive and quantitative, the analytical technologies also need to be fast, simple and affordable. wNMR has the potential to meet these requirements.
In wNMR, the NMR signal source is water protons (each H2O molecule has 2 protons). The motivation for using water rather than insulin as the NMR signal source is because the water concentration is much higher than that of insulin. In NMR spectroscopy, the signal intensity is proportional to the concentration of the signal source. In typical insulin products, the water concentration is ~56 M. In contrast, the insulin concentration is ~0.6 × 10⁻³ M. Hence water is~100,000 times more concentrated than insulin. The water proton NMR signal is very intense and can be readily detected using inexpensive bench top or handheld NMR instruments. In comparison, conventional NMR techniques that detect proton signals from the insulin using NMR spectrometers are invasive and require the insulin solution to be transferred from the pen/vial into NMR tubes and be mixed with D2O for analysis. 11 The advantage of these NMR techniques, based on the insulin proton signals, is that it can provide more chemical details, such as possible detection of chemical degradation.
One might ask why the water proton NMR signal is informative about insulin. This is because water, the solvent, is in extensive interaction with insulin, the solute. Examples of such interactions include exchange of labile protons between water and insulin, and diffusion of insulin-bound water molecules followed by proton exchange with bulk water molecules. Through such exchange interactions, the water NMR signal becomes sensitive to the physicochemical properties of insulin, which forms the basis for assessing insulin product quality through wNMR. Of the various 1H2O NMR parameters, the most sensitive one is the water proton transverse relaxation rate, R2(1H2O). 12
wNMR does not require the sample to be optically transparent (similar to medical MRI). This feature allows wNMR to inspect an insulin pen as is, without transferring the content inside a non-transparent pen into an optically transparent tube or cuvette, as is the case with UV, florescent, light scattering and other optical spectroscopic techniques.
We have applied wNMR to a variety of systems, including biomaterials,13,14 surfactants, 15 small molecules, 16 nanoparticles, 17 dendrimers,12,18 insulin,2,19 proteins,15,20,21 monoclonal antibodies,22,23 vaccine adjuvants24,25 and vaccines. 26 We also discussed applications of wNMR in the development,27,28 inspection, 29 and distribution 30 of drugs and vaccines. Some of the published work are on marketed biologic products, such as insulin (FlexPen®) 2 and vaccines (Daptacel®, Engerix-B®, VAQTA®). 26
There are other analytical techniques, such as various versions of Raman and infrared spectroscopy, that may perform noninvasive data collection to some extent. However, we are not aware of techniques that can collect data on plastic insulin pens.
Limitations of noninvasive inspection
Protein aggregation and/or degradation that result from intermolecular driving forces—electrostatic and hydrophobic interactions, van der Waals forces and hydrogen bonding—impact the quality, safety, and efficacy of biopharmaceuticals. 31 Several approaches to describe the kinetics and thermodynamics of protein aggregation have been explored based on the results of plurality of direct and indirect experimental methods used to analyze protein aggregation. 32 An overwhelming majority of these methods require sample transfer to a specialized cuvette, dilution, and so on, that is, sample manipulations which compromise the integrity of a sealed drug container. This drawback could be circumvented by using noninvasive analytical techniques, such as wNMR, where the sample can be analyzed in its original container. However, noninvasive techniques have their limitations. Typically, more detailed structural and chemical information is provided by invasive techniques. There are trade-offs to both invasive and noninvasive approaches.
The primary limitation of noninvasive inspection is a lack of chemical details and specificity. For example, while wNMR data can verify product uniformity, it cannot verify the absolute insulin content. When aberrations are detected, wNMR data cannot specify the underlying chemistry. Specifically, for insulin pens, ifwNMR detects abnormal R2(1H2O) value of a pen, based on the R2(1H2O) value alone, one cannot specify whether the aberration is caused by insulin dose deviation, insulin aggregation, insulin misfolding, or insulin chemical degradation. These specific scenarios need to be clarified by invasive analytical techniques; the compendial HPLC method or biopotency method for insulin dose;33,34 size exclusion chromatography, dynamic light scattering and microflow imaging for insulin aggregates,19,35 small-angle X-ray scattering, X-ray absorption and transmission electron microscopy for insulin fibrillation, 36 Raman and FT-IR spectroscopy for insulin misfolding and total quantification, 37,38 and LC-MS for insulin chemical degradation. 39
From the quality control standpoint, noninvasive analytical techniques, like wNMR, are best implemented at the drug product (DP) level while invasive analyses are best implemented at the drug substance (DS) level.
Scope of this work
In this paper, we introduce wNMR to the diabetes community. We demonstrate how to inspect insulin products with wNMR. This is done using 4 insulin products, Lantus®, Basaglar®, Humalog® and Admelog®,using a benchtop NMR instrument.
Note that Lantus® and Humalog® are innovator products while Basaglar® and Admelog® are their respective follow-on products.
To determine whether invasive procedures perturb the sample and whether wNMR can detect such change, the 4 insulin products were inspected both noninvasively, with the insulin solution sitting inside the pen, and invasively, with the insulin solution transferred from the pen to a glass vial and then back to the pen. The data show that even the simple procedure of sample transfer can be detected by wNMR, presumably because wNMR is sensitive to O2, which is paramagnetic. Techniques that are insensitive to O2, such as FT-IR that is equally efficient for liquid and dry-film preparations,38,40 might not have detected that the insulin pen solution has experienced being transferred out of and then back into the pen. This sensitivity to O2 is useful in detecting drug product tampering.
Materials and Methods
Insulin Products
Four insulin products, Lantus®, Basaglar®, Humalog®, and Admelog®, were purchased throughthe University of Maryland School of Pharmacy. Ten pens of each product were purchased and labelled as pen #1 to pen #10.
Each pen contains 3 mL clear solution inside a plastic cartridge, which is housed inside a nontransparent plastic shell. The cap of the pen is detachable. Figure 1 shows a photo of the 4 products, each with the cap on and off.
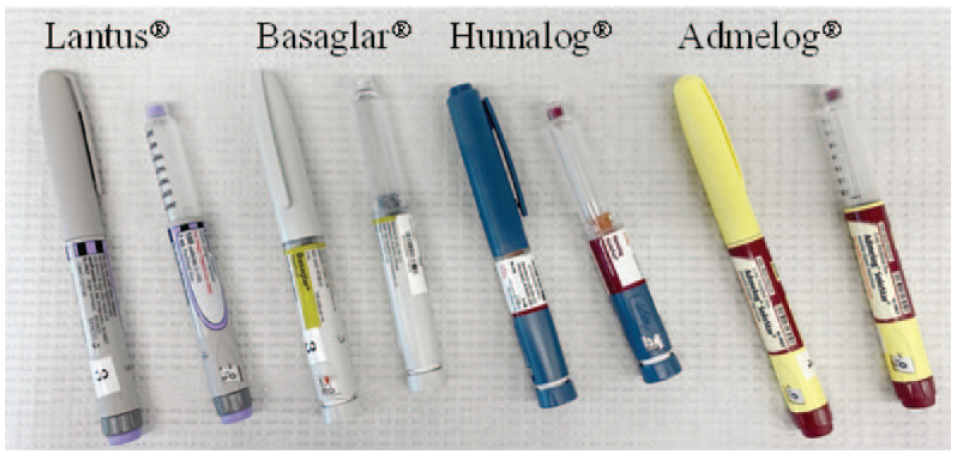
Photo of 4 insulin products included in this study. Each product is shown with the pen cap on (left) and off (right).
Lantus® and Basaglar® contain the long-acting insulin glargine (M.W. = 6,063 Da) at 100 units/mL, equivalent to 3.6378 mg/mL (0.6 mM).Humalog® and Admelog® contain the fast-acting insulin lispro (M.W. = 5,808 Da) at 100 units/mL, equivalent to 3.5 mg/mL (0.6 mM).
Benchtop NMR Instrument
A benchtop NMR analyzer with variable temperature control, SpinTrack VT-NMR (0.52 T, 22.4 MHz for 1H, Resonance Systems GmbH, Kirchheim/Teck, Germany), was used for insulin pen inspection. Built-in Relax 8 spectrometer software was used for the instrument control and data collection. Temperature control of the VT-NMR was provided by a dry air flow from the AirJet XR902 cooling system (SP Scientific, Gardiner, NY),which was stabilized and adjusted by the temperature controller of the VT-NMR instrument. The temperature of the air flow from the cooling system was set to-10°C. The magnet temperature was set to 22°C; the temperature inside the probe cavity, which houses the insulin during inspection, was set to 5°C and was stabilized by the temperature controller of the VT-NMR instrument within the range of 4–5°C. VT-NMR and the cooling system were housed in a room with the ambient temperature stabilized at 18-19°C. Figure 2 shows the instrument setup.
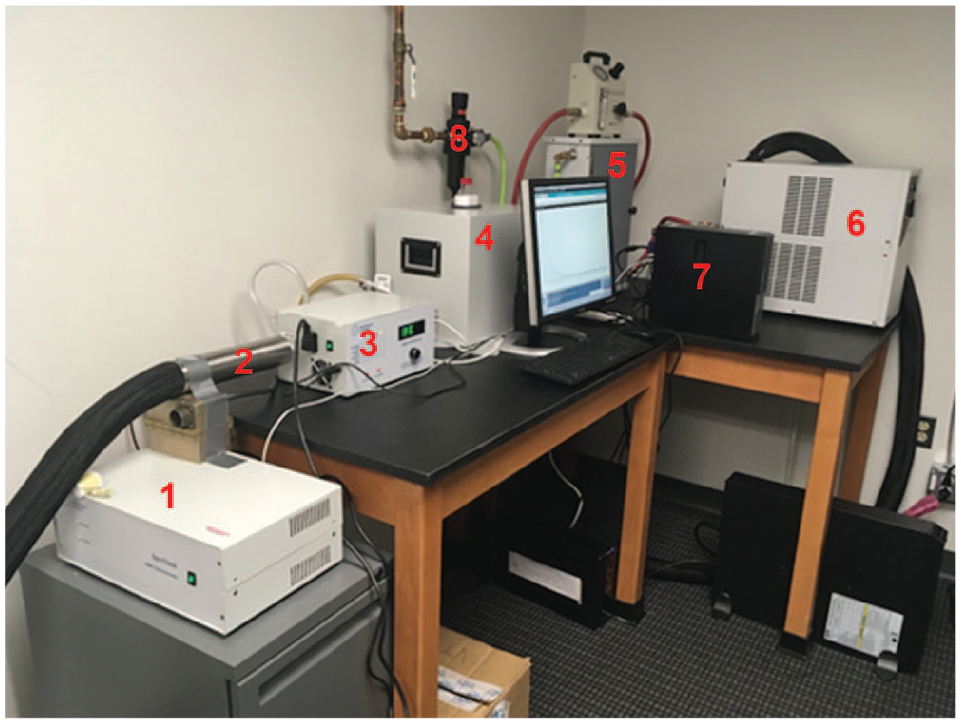
Variable temperature NMR (VT-NMR) system: (1) spectrometer console; (2) cooling air input; (3) temperature controller; (4) NMR magnet; (5) air dryer and flow regulator; (6) air cooler; (7) instrument control, and data collection PC; (8) compressed air line.
Before and after inspection by the benchtop NMR, the insulin pens were stored in a refrigerator atca. 5°C.
Noninvasive Inspection of 4 Insulin Products
For noninvasive inspection, the insulin pen was taken from the 5°C refrigerator and put inside a flat-bottom glass NMR tube (OD 26 mm, ID 24 mm). The glass tube was then inserted into the VT-NMR cavity, and data collection started after 5 min.of the equilibration of the sample to the NMR probe temperature of 5°C. Inspection was performed with the cap on and cap off (Figure 3).All 10 pens of each product were measured noninvasively.
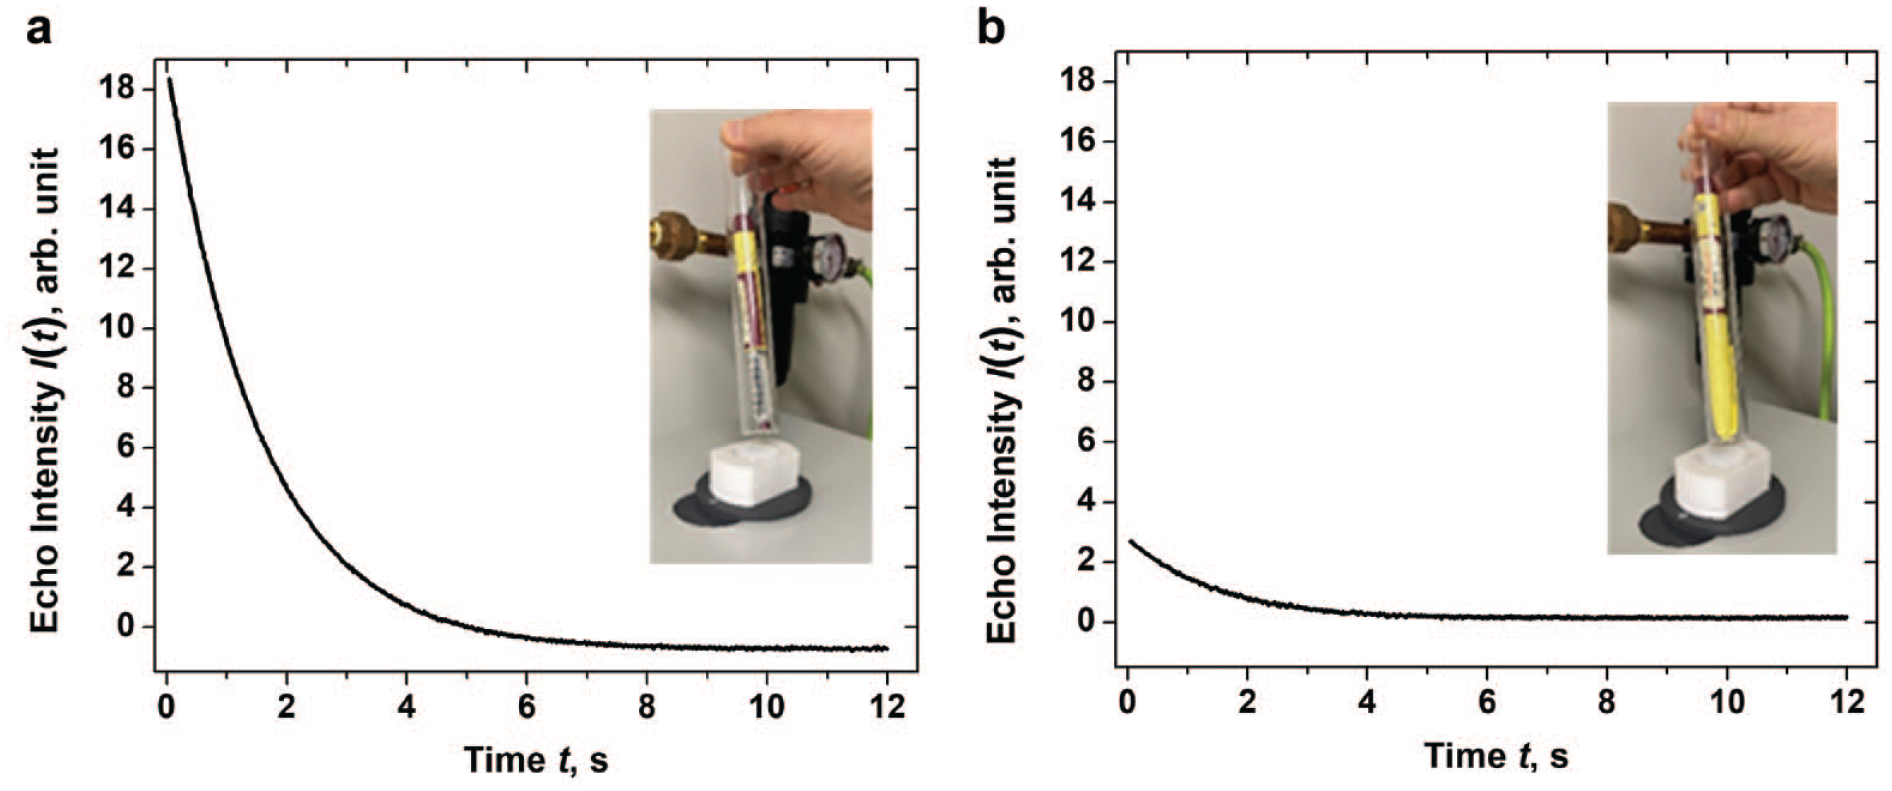
Echo intensity I(t) of Admelog® Pen #1 with Cap off
Invasive Inspection of 4 Insulin Products
For invasive inspection, insulin solution of pen #1 of each product was transferred from the pen to a sterilized glass vial (4 mL, OD 15 mm) and then back to the pen. Insulin solution transfer was conducted using a sterile Terumo needle (0.65 × 32 mm) and a sterile 5 mL syringe. The transfer was carried out in a biosafety cabinet under sterile conditions at room temperature and drawn out and expelled slowly to avoid the foaming of the solution.
After this transferring process, the refilled pen #1was inspected again using the same procedure as in noninvasive inspection, with the cap off. Invasive inspection was performed after noninvasive inspection because the invasive inspection procedure irreversibly compromises the integrity of the drug product; the pen cartridge is punctured, and the insulin solution is exposed to air and shear force. For this reason, invasive inspection was performed only on pen #1 of each product.
wNMR Inspection Parameters
In wNMR inspection, the water proton transverse relaxation rateR2(1H2O) was measured using the CPMG (Carr-Purcell-Meiboom-Gill) pulse sequence of 90°-τ-180°-τ. 41 The duration of 90° and 180° radiofrequency pulses was set to 18 µs and 40 µs, respectively, based on calibration using a mineral oil standard (cat. No. M8410-100ML, Sigma Aldrich, St. Louis, MO). The total number of transients collected in each inspection was 4, with the relaxation delay between transients set to 12 s, and the inter-pulse delay (τ) was set to 500 µs. The instrument’s software includes an automated procedure of selecting the optimal detection parameters based on the largest expected relaxation time T2 input by the user (2 s in our case). A relaxation delay of 12 s was selected to provide6-foldof the largest expected T2values to allow complete relaxation of the nuclear magnetization between transients. The total number of echoes was about 12,000 and the average intensity of every21stecho was recorded. The number of recorded echoes was 571 (= 11991/21).In this averaging procedure, the intensity of each 21stecho signal is measured every 0.5 µs during the echo acquire time of 50 µs. The recorded echo intensity is an arithmetic average of the collected 100 (50 µs /0.5 µs = 100) intensity values. This procedure is repeated for every 21st echo (21st, 42nd, 63rd, etc.) until the final echo signal (the 11991st echo) is collected. Under these parameter settings, the duration of a single measurement, which involves 4 transients, was ~ 96 s.Before each measurement, the resonance offset was tuned and corrected automatically by the instrument software.
The same parameters were used for both noninvasive and invasive inspections. Each pen was measured thrice consecutively.
Data Analysis Procedure
The output of the CPMG pulse sequence is the 1H2Oecho signal intensity at time t,I(t). For all pens, with cap on or off, the water proton transverse relaxation rate R2(1H2O) is extracted from I(t) using following single-exponential fitting formula

where I(t) is the recorded echo signal intensity at time t, and I(0) is the initial echo signal intensity at time 0.Note that I(0) is a fitting parameter referring to the echo signal intensity value extrapolated to time point t = 0. The intensity of the first recorded echo (21st in this particular case) differs from the fitting parameter I(0), since the experimental data collection in the CPMG pulse sequence starts at the earliest time point t = 21 × 2τ = 21 ms, where τ is an inter-pulse delay (500 µs in this work).28,41 All data fitting was performed using Origin 2019 software (OriginLab Corp., Northampton, MA).
Of note, the echo signal intensity in time-domain NMR experiments commonly refers to the signal height, not the signal area.
Results and Discussion
Noninvasive Inspection
Figure 3 shows an insulin pen in an NMR tube about to be lowered into the benchtop NMR probe cavity for data collection. Data collection may be performed with the cap on or off. The cap can be easily taken off and put back on multiple times without compromising the integrity of the product.
As shown in Figure 3, the initial water proton echo signal intensity at first data collection time point is ca. 7 times higher with cap off than with cap on. However, the cap-off data can still be adequately fitted by a single exponential decay function (Equation 1), although the data are noisier leading to higher fitting errors (cf. cap-off and cap-on R2(1H2O) data, Table S1, Supplementary Material).
Figure 4 plots the cap-off inspection R2(1H2O) data for the 4 products, 10 pens per product (see cap-on data in Figure S1 and their comparison with cap-off data in Table S2, Supplementary Material).As shown in Figure 4, the cap-off R2(1H2O) data of the 10 pens of each product fall within a narrow range. The coefficient of variance (standard deviation/mean ratio) is in the range 0.013 to 0.017. We previously have demonstrated that R2(1H2O) increases linearly with insulin concentration. 2 The results here suggest that for the 10 pens of each product studied in this work, the insulin content displays very little variation. It should be pointed out that R2(1H2O) measures the relative, not the absolute, insulin content in a pen. The absolute insulin content would require a calibration standard curve between R2(1H2O) and insulin concentration. Hence, the noninvasive inspection performed here can ascertain insulin dose uniformity, but not the absolute insulin dose level, in the 10 pens of each product.
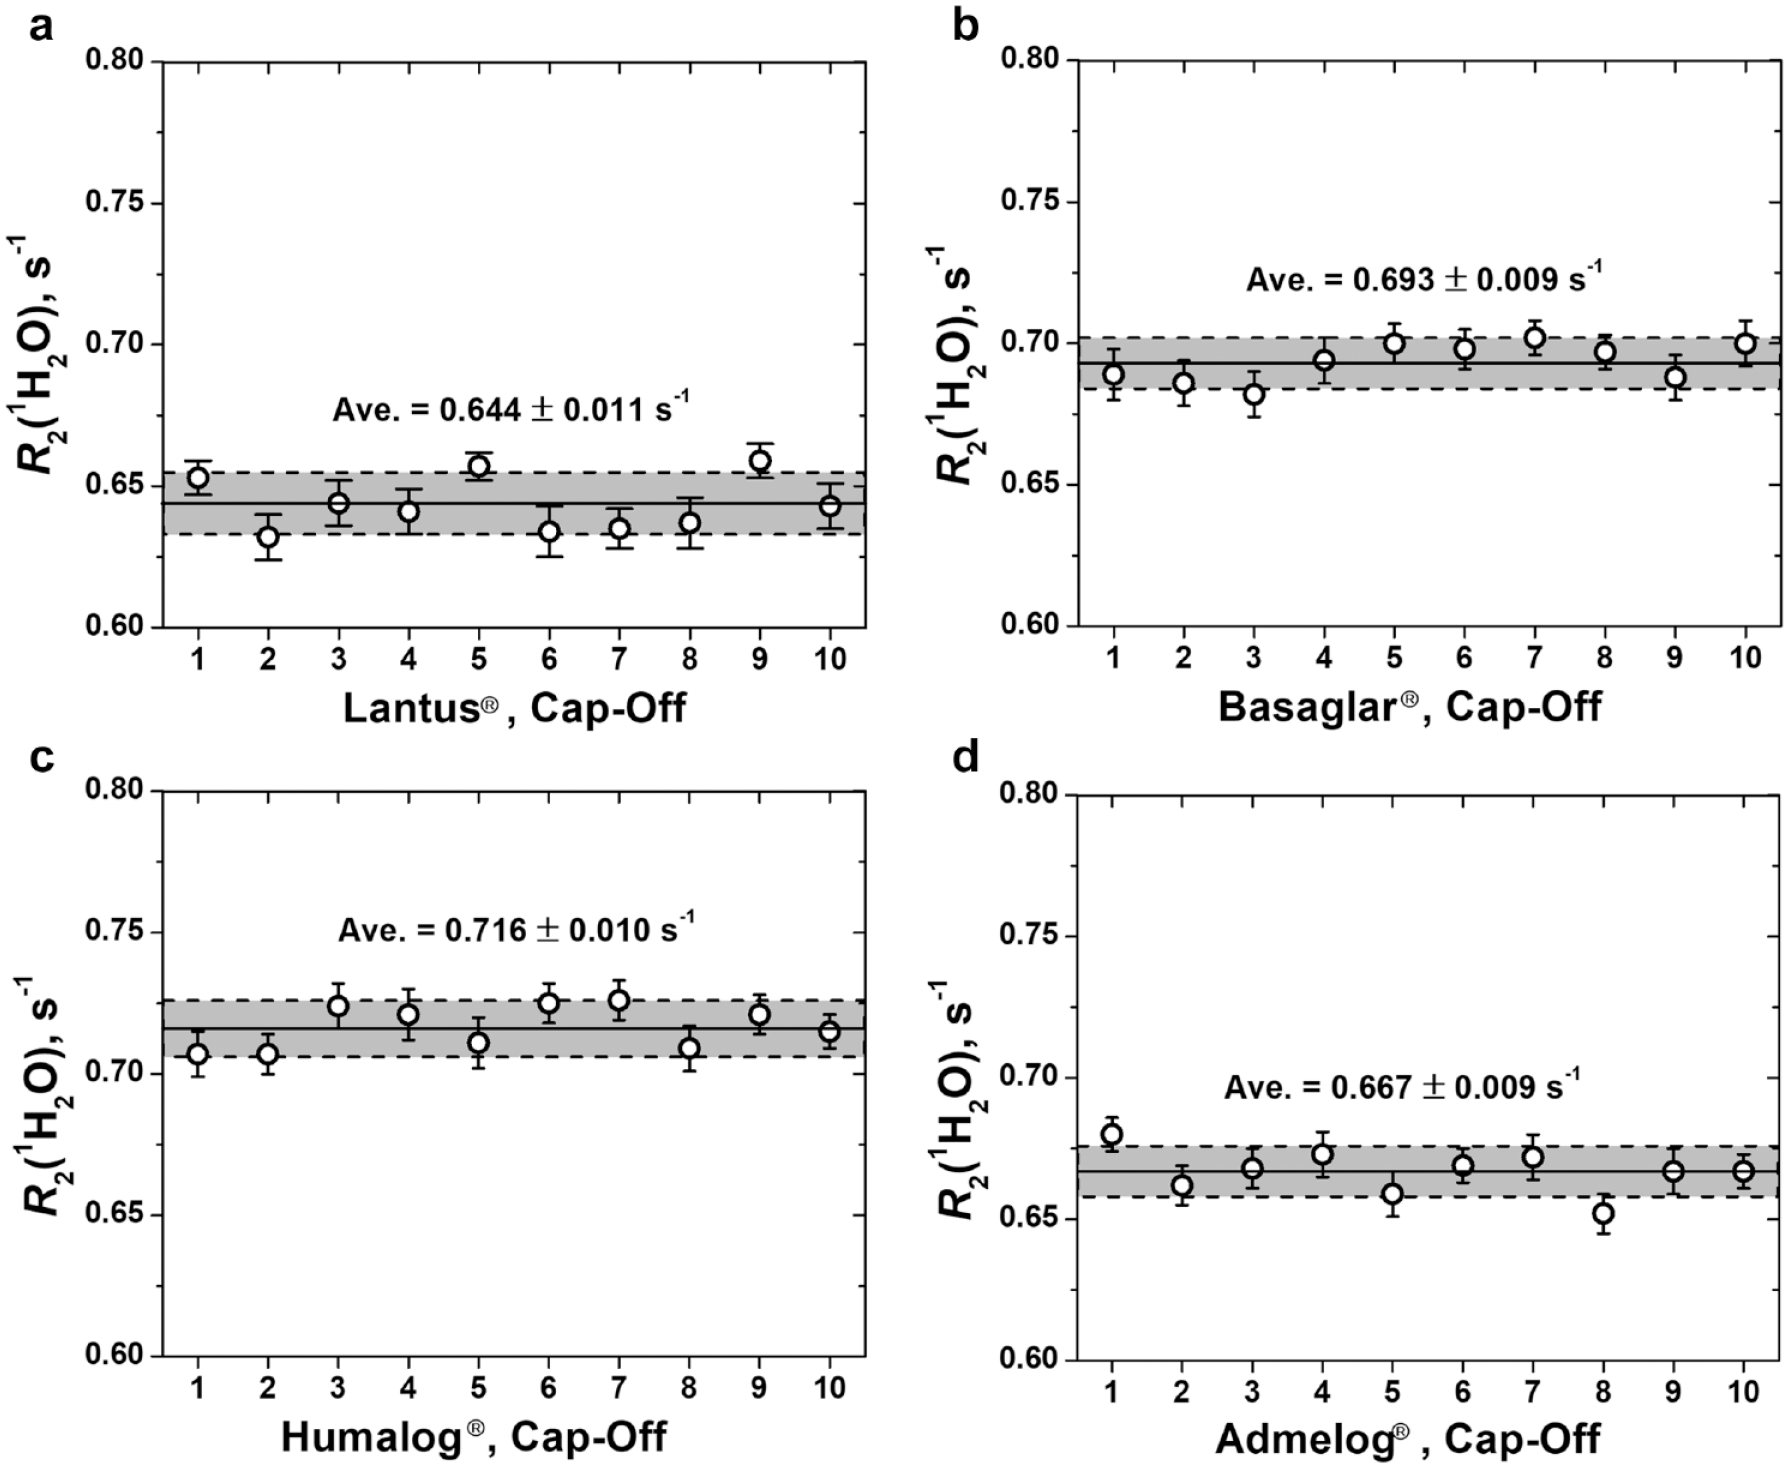
Water proton transverse relaxation rate R2(1H2O) of 4 insulin products. Ten pens of each product were measured. Measurement was made with the cap of each pen removed. R2(1H2O) of each pen is the arithmetic mean of 3 consecutive measurements. R2(1H2O) of each product is the arithmetic mean of 30 R2(1H2O) values, 3 from each pen. The standard deviation of each product shown as a grey strip in each plot, is also calculated from 30 R2(1H2O) values, 3 from each pen. The coefficient of variation (standard deviation/mean ratio) is 0.017, 0.013, 0.014 and 0.014, respectively, for Lantus®
Invasive Inspection
Invasive analysis of insulin products always involves some sample preparation. At the very least, the insulin solution needs to be transferred out of its original container for data collection. Most analyses also require additional sample preparation, such as dilution, mixing, heating, drying, vaporization, and so on. Sample preparation might perturb the sample and thereby introduce additional uncertainty or even bias into the analysis. In contrast, inspection by wNMR involves no sample preparation of any kind.
To explore potential impact of sample transfer on the inspection result, the insulin solution from pen #1 of each product was transferred out of the pen into a glass vial, and then back into the pen. Water proton transverse relaxation rates of insulin solution inside pen #1 were measured both before and after the sample transfer procedure. Figure 5 shows the values of R2(1H2O) of 4 insulin products observed before and after the sample transfer. As seen from the results shown in Figure 5, sample transfer caused significant increase of R2(1H2O) for all 4 products, although the scale of R2(1H2O) increase varies among the products(see Figure S2, Supplementary Material).
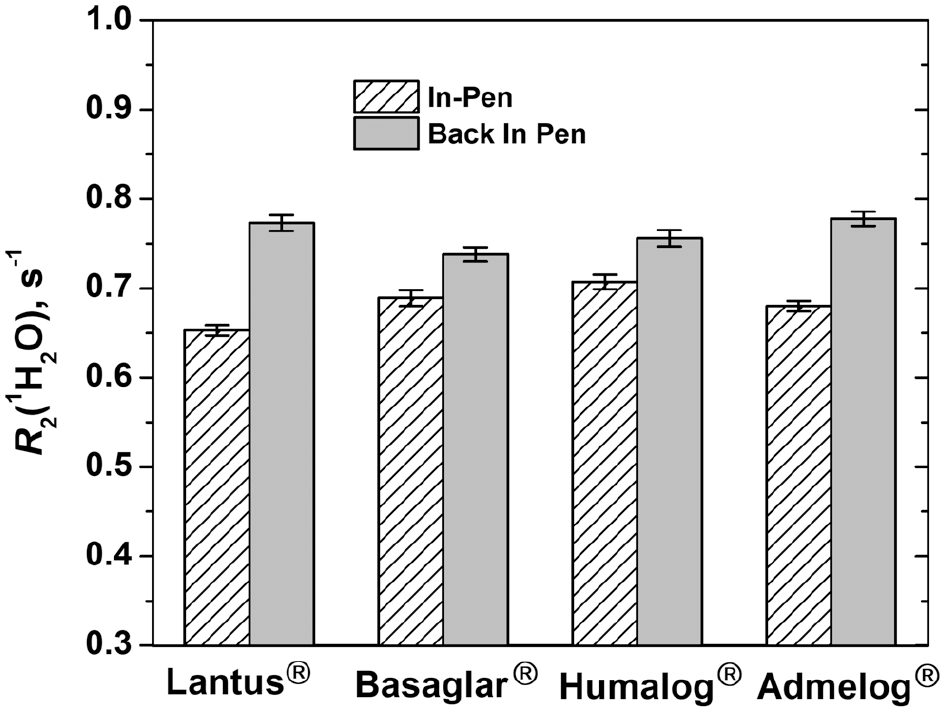
Noninvasive versus invasive analysis. The water proton transverse relaxation rate R2(1H2O) of 4 insulin products before (stenciled) and after (grey) the insulin solution was transferred out and back into pen #1 of each product. This sample transfer procedure increased R2(1H2O) by 18.4%, 7.1%, 6.9% and 14.4% respectively for Lantus®, Basaglar®, Humalog®, and Admelog®. See Table S3, Supplementary Material, for raw data.
A plausible explanation for this R2(1H2O) increase is exposure of the insulin solution to air during sample transfer. Filling of biologics solutions into primary containers is typically carried out under oxygen-free or oxygen-poor atmosphere. 42 Transferring the solution out of the pen exposes it to air, which may lead to oxygen dissolution into the sample. Oxygen is paramagnetic and once in aqueous solution, it is known to elevate R2(1H2O).
The result from this study suggests that sample preparation, even as simple as transferring the sample from one container to another, may perturb the sample significantly. We wish to point out that the fact R2(1H2O) can detect sample transferring out of and then back into a sealed container should not be construed as a lack of robustness of wNMR measurements. Instead, this is an indication of technique sensitivity, which can be used detect product tampering.
In addition to air, transferring the insulin solution from the pen to another container also exposes it to shear force, light, and materials of the transferring vehicle (metallicneedle, plastic pipet tip, etc.) and the receiving container (glass vial, quartz cuvette, etc.). These factors may also affect the sample to some extent. Depending on the analytical technique, sample transfer might significantly impact the measurement outcome, as illustrated here. When measuring drug product quality attributes, such as dose level and content uniformity, one needs to keep in mind the potential impact of the measurement process, especially sample preparation, on the product.
Follow-up Work
This is the first of a series of papers we plan to publish on applying wNMR to inspect insulin products. In future papers, we will report a more detailed examination on the impact of pen cap, instrumentation, and sample transfer on wNMR inspection of insulin products.
Conclusion
Insulin pens can be quantitatively and noninvasively inspected by wNMR, using benchtop instruments. The inspection can be performed with the pen cap off or on. The output of the inspection is a continuous numeric parameter, which may be used to assess product quality, such as content uniformity. With further development and standardization, wNMR holds the potential to quantitatively inspect every insulin vial/pen/syringe by the manufacturer before product release and by the patient before self-injection.
Supplemental Material
sj-pdf-1-dst-10.1177_19322968211023806 – Supplemental material for Inspecting Insulin Products Using Water Proton NMR. I. Noninvasive vs Invasive Inspection
Supplemental material, sj-pdf-1-dst-10.1177_19322968211023806 for Inspecting Insulin Products Using Water Proton NMR. I. Noninvasive vs Invasive Inspection by Marc B. Taraban, Yilin Wang, Katharine T. Briggs and Yihua Bruce Yu in Journal of Diabetes Science and Technology
Footnotes
Acknowledgements
The authors would like to thank Dr. LeonidGrunin (Resonance Systems, GmbH) for his help with data collection and troubleshooting.
Abbreviations
(NMR) nuclear magnetic resonance, (wNMR) water proton nuclear magnetic resonance, (QC) quality control, (TEC) tolerable extent of change, (AEC) actual extent of change, (FDA) Food and Drug Administration, (MRI) magnetic resonance imaging, (UV) ultraviolet, (VT-NMR) variable temperature nuclear magnetic resonance, (CPMG) Carr-Purcell-Meiboom-Gill pulse sequence
Declaration of Conflicting Interests
The author(s) declared the following potential conflicts of interest with respect to the research, authorship, and/or publication of this article: Marc B. Taraban, Katharine T. Briggs, and Yihua Bruce Yu are co-inventors on issued and pending patents on technologies based on water proton NMR.
Funding
The author(s) disclosed receipt of the following financial support for the research, authorship, and/or publication of this article: This work was supported by the FDA through contract 75F40119C10104.
Supplemental Material
Supplemental material for this article is available online.
References
Supplementary Material
Please find the following supplemental material available below.
For Open Access articles published under a Creative Commons License, all supplemental material carries the same license as the article it is associated with.
For non-Open Access articles published, all supplemental material carries a non-exclusive license, and permission requests for re-use of supplemental material or any part of supplemental material shall be sent directly to the copyright owner as specified in the copyright notice associated with the article.