
Abstract
Unlike performance evaluations, which are often conducted under ideal conditions, adverse events occur during actual device use for people with diabetes. This report summarizes the number of adverse events for the years 2018 to 2020 for the 3 diabetes devices: blood glucose meters (BG), continuous glucose monitors (CGM), and insulin pumps. A text example of a CGM injury is provided. Possible reasons are suggested for trends. Whereas the rate per test result (events/usage) is exceedingly small, the rate per patient (events/people with diabetes that use insulin) is of concern. Hence, it is important to determine event causes and provide corrective actions. The first step is to put in place routine analysis of adverse event data for diabetes devices.
Introduction
Performance evaluations provide useful information about diabetes devices, but these evaluations do not have a sufficient sample size to experience rare events. Moreover, the evaluations are often conducted under ideal conditions.
Unlike a performance evaluation, the adverse event database 1 is not based on a sample but rather on the entire population of all blood glucose (BG) and continuous glucose monitor (CGM) glucose results or insulin pump actuations. These adverse events, based on billions of observations, represent problems experienced by people with diabetes.
The Database
Companies are obligated under US law 21 CFR 803
2
to submit an adverse event using Form 3500A.
3
The key language in the regulation about an adverse event is: Caused or contributed means that a death or serious injury was or may have been attributed to a medical device, or that a medical device was or may have been a factor in a death or serious injury, including events occurring as a result of:
(1) Failure,
(2) Malfunction,
(3) Improper or inadequate design,
(4) Manufacture,
(5) Labeling, or
(6) User error.
Not only is an outcome of death or serious injury an adverse event, but any event which has the possibility that a serious outcome might occur also must be reported as an adverse event. Note that if user error occurs as an error source, the adverse event that results is required to be reported. In a typical sequence of events, a person with diabetes experiences a problem with their device and contacts the manufacturer, who then submits the report using form 3500A. Healthcare providers and patients can submit voluntary reports using different forms—this occurs but is rare in the adverse event database. Should a device manufacturer decide to ignore submitting adverse events, the FDA has an enforcement division and has prosecuted companies. 4
Whereas the FDA website has a query tool for people to explore the adverse event database, 5 this tool has limited value. For example, it will not return more than 500 records. To fully explore the adverse event database, requires downloading text files from the FDA website and constructing one’s own database. Events are classified by manufacturers as either malfunction, injury, or death. All events are malfunctions, but if the result is injury or death, then the most serious outcome classification is used.
The input forms make analyzing the data difficult. For example, there were 40 different entries for the brand name of the most popular CGM model in 2020.
Understanding the Data
There are many ways to analyze the adverse event database, but among the most useful is to examine the text of the event itself. Of the 4,710 injury events for CGM that occurred in 2020, the following is a text example.
IT WAS REPORTED THAT AN INACCURACY BETWEEN THE CONTINUOUS GLUCOSE MONITOR (CGM) AND THE BLOOD GLUCOSE (BG) METER OCCURRED. THE SENSOR WAS INSERTED INTO THE UPPER BUTTOCKS, WHICH IS OFF LABEL USAGE OF THE DEVICE ON (B)(6) 2020. ON (B)(6) 2020 AT 6:00PM, THE PATIENT WAS DRIVING HOME AND NOTICED A SENSOR ERROR MESSAGE ON HER CGM, THEN LOST CONSCIOUSNESS. SHE WAS FOUND AT THE SIDE OF THE ROAD BY THE POLICE AND EMERGENCY MEDICAL SERVICES (EMS). EMS REPORTED HER CGM DISPLAYED 71 MG/DL; HOWEVER, THE FINGERSTICK BG WAS LESS THAN 20 MG/DL BECAUSE THE VALUE DID NOT REGISTER ON THEIR GLUCOMETER. THE PATIENT WAS TREATED WITH 2 AMPS OF IV DEXTROSE 50%, TRANSPORTED TO THE HOSPITAL AND REGAIN CONSCIOUSNESS AROUND 9:00PM. THE PATIENT WAS ADMITTED TO THE HOSPITAL OVERNIGHT, HER GLUCOSE WAS MONITORED, AND SHE WAS TREATED FOR NAUSEA AND COMPARTMENT SYNDROME OF THE LEFT ARM WHERE THE DEXTROSE INFILTRATED. THE PATIENT REPORTED THAT SHE IS HYPO-UNAWARE AND DID NOT EXPERIENCE ANY SYMPTOMS OF HYPOGLYCEMIA AT THE TIME OF THE SENSOR ERROR. DATA WAS EVALUATED AND THE ALLEGATION WAS CONFIRMED. THE PROBABLE CAUSE COULD NOT BE DETERMINED VIA DATA. THERE WAS NOT A COMPLETE SET OF REPORTED GLUCOSE VALUES AVAILABLE TO SEARCH WITHIN THE PARKES ERROR GRID CALCULATOR. THE DATA INVESTIGATION FOUND A DIFFERENCE IN VALUES THAT FALLS WITHIN THE B ZONE OF THE PARKES ERROR GRID. THIS IS BEING REPORTED DUE TO ADVERSE EVENT AND/OR MEDICAL INTERVENTION. NO ADDITIONAL PATIENT OR EVENT INFORMATION IS AVAILABLE.
The (B)(6) entries were inserted by the FDA to redact any patient identifier information. This text has typical earmarks of an event: namely user error, possible sensor error, and an undetermined cause.
Previous reports described features of adverse events for these diabetes devices.6,7 The European Association for the Study of Diabetes and the American Diabetes Association Diabetes Technology Working Group have issued recommendations about CGMs and pumps that include comments about the adverse event database.8,9
This report summarizes adverse event results for the years 2018 to 2020 (Table 1 and Figure 1).
Adverse Events for Years 2018 to 2020 for BGs, CGMs, and Pumps by Event Classification.
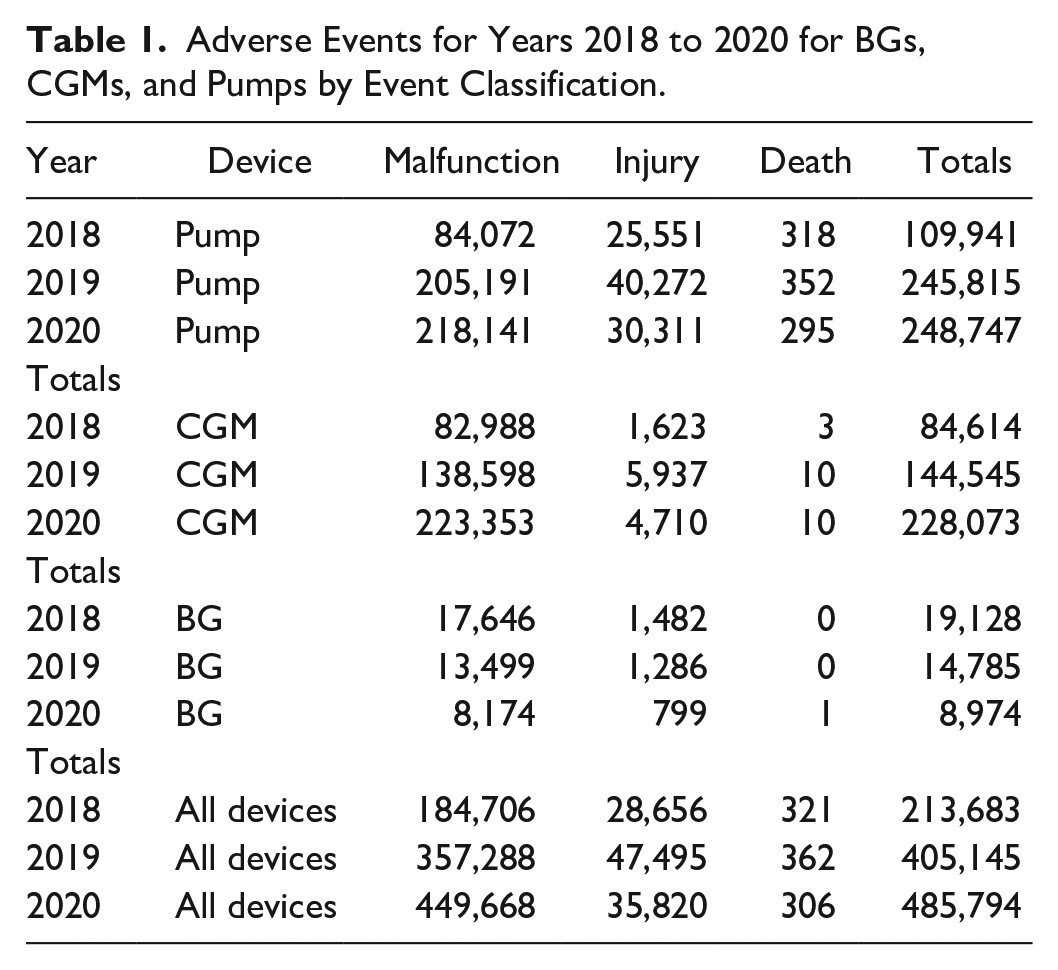
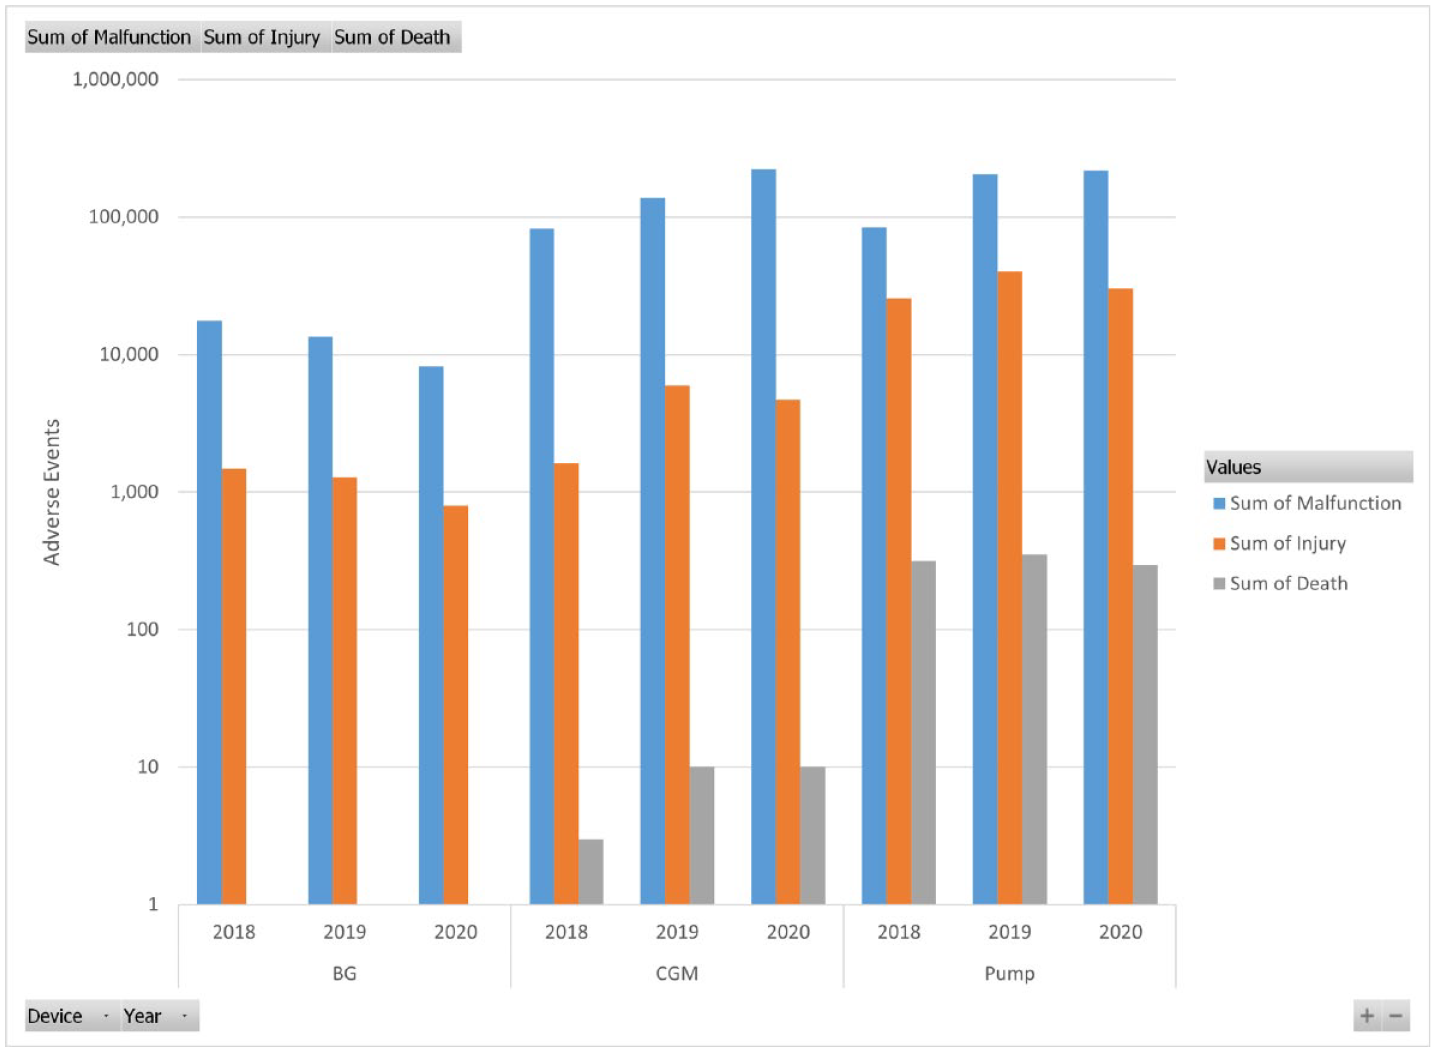
Number of adverse events by classification, device, and year.
Several possible factors that may affect the number of adverse events include;
A change in the number of people with diabetes
The number of people that have changed devices (eg, BG->CGM)
The faithfulness of reporting adverse events, including the faithfulness of classifying events
The number of adverse events that occur
Changes in complexity of devices/user training
For example, the trend in decreasing BG events and increasing CGM events may reflect people changing from BG to CGM.
Unfortunately, useful rate information (number of events / usage) is not available because usage figures of interest (such as by brand or time) are unavailable. Nevertheless, the rates must be exceedingly small due to the large number of observations. For example, the U.S. CGM annual glucose results = 233.4 billion (12/hour×24×365×30% CGM users of 7.4 million insulin users). Yet, if one constructs a rate based on (number of events/people with diabetes that use insulin), rates are much larger. For example, for the years 2018 to 2020, based on 7.4 million people with diabetes that use insulin, 10 the rate of insulin pump events is 8.2%. This rate is an underestimate since not all people with diabetes use pumps. Another way of looking at the data is that in 2020, there were 1,331 adverse events each day (across all diabetes devices).
The Spectrum of Performance Evaluations (BG and CGM)
BG and CGM performance studies are conducted with marketed products, not just before release for sale. These studies include a method comparison that is a controlled experiment often carried out according to the ISO 15197 standard. Sample sizes are small. If results due to user error occur, they are not used—the sample is repeated. This study represents one end of the spectrum—the performance of the device under ideal conditions. Outliers rarely occur, if ever.
Adverse events represent the other end of the spectrum. These results are a small percentage of the billions of glucose determinations. Note that a single person amasses 105,120 CGM glucose results per year. Results are not from an experiment but from actual use. Problems are often caused by user error for BG. 11 And outliers are the rule, not the exception. For example, when inaccuracy was noted for a CGM value and when there was a corresponding BG result, the data point (Y=CGM, X=BG) was almost always in B or higher zones on a Parkes error grid. 7
Each of these performance evaluations plays a role in describing device performance and both have value. Whereas one wants to know the ideal performance of a device, actual device use (which contain errors from all sources) informs the decision to treat (or not to treat) the patient.
Non-Uniform Reporting
Table 2 shows both the number of observations and percentages for adverse event types for CGMs for 2020.
Event_Type Observations and Percentages by Manufacturer for CGM for 2020.
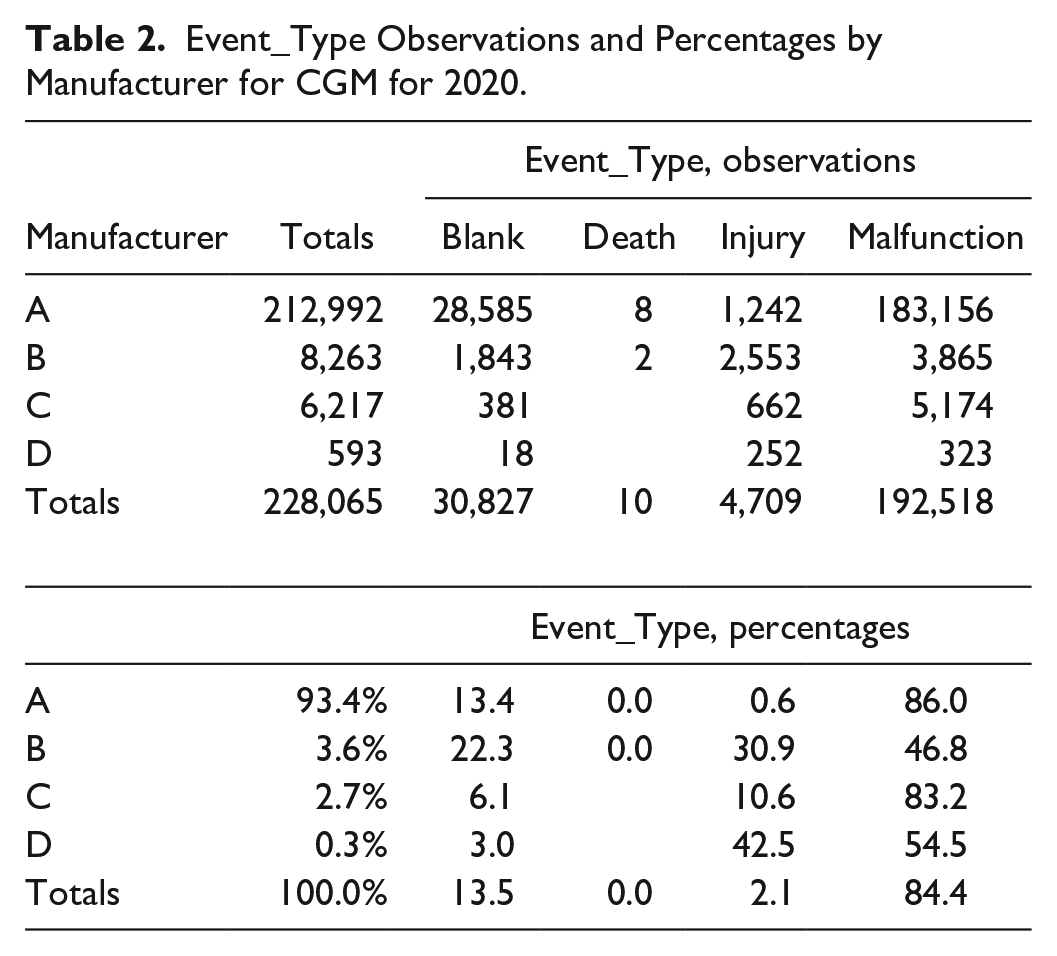
(Totals in Table 2 are slightly less than Table 1 due to blank manufacturer entries). The number of blank event classifications is alarming, and one can question are the differences in the percentages of injury classifications among different manufacturers real? Moreover, there is no way from examining adverse event records to know if events that should have been reported have been omitted. A remedy for this is for FDA to periodically audit whether manufacturers properly submit adverse events during FDA inspections. And the input forms need revision. Blank event classifications should not be permitted.
Conclusions
Product performance studies are useful in determining device performance under ideal conditions. Adverse event data describes real world use. A similar database (Eudamed) exists in Europe. Unfortunately, the data are not publicly available but that is slated to change in 2022. 12 It is time to determine adverse event causes and provide corrective actions. The first step in any corrective action process is to routinely analyze adverse event data for diabetes devices. Whereas the FDA owns the data, they have not taken this analysis step and need to by providing periodic reports including summary reports such as Table 1, and Pareto charts of event causes for each device type. FDA also needs to improve its input forms and to provide an improved access tool to the database which allows standards SQL (structured query language) queries. All stakeholders—diabetes societies, FDA, and manufacturers need to be involved in setting goals for the reduction of adverse events. This could be achieved by a periodic meeting among all stakeholders.
Footnotes
Acknowledgements
Thanks to Patricia E. Garrett for helpful discussions.
Declaration of Conflicting Interests
The author declared no potential conflicts of interest with respect to the research, authorship, and/or publication of this article.
Funding
The author received no financial support for the research, authorship, and/or publication of this article.