
Abstract
Background:
The increasing prevalence of type 2 diabetes mellitus (T2D) and specialist shortage has caused a healthcare gap that can be bridged by a decision support system (DSS). We investigated whether a diabetes DSS can improve long- and/or short-term glycemic control.
Methods:
This is a retrospective observational cohort study of the Diabetiva program, which offered a patient-tailored DSS using Karlsburger Diabetes-Management System (KADIS) once a year. Glycemic control was analyzed at baseline and after 12 months in 452 individuals with T2D. Time in range (TIR; glucose 3.9-10 mmol/L) and Q-Score, a composite metric developed for analysis of continuous glucose profiles, were short-term and HbA1c long-term measures of glycemic control. Glucose variability (GV) was also measured.
Results:
At baseline, one-third of patients had good short- and long-term glycemic control. Q-Score identified insufficient short-term glycemic control in 17.9% of patients with HbA1c <6.5%, mainly due to hypoglycemia. GV and hyperglycemia were responsible in patients with HbA1c >7.5% and >8%, respectively. Application of DSS at baseline improved short- and long-term glycemic control, as shown by the reduced Q-Score, GV, and HbA1c after 12 months. Multiple regression demonstrated that the total effect on GV resulted from the single effects of all influential parameters.
Conclusions:
DSS can improve short- and long-term glycemic control in individuals with T2D without increasing hypoglycemia. The Q-Score allows identification of individuals with insufficient glycemic control. An effective strategy for therapy optimization could be the selection of individuals with T2D most at need using the Q-Score, followed by offering patient-tailored DSS.
Keywords
Introduction
The impact of type 2 diabetes mellitus (T2D) on the healthcare system is increasing worldwide. 1 Decision support systems (DSSs) are one option to provide quality and efficient diabetes care.
Karlsburger Diabetes-Management System (KADIS) is a patient-tailored DSS allowing simulation of personalized therapeutic actions 2 and based on a glucose-insulin control model. 3 Model parameters, identified after input of self-control, therapy, and glucose data, allow to construct the patient’s individual metabolic profile. This personalized in silico copy of the insulin/glucose metabolism is used for interactive simulations. A wide range of therapeutic interventions including physical activity and food intake can be entered into the system. In response the DSS predicts a daily glycemic profile resulting from tested therapeutic changes. Usage of patient-tailored DSS for the management of people with type 1 diabetes (T1D) and T2D can improve glycemic control.4-7
Long- and short-term glycemic control have been recognized as therapeutic targets. HbA1c is a biomarker of long-term control, and Q-Score and time in range (TIR) are markers of short-term glycemic control.8-11 Q-Score11,12 is a composite measure describing the quality of glycemic control (QGC) measured by continuous glucose monitoring (CGM). 13 The Q-Score is constructed from 5 primary factors determining a glucose profile: central glucose tendency, hyperglycemia, hypoglycemia, and intra- and inter-daily variations. 11
Glucose variability (GV) is an important component of short-term glycemic control characterized by the amplitude, frequency, and duration of glucose fluctuation.14-16 GV mediates vascular damage by inducing oxidative stress and chromatin remodeling, even at target HbA1c levels.17-19 GV is incompletely expressed by HbA1c.10,15,20 Dozens of parameters and risk indices have been described for GV assessment10-12,20-22 with high correlations among many of these parameters,11,23 allowing restriction to a few metrics without major loss of information.10,11,15
During the Diabetiva program DSS was offered once a year for ambulatory care of people with T2D. 7 Usage of DSS improved long-term glycemic control shown by HbA1c reduction.6,7 The present study aimed to evaluate whether DSS use can also improve short-term glycemic control including GV. We retrospectively analyzed data from the Diabetiva program. 7 We used the metrics Q-Score 11 and TIR, 24 established after completion of Diabetiva, for the analysis of short-term glycemic control. The parameters mean sensor glucose (MSG), %Hyper, and %Hypo were used to describe glucose profiles.24,25 GV was captured using coefficient of variation (%CV), standard deviation (SD), distance between maximal and minimal value in CGM (range), interquartile range (IQR), and the mean of daily differences (MODD), which is the average of the difference between blood glucose values measured at the same time on consecutive days.11,23-27
We observed that individuals with T2D receiving ambulatory diabetes care with DSS achieve improvements in short-term glycemic control and GV in addition to reduced chronic hyperglycemia.
Materials and Methods
Diabetiva Program
Diabetiva was an integrated healthcare network active from 2007 to 2010 initiated by the German health insurance provider BKK Taunus, open to individuals with diabetes and cardiovascular disease (CVD).6,7 Diabetiva offered CGM once a year and physicians access to CGM data and the KADIS®-based DSS. Physicians were free in their decision to use the DSS, but asked to report their acceptance or decline of the DSS via a questionnaire.
Insured patients were enrolled by invitation from BKK Taunus. Eligibility criteria were age >18 years, diabetes duration for at least 1 year, CVD, ability to perform CGM, and consent to be included in the study. Exclusion criteria were pregnancy, usage of continuous subcutaneous insulin infusion (CSII), severe comorbidity, final diabetes-associated complications, and reduced adherence with neglect of blood glucose measurements.6,7
Study Design
This is a retrospective observational cohort study investigating glycemic control and GV in patients with T2D (Supplemental Table S1). Data were obtained from historical CGM profiles recorded during the Diabetiva program.6,7 Patients were included if 2 CGM profiles were recorded at an interval of 1 year, allowing matching and comparison of GV parameters; if CGM pairs were applicable for the generation of DSS; and if the physicians reported usage or non-usage of the DSS using a questionnaire. Profiles with incomplete readings, missing baseline, follow-up, end of study, or self-control data were excluded from the analysis. The original study obtained ethical approval.
During Diabetiva, 838 people with T2D received CGM, 6 516 of which had a CGM pair obtained approximately 12 months apart. Dropouts were due to incomplete CGM data (n = 34), missing self-control data (n = 6), and no DSS (n = 24). A total of 452 Diabetiva participants, all were Caucasian, met the inclusion criteria and had complete data sets (Supplemental Tables S1 and S2A).
Continuous Glucose Monitoring
Glucose monitoring was performed under daily life conditions for a mean 69.1 ± 4.7 hours using the blinded Medtronic GOLD System (Medtronic MiniMed, Northridge, CA, USA) according to the manufacturer’s instructions as described previously.6,7 The CGM profiles were downloaded using MiniMed Solution Software and transferred to the KADIS system with basic patient and self-control data using the telematic platform TeleDiab5-7 provided by the Diabetes Service Center.
KADIS-Based Personalized Decision Support
KADIS is an interactive computerized diabetes DSS.2,4-7 It requires the following input: CGM data, basic data (age, gender, BMI, onset and type of diabetes), and self-control data (carbohydrate intake, oral hyperglycemic agents, insulin therapy, physical activity). After data input, the first step is to identify the model parameters describing the individual insulin/glucose metabolism of a person with diabetes. These parameters allow the generation of a personalized in silico copy of the current glycemic status, which is visualized on the screen as glucose over time, including all present therapeutic actions and physical activity.2,4,5 Using this in silico copy, the second step is to simulate therapeutic options (eg, oral hyperglycemic agents, different formulations of insulin, carbohydrate intake, and exercise) that may provide the most appropriate individual glycemic control according to the guidelines of the German Diabetes Association. The interactive DSS simulations were carried out manually in dialogue with the TeleDIAB system. 5 Third, the simulation results are summarized in a report, which provides the DSS to the treating physician. These 3 steps were performed for each participant. The physicians decided whether DSS was used or not. Feedback regarding use or nonuse was provided by the physician via a questionnaire.
TeleDIAB
DSS is embedded in the TeleDIAB eHealth system comprising 2 main parts, the database platform and the communication platform. All data are stored in the database platform. DSS is generated by using a high-speed calculator for KADIS-related identification and simulation programs. The communication platform provides interfaces for data input as well as for access to DSS by specific designed RESTful (REpresentational State Transfer) Web-Service procedures.
Glycemic Control
QGC was monitored using HbA1c, TIR, and Q-Score. TIR (%) was calculated as the proportion of time the glucose readings were within the range of 3.9-10.0 mmol/L. Hypoglycemic (<3.9 mmol/L) and hyperglycemic (>10.0 mmol/L) periods were addressed as the proportion of time outside the target glucose range: the percentage of time in hypoglycemia (%Hypo) and percentage of time in hyperglycemia (%Hyper). Except for HbA1c, all parameters and indices were calculated using data from CGM.
Q-Score
The Q-Score 11 is a composite metric constructed using the parameters MSG (in mmol/L); time outside the Q-Score target range of 3.9-8.9 mmol/L [t(hyper) and t(hypo), in hours]; range (in mmol/L); and MODD (in mmol/L). The formula for the Q-Score is
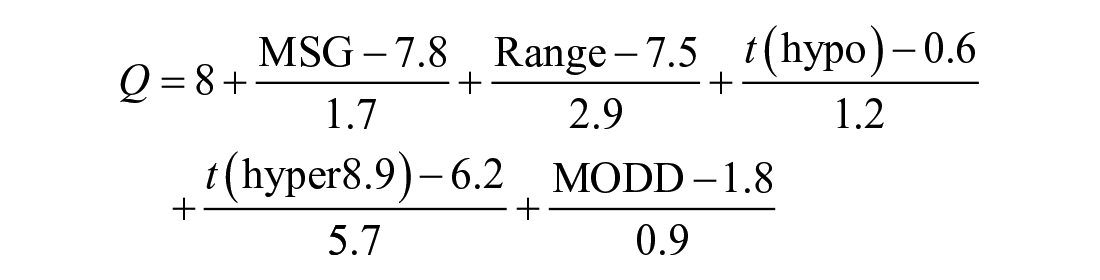
The numerical value was used to categorize CGM profiles into 5 quality categories: <4.0, very good; 4.0-5.9, good; 6.0-8.4, satisfactory; 8.5-11.9, fair; and ≥12.0 poor. Patients with fair or poor profiles were considered to have insufficient glycemic control. 11
Glucose Variability
According to recent recommendations, GV was evaluated using the following parameters: %CV, SD, Range, MODD, IQR, mean amplitude of glycemic excursions (MAGE), and continuous overlapping net glycemic action (CONGA).11,24-28
Statistical Analysis
All statistical analyses were performed using PASW Statistics for Windows, Version 18.0 (SPSS Inc., Chicago, IL, USA). The parameter kadis was included to address the effect of DSS; usage of DSS is incorporated as kadis = 1 and nonuse as kadis = 0. Results are given as means ± SD or median (25th; 75th percentile) and in figures as means ± SEM. Differences from baseline were tested by paired Student’s t-test or Wilcoxon signed-rank test for the parameters %Hyper and %Hypo. One-way ANOVA or the Kruskal-Wallis test was used when comparing multiple groups. 29 We used stepwise multiple regression analysis to explore the influence of HbA1c at baseline, the starting value of a parameter, and DSS use on changes in HbA1c, Q-Score, times above and below the target range, and parameters of GV. To exclude strong relationships between independent variables in the regression models, colinearity statistics with variance inflation factor were performed. P < 0.05 was considered significant.
Results
Glycemic Control at Baseline
The CGM profiles of 452 people with T2D were analyzed. Approximately one-third of study participants (32.1%, n = 145) had a Q-Score indicating good short-term glycemic control (Supplemental Table S1). Q-Scores were lowest in participants treated with diet and highest in those treated with insulin (Supplemental Table S2A). Q-Scores increased with rising HbA1c (Supplemental Table S2B). The percentage of participants with insufficient short-term glycemic control (CGM in Q-Score categories fair + poor) increased with therapeutic complexity, from diet (19.5%) and oral antihyperglycemic drugs (OADs) (26.3%) to OAD + insulin (45.4%) and insulin-only (55.0%, Figure 1a, Supplemental Table S2A). TIR decreased with therapeutic complexity (Supplemental Table S2A) and was lowest in participants with a Q-Score indicating insufficient glycemic control (Supplemental Table S2C).
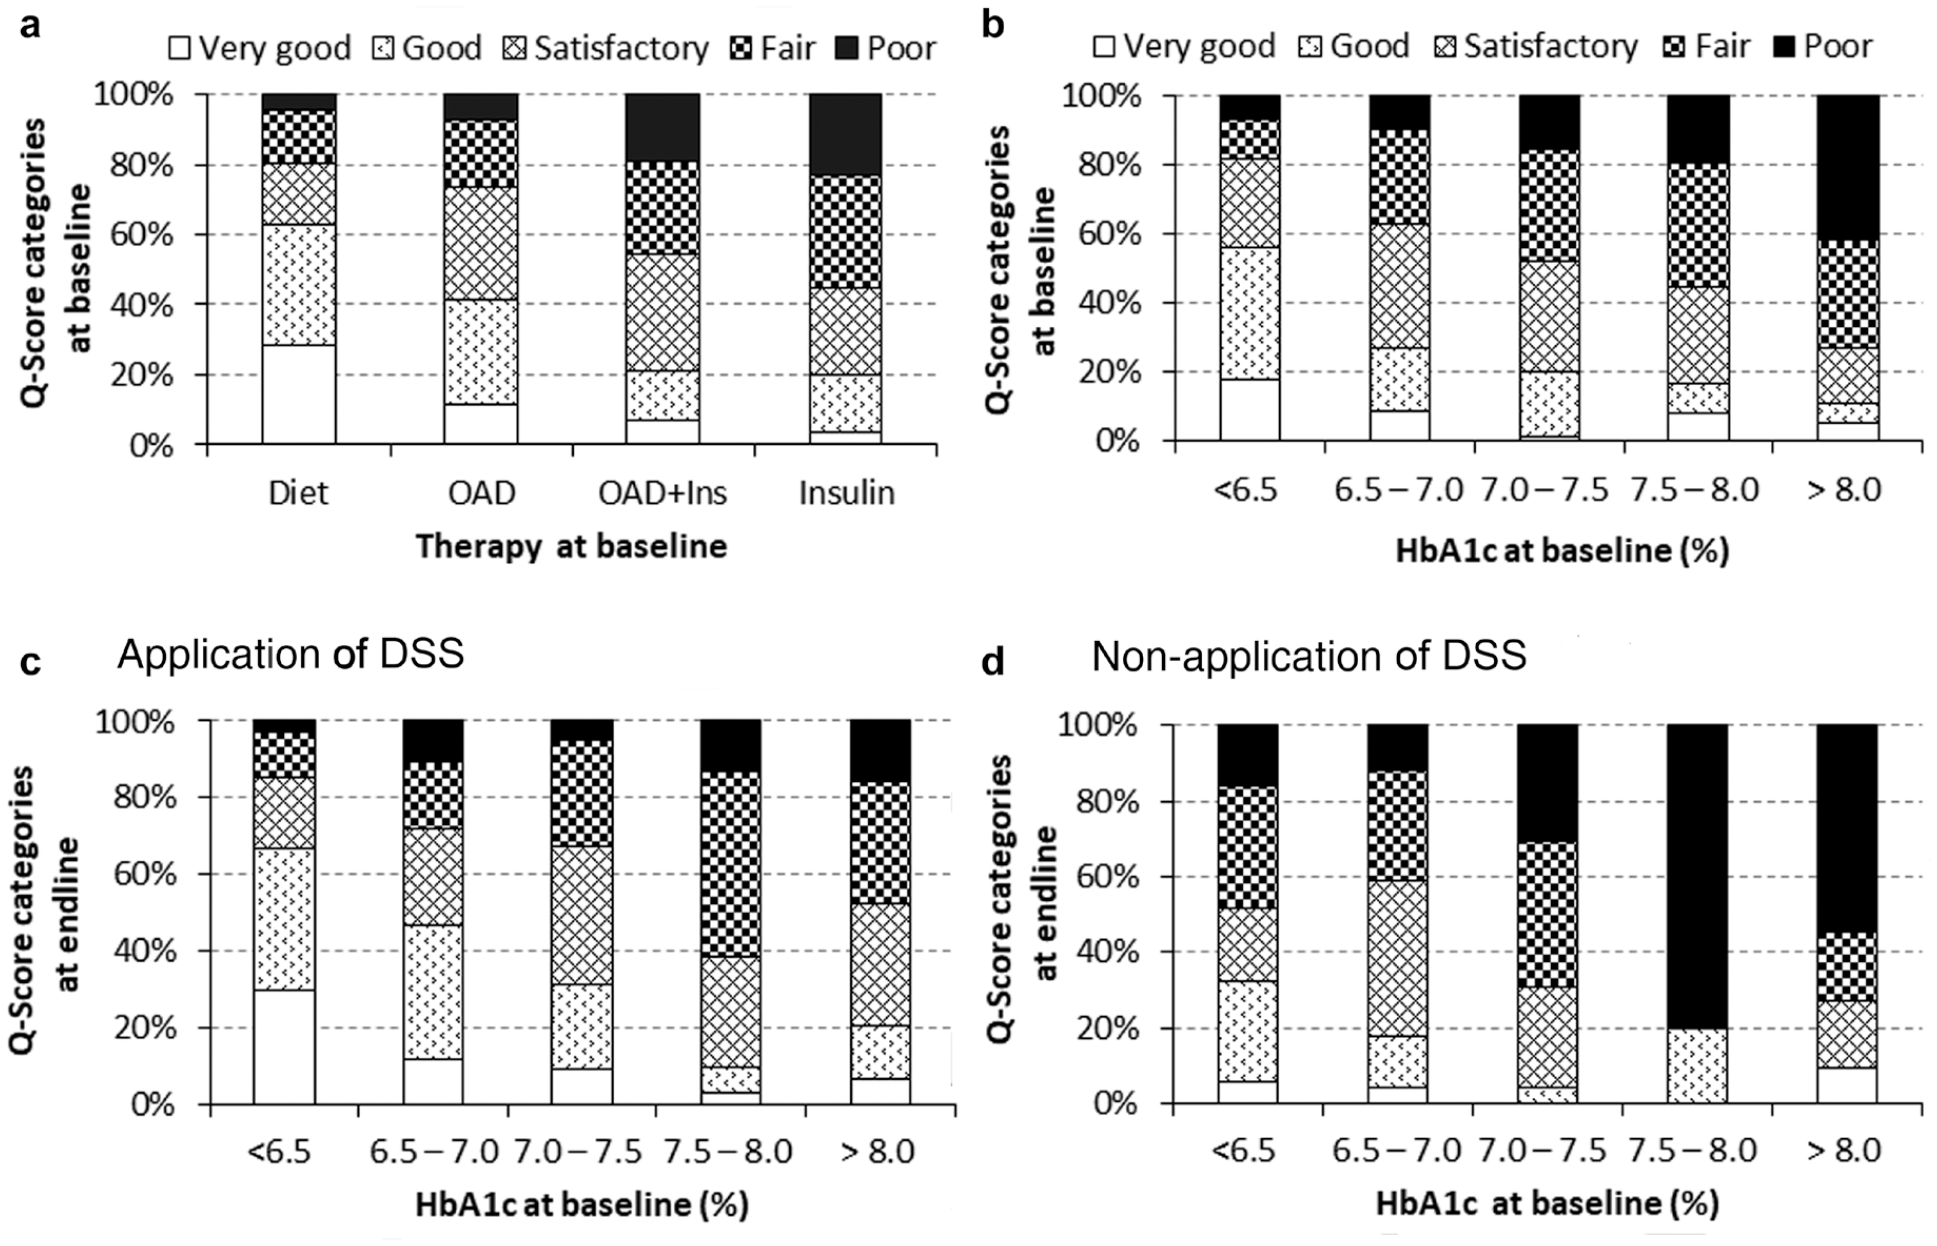
Assessment of baseline short-term (a, b) glycemic control using the Q-Score (a) depending on therapy and (b) HbA1c levels. (c, d) Analysis of short-term metabolic control 12 months after initial supply of CGM data and DSS. Physicians were free to use (c) or not use (d) the DSS. Distribution of study participants to Q-Score categories in percentage is shown at base line (a, b) or end of study (c, d) in stacked histograms. CGM, continuous glucose monitoring; DSS, decision support system.
In the HbA1c categories for tight (HbA1c <6.5 %) and well-controlled (HbA1c 6.5-7%) T2D, 17.9% (26/145) and 37.3% (47/126) of participants had insufficient short-term glycemic control (Figure 1b). A total of 40.7% of participants with HbA1c values indicating tight or well-controlled T2D, but insufficient short-term glycemic control, were treated with insulin. HbA1c values were limited to an association with Q-Score (r = .419; P < .001).
The percentage of participants with Q-Scores indicating insufficient short-term glycemic control increased with rising HbA1c values, from 37.8% in the HbA1c category 6.5%-7.0% to 72.7% in the HbA1c category >8% (Figure 1b). Accordingly, the Q-Score parameters MSG, range, MODD, and %Hyper increased with rising HbA1c. The exception was %Hypo, which was highest in patients with HbA1c <6.5% and lowest in patients with HbA1c >8.0% (Supplemental Table S2B).
The analysis of Q-Score components revealed that, in patients with tight and well-controlled T2D, %Hypo and range accounted for insufficient glycemic control, whereas in patients with HbA1c >8% it was the parameters MSG and %Hyper (Supplemental Table S3).
Glycemic Variability at Baseline
Worsening of short-term glycemic control was associated with increased GV. The parameters for GV increased from diet and OADs to OAD + insulin and were highest in patients with T2D treated with insulin only (Supplemental Table S2A). Increasing HbA1c levels were associated with higher GV parameters, with the exception of %CV (Supplemental Table S2B). Increasing Q-Score correlated with a significant increase in all GV parameters, including %CV (Supplemental Table S2C).
Application of DSS Improved Glycemic Control and Reduced Glycemic Variability
Therapeutic implementation of the recommended DSS improved short- and long-term glycemic control (Figure 1c, Table 1). The proportion of participants with very good and good short-term glycemic control increased (Figure 1c) compared to those who were not treated with the DSS (Figure 1d).
Comparison of Glycemic Control and Glucose Variability in Patients Treated With (n = 322) or Without (n = 130) DSS. Data Are Given as Mean ± SD or Median (Interquartile Range).
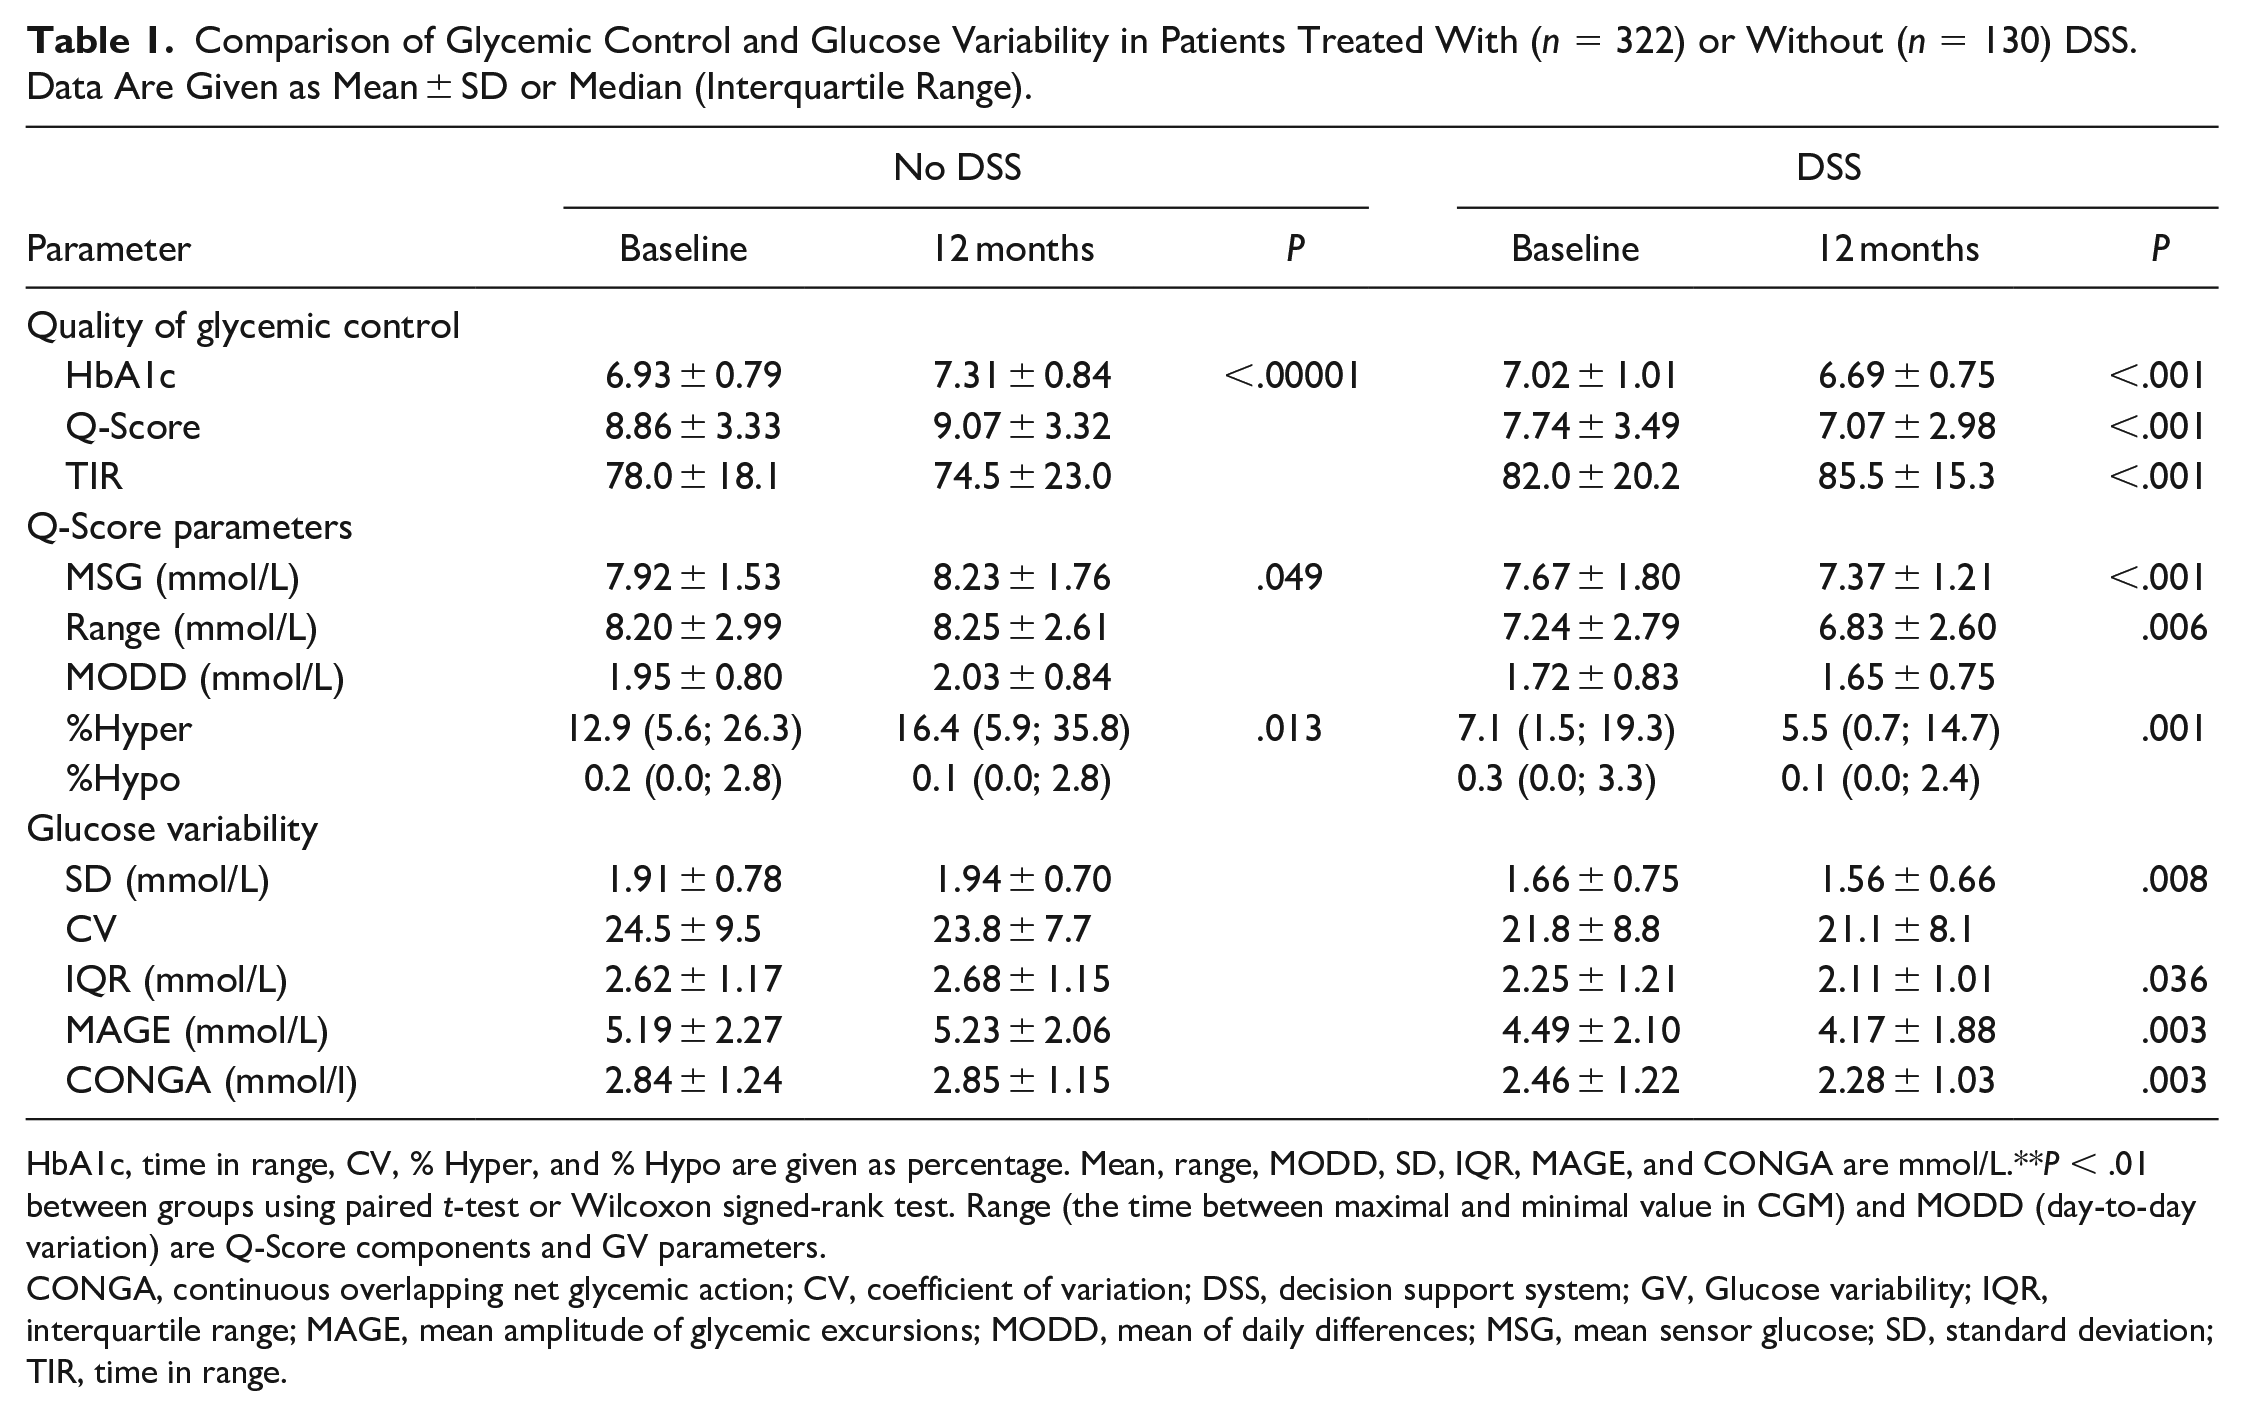
HbA1c, time in range, CV, % Hyper, and % Hypo are given as percentage. Mean, range, MODD, SD, IQR, MAGE, and CONGA are mmol/L.**P < .01 between groups using paired t-test or Wilcoxon signed-rank test. Range (the time between maximal and minimal value in CGM) and MODD (day-to-day variation) are Q-Score components and GV parameters.
CONGA, continuous overlapping net glycemic action; CV, coefficient of variation; DSS, decision support system; GV, Glucose variability; IQR, interquartile range; MAGE, mean amplitude of glycemic excursions; MODD, mean of daily differences; MSG, mean sensor glucose; SD, standard deviation; TIR, time in range.
The impact of DSS depended on baseline values (Figure 2a and b), for example, the highest HbA1c decrease (−1.4%) was seen in patients with baseline HbA1c >8.0% (Figure 2b).
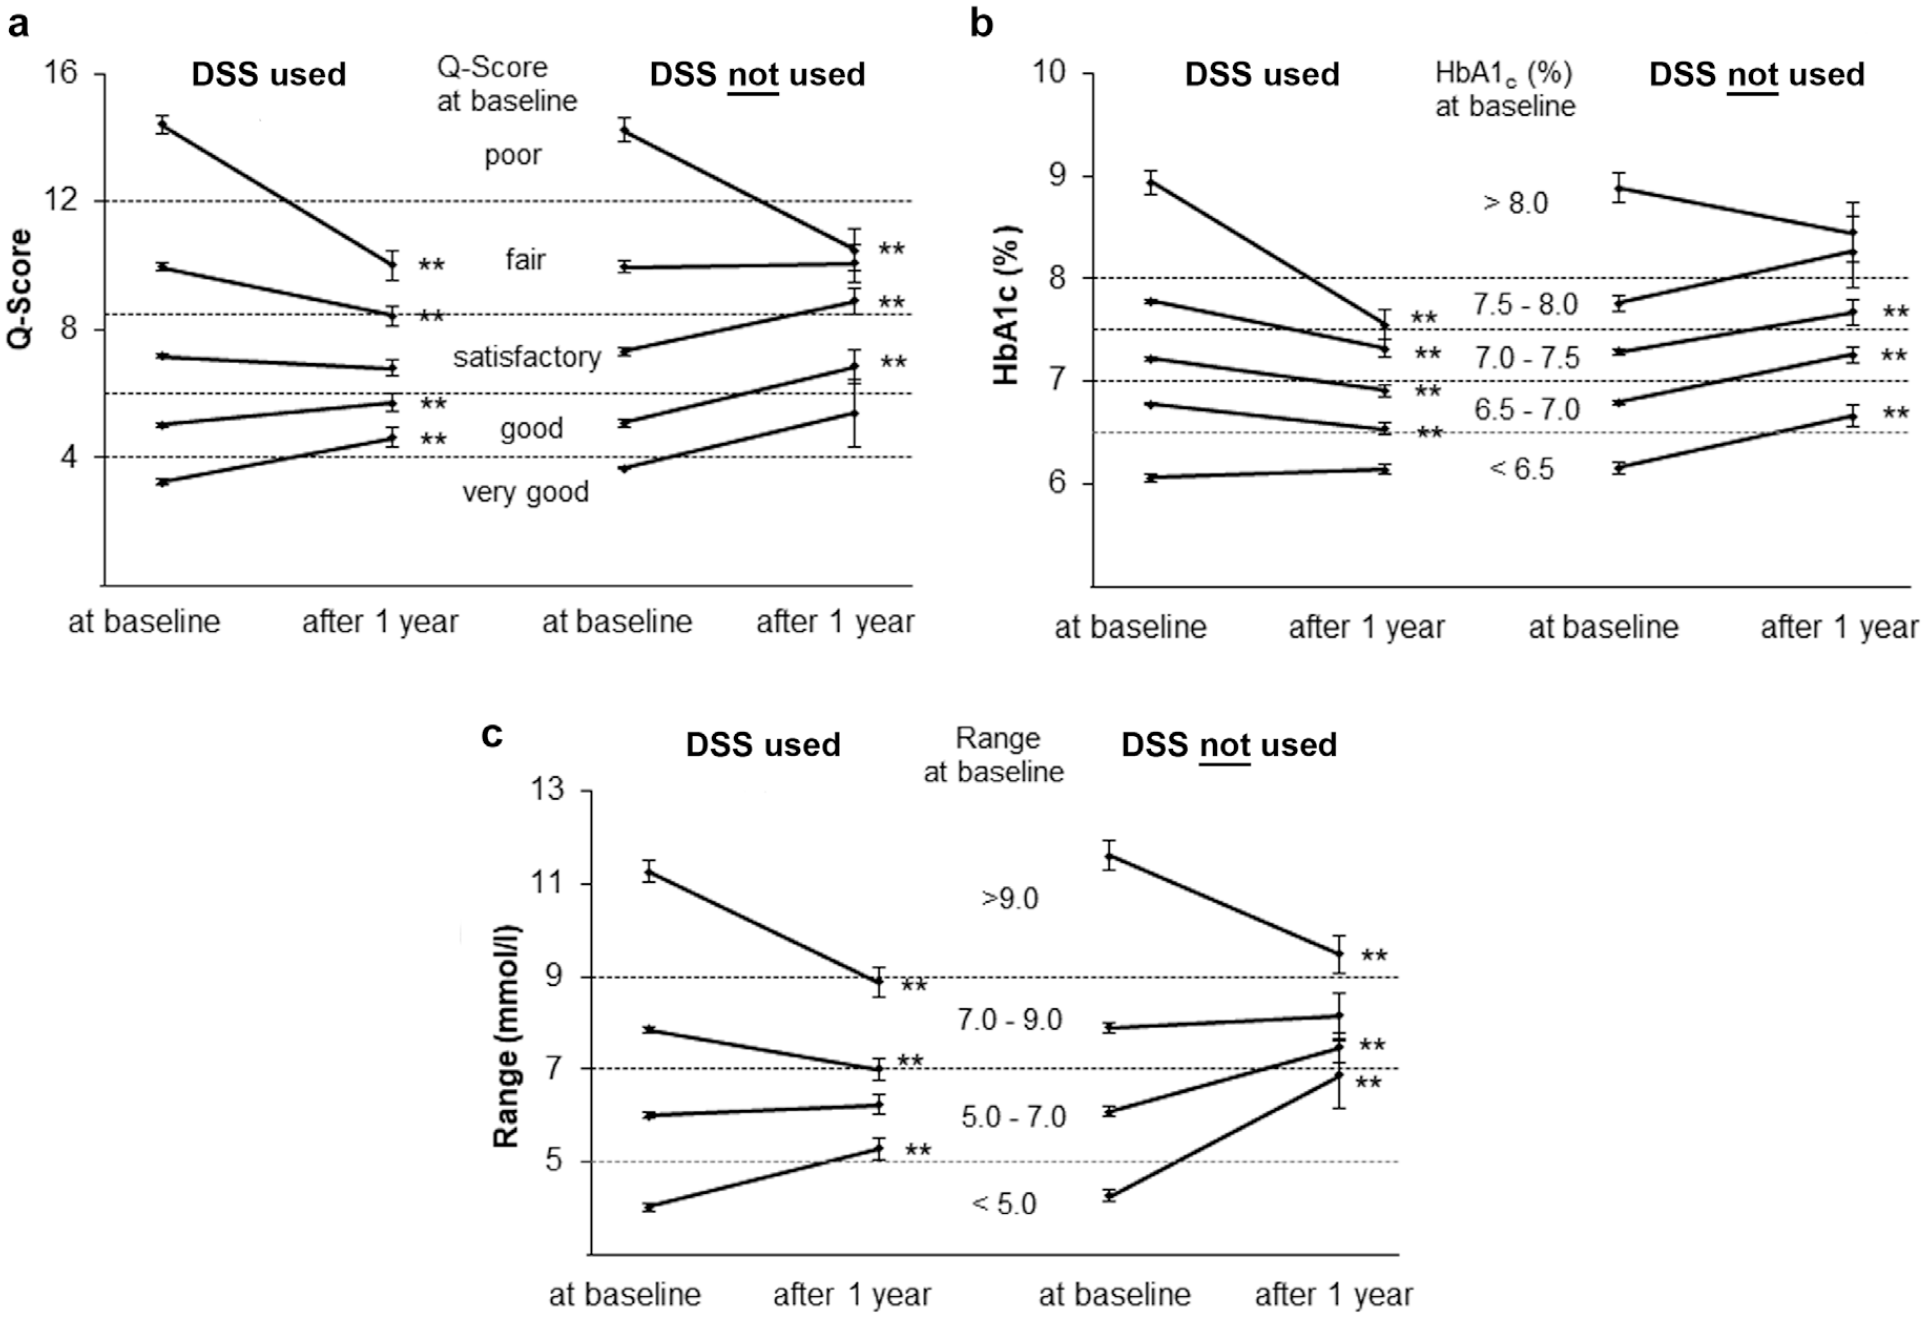
Effect of DSS on metabolic control and glucose variability (GV). (a) Short-term metabolic control as assessed by Q-Score at baseline. (B) Long-term metabolic control as assessed by HbA1c levels at baseline. (C) GV exemplified using the parameter “range” at baseline. Data are given as mean ± SEM. **P < .01 between groups using paired t-test. DSS, decision support system.
DSS benefited most participants with insufficient short- and long-term glycemic control by improving HbA1c, Q-Score, and GV (Figure 2, Table 1). Participants with baseline HbA1c <6.5% who used DSS had stable HbA1c levels after 12 months and fewer hypoglycemic episodes. In contrast, if the recommended DSS is not used, HbA1c increased in patients with baseline HbA1c <8.0%. The increase in HbA1c was accompanied by increased MSG and %Hyper (Table 1). Without DSS use an effect on HbA1c was observed only in patients with baseline HbA1c >8%, with HbA1c decreasing by 0.43% (Figure 2b).
Participants with elevated GV achieved an improved GV after using the DSS (Figure 2c; Table 1). Application of DSS resulted in significant improvement in SD, range, CONGA, and IQR, with the exception of %CV and MODD (Table 1). The %CV <21% indicates a stable glucose level.24,25,27 As shown for the GV parameter range (Figure 2c), and also found for SD, CONGA, IQR, and MODD (data not shown), high values improved and low values increased, reflecting the DSS effect (Figure 2c). Non-usage of DSS had no effect on GV (Table 1).
DSS Effect on GV Depends on HbA1c and GV at Baseline
Changes in GV after 12 months depended on the baseline values of the GV parameters, HbA1c levels at baseline, and application of DSS. Therefore, the relationship between two variables was influenced by the third. To examine the sizes of the single baseline effects, a multiple regression analysis was performed (Table 2). For all GV parameters, the regression coefficients were significant (P < .01).
Multiple Regression Analysis to Calculate the Influence of Baseline Parameters, HbA1c and DSS.
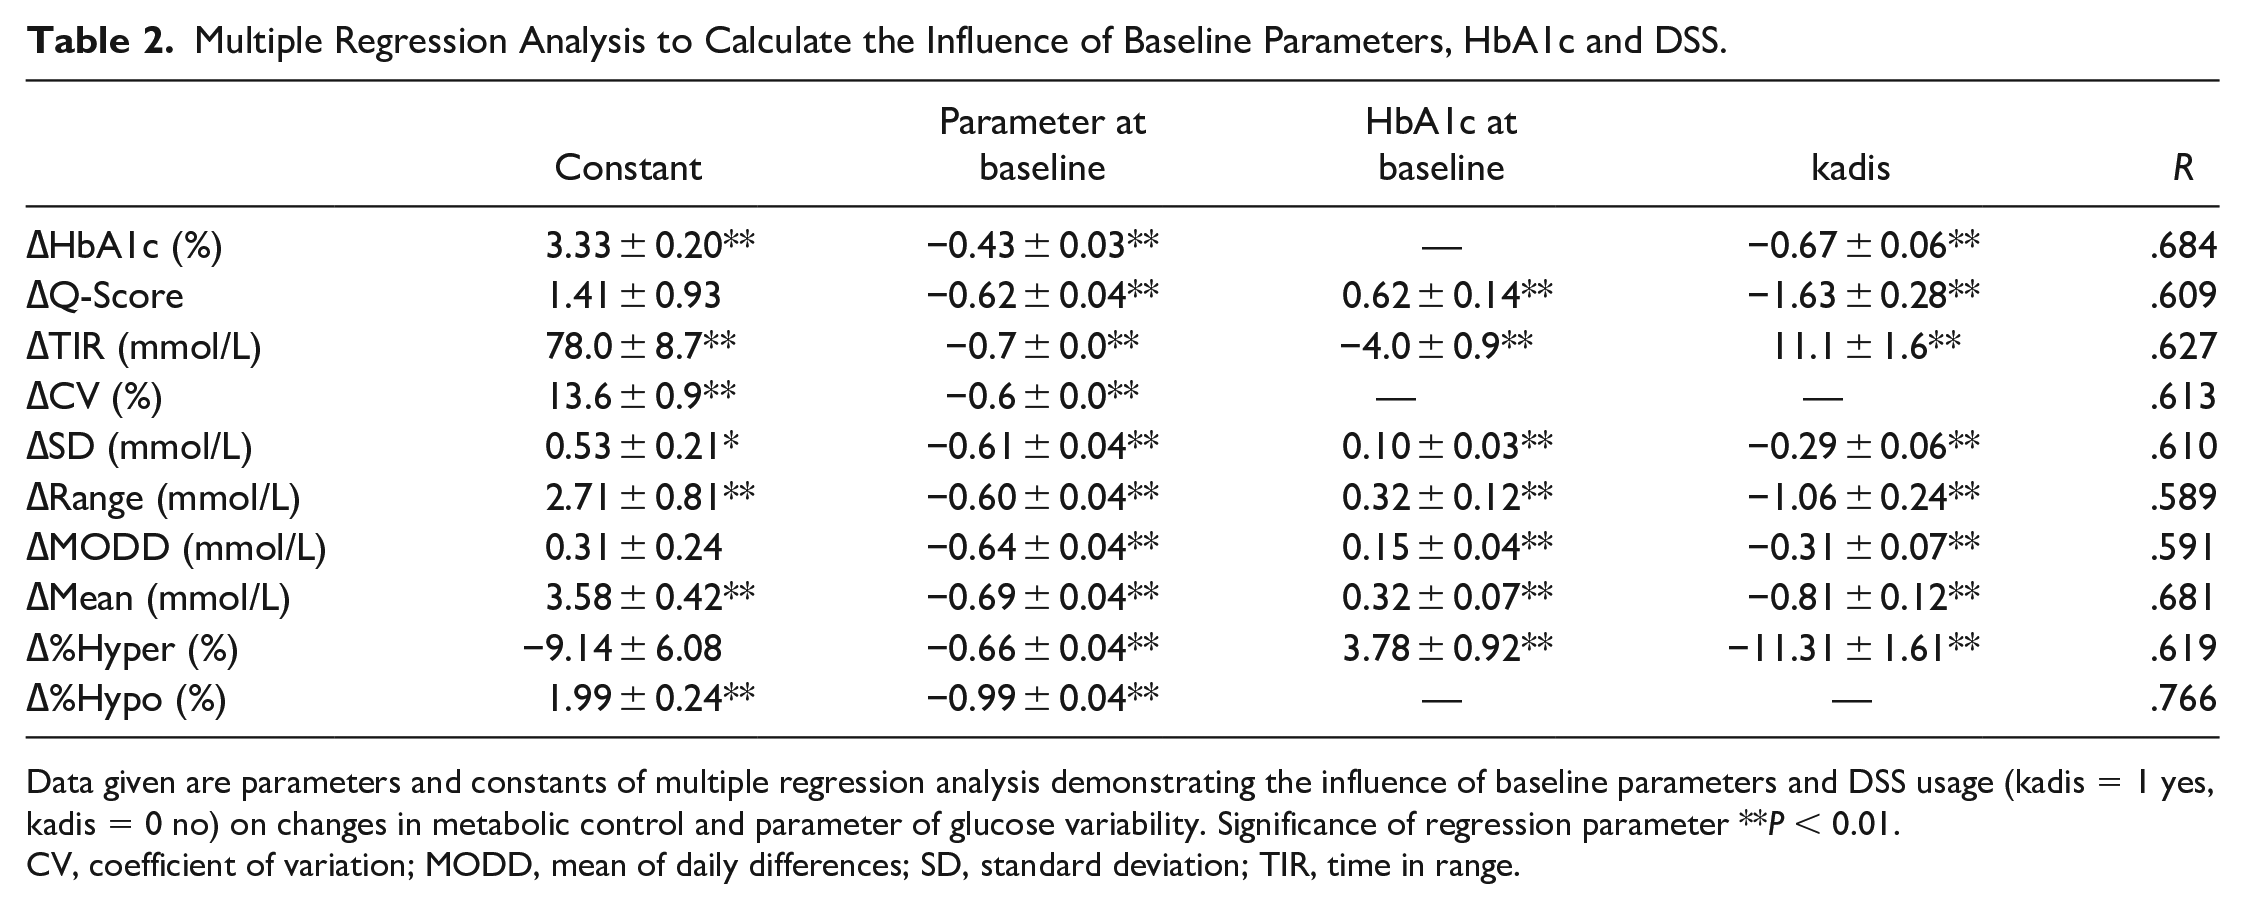
Data given are parameters and constants of multiple regression analysis demonstrating the influence of baseline parameters and DSS usage (kadis = 1 yes, kadis = 0 no) on changes in metabolic control and parameter of glucose variability. Significance of regression parameter **P < 0.01.
CV, coefficient of variation; MODD, mean of daily differences; SD, standard deviation; TIR, time in range.
As exemplified for range (model formula: ∆range = 2.71 − 0.60 range 0 + 0.32 hba1c0 − 1.06 kadis; Table 2), the changes in range are dependent on the range at baseline (regression coefficient −0.60 ± 0.04, P < .01), HbA1c at baseline (0.32 ± 0.12, P < .01), and DSS use (−1.06 ± 0.24, P < .01). On one hand, this means that a range of 1 mmol/L at baseline results in a 0.58 mmol/L reduction in the range after 1 year; on the other hand, DSS use vs nonuse reduces the range by 1.06 mmol/L. Increased HbA1c values at baseline diminished the effect of the therapy on GV. The total effect on the GV variables after 1 year resulted from the effects on glycemic parameters.
Discussion
Many patients with T2D fail to meet their glycemic targets. 30 A promising approach to improve this situation is the implementation of DSSs. 31 Patient-tailored DSS benefits long-term glycemic control in people with T1D and T2D.2,4-7 A meta-analysis of diabetes care DSSs found the best improvement in HbA1c levels after application of the KADIS system. 31
The present real-world observational study confirmed the improvement of long-term glycemic control by application of DSS. 4 As expected, the higher the HbA1c levels at baseline, the greater the improvement in HbA1c. 7 If the DSS was not used, the reduction in HbA1c was smaller, equivalent to the CGM effect (~0.3% HbA1c reduction) reported for patients with T2D and HbA1c >8% at baseline.4,13,24,28 As the CGM system used in this study was blinded, the glycemic control results are not influenced by CGM data.
Application of the DSS improved short-term glycemic control in patients with T2D. Baseline DSS usage increased the proportion of patients with very good, good, and sufficient short-term glycemic control after 1 year. This effect was most prominent in patients with insufficient short-term control at baseline as indicated by high Q-Scores, whereas Q-Scores maintained stable in patients with sufficient control. In addition, TIR, an established metric for the quality of short-term glycemic control, 24 was increased in patients receiving DSS. Patient-tailored DSS was also beneficial in patients with T2D and HbA1c <7%, but with high Q-Scores. In this setting, the number of patients with insufficient short-term glycemic control and hypoglycemia decreased. In insulin-treated patients with insufficient glycemic control, the DSS also improved short-term glycemic control (data not shown).
HbA1c and GV are two therapeutic targets of dysglycemia.10,32 CGM has been demonstrated to be clinically valuable by reducing GV in ambulatory patients with T1D and T2D.24,28 Until now, DSSs for improving GV have been developed mostly for T1D or insulin-treated patients in intensive care units, as GV is associated with increased mortality.33,34 A reduction of GV has been demonstrated in people with T2D using second-generation basal insulin analogs, GLP-1 analogs, incretin enhancers, or SGLT-2 inhibitors. 35 An earlier study suggested a positive impact of DSS on GV in T2D. 7 SD, a parameter often used for assessing GV, was reduced by the KADIS-DSS. Moreover, IQR, MAGE, and CONGA were reduced. The most prominent effects were seen in participants with insufficient short-term glycemic control. %CV has been recommended as parameter for GV. 24 Stable glucose levels are defined as a CV <36%.24,36 Higher values have been described for people with T2D treated with insulin and people with T1D. 36 The level of %CV observed in the present study is comparable with studies investigating GV in T2D.36,37 %CV, which correlates with a risk of hypoglycemia,15,25,24 remained stable throughout the study, indicating a lower risk of hypoglycemia in our patients with T2D compared to T1D. 38
As observed earlier, 39 the potential effect on GV was dependent on the GV level at baseline. The total effect of DSS on GV observed after 1 year was the result of the single effects of influencing parameters. High HbA1c at baseline resulted in a reduced impact of DSS on GV.
Taken together, the findings indicate that application of a DSS can improve long- and short-term glycemic control, even in the ambulatory care of well-controlled T2D.
The study is limited by the concept of the Diabetiva program itself, which was a real-world program by an insurance company without a standard diabetes care control group. The physicians were provided with all information, including CGM and DSS, and free to decide whether they wanted to use it. The conclusions are weakened by the fact that only baseline and end of study data were available. The DSS was applied at baseline and the effects analyzed only after 12 months. The strength of this study is the inclusion of individuals with T2D receiving different antidiabetic treatments, including insulin and various classes of non-insulin antidiabetic drugs. However, the present findings need to be addressed in a randomized case-control study.
Conclusion
We showed that application of a personalized DSS can improve key parameters of diabetes care. The combination of HbA1c and Q-Score allows individuals with T2D who are most at need for therapeutic guidance to be identified, as they would benefit from the improved glycemic control offered by DSS. This approach meets the postulated requirements for an outpatient DSS, which are identification of the subset of patients with diabetes who would have the most potential benefit from changes in management, identification of individual-specific clinical domains not at goal, and suggestion of patient-appropriate treatment options. 40 For future studies, we suggest a stepwise design in which individuals with T2D and insufficient glycemic control are identified initially using the Q-Score, and then personalized DSS implemented for this subset of patients.
Supplemental Material
sj-pdf-1-dst-10.1177_19322968211008871 – Supplemental material for Patient-Tailored Decision Support System Improves Short- and Long-Term Glycemic Control in Type 2 Diabetes
Supplemental material, sj-pdf-1-dst-10.1177_19322968211008871 for Patient-Tailored Decision Support System Improves Short- and Long-Term Glycemic Control in Type 2 Diabetes by Petra Augstein, Peter Heinke, Lutz Vogt, Klaus-Dieter Kohnert and Eckhard Salzsieder in Journal of Diabetes Science and Technology
Footnotes
Declaration of Conflicting Interests
The authors declared the following potential conflicts of interest with respect to the research, authorship, and/or publication of this article: PA, LV, PH, and ES hold a patent for the Q-Score used in this manuscript. LV is CEO of the Diabetes Service Centre. KDK declares that there is no conflict of interest. All authors declare that they have no nonfinancial competing interests.
Funding
The authors disclosed receipt of the following financial support for the research, authorship, and/or publication of this article: Grants from the German Federal Ministry of Education and Research (BMBF; FKZ: 03i2700) and the Regional Ministry of Education, Science, and Culture Mecklenburg-Vorpommern (IDK 97 007 80/SOM, IDK 97 007 80/HSP III).
Supplemental Material
Supplemental material for this article is available online.
References
Supplementary Material
Please find the following supplemental material available below.
For Open Access articles published under a Creative Commons License, all supplemental material carries the same license as the article it is associated with.
For non-Open Access articles published, all supplemental material carries a non-exclusive license, and permission requests for re-use of supplemental material or any part of supplemental material shall be sent directly to the copyright owner as specified in the copyright notice associated with the article.