
Abstract
Introduction:
Human regular U-500 insulin (U-500R) is approved for subcutaneous (SC) injection in patients with diabetes requiring >200 units/day of insulin. Here, pharmacokinetic and pharmacodynamic (PK/PD) profiles following U-500R administered by continuous subcutaneous insulin infusion (CSII) and SC injection in adults with type 2 diabetes (T2D) on high-dose insulin were studied.
Methods:
In this randomized, crossover, euglycemic clamp study, patients received a 100-unit bolus of U-500R via SC injection or CSII with basal infusion using a U-500R specific pump. PK parameters were estimated using non-compartmental methods. PD estimates were derived from the glucose infusion rate during the euglycemic clamp procedure.
Results:
When corrected for the basal infusion, the PK profiles for the 100-unit bolus of U-500R were similar for CSII and SC injection. Without correction for basal infusion, PK and PD profiles showed a greater insulin concentration and effect when U-500R was administered via CSII compared to SC injection, primarily due to basal insulin infusion for CSII. The ratio of geometric least squares AUC0-tlast means SC:CSII (90% CI) is 0.857 (0.729, 1.01) with correction (mean AUC0-tlast: 5230 pmol*L/h [SC injection] and 6070 pmol*L/h [CSII, with correction]) and 0.424 (0.361, 0.499) without correction (mean AUC0-tlast: 12300 pmol*L/h [CSII, without correction]). Median time-to-peak insulin concentration was six hours (range 0.5-8 hours) via SC injection and five hours (0.5-12 hours) via CSII.
Conclusions:
In adults with T2D on high-dose insulin, U-500R PK/PD parameters were similar for a 100-unit bolus when given by SC injection or CSII via a U-500R pump.
Keywords
Introduction
Managing patients with type 2 diabetes (T2D) who require high-dose insulin to achieve glycemic control is challenging using conventional treatment options; as insulin doses increase with disease progression, concerns regarding weight gain, hypoglycemia, regimen complexity, increased number or volume of injections, and cost become apparent. 1 Flexible intensive insulin therapy is generally achieved either by multiple daily injections (MDIs) or continuous subcutaneous insulin infusion (CSII). Currently approved/marketed CSII insulin pumps are designed for U-100 insulin; however, patients with high-dose insulin requirements who use more concentrated insulin formulations may benefit from CSII, which potentially offers improvements in comfort and adherence through reduced burden of multiple injections and improved glycemic control. 2
Human regular U-500 insulin (Humulin-R U-500; U-500R) is five times as concentrated as human regular U-100 insulin (U-100R) and is approved in the USA and Canada for subcutaneous (SC) injection in patients with diabetes mellitus requiring more than 200 units of insulin per day to improve glycemic control. 3 Pharmacokinetic (PK) and pharmacodynamic (PD) data have shown that the overall exposure and action of U-500R insulin after SC injections were similar to those of U-100R insulin but with a blunted peak concentration and action profiles and a longer duration of action, suggesting that U-500R has both basal and prandial activity. This supports the use of U-500R to be used as insulin monotherapy.3,4 In patients with T2D and inadequate glycemic control on high doses of U-100 insulin, switching to U-500R has been suggested to improve glycemic control and insulin adherence and reduce cost.1,5-7 Studies have demonstrated U-500R treatment in this population to be efficacious and safe with fewer injections, usually two-three times daily prior to meals. 8 U-500R by CSII using a U-100 pump has also been studied and shown to be safe and effective.9,10 The recent VIVID study directly compared the efficacy and safety of U-500R given by SC injection to U-500R given by an investigational U-500-specific pump (Omnipod® U-500 Insulin Management System, Insulet Corp., Acton, MA) in patients with T2D requiring high-dose insulin. 11 The VIVID study demonstrated that both methods of U-500R effectively lowered HbA1c with CSII having a greater reduction associated with a minimal increase in insulin, albeit with more nocturnal hypoglycemia with CSII than MDI.
The PK/PD properties of U-500R given by SC injection have been studied in healthy obese participants 4 and in patients with T2D; 12 however, data from administration of U-500R via CSII in patients with T2D are lacking. Information about PK/PD profiles following bolus via an insulin pump versus injection is of interest considering that approximately 25% of patients with T2D who receive U-500R are treated off-label with CSII. 6 An insulin pump delivers a CSII for long-term glycemic control and eliminates the need for multiple injections. 13 There are no data from euglycemic clamp PK/PD studies comparing U-500R administered via CSII to U-500 via MDI in T2D patients with high-dose insulin requirements. The use of U-500R in an insulin pump is under investigation and not currently approved by regulators, but may be a viable option in the future. 11
The purpose of this study was to determine PK/PD profiles following the administration of a 100-unit bolus dose of U-500R insulin using an investigational version of the novel, specifically designed Omnipod U-500 Insulin Management System versus a single injection in adults with T2D and high-dose insulin requirements.
Materials and Methods
Study Design
This was a single-center, open-label, randomized, euglycemic clamp study (Supplemental Figure 1, NCT02588950) in patients (N=11) with T2D treated with high-dose insulin. The randomized crossover design allowed each patient to act as his/her own control, thus potentially decreasing variability and other confounding factors.
Patients
Eligible patients with T2D were ≥18 to <75 years of age with hemoglobin A1c (HbA1c) 7.5%-11.5% inclusive, body mass index (BMI) ≥27 kg/m2, and with high-dose insulin requirements. High-dose insulin was defined as using U-100, U-200, and/or U-300 insulin with a total daily dose (TDD) ≥150 units or at least one dose of >100 units as part of an MDI regimen with a TDD ≤3.0 units/kg. Patients were currently using U-100, U-200, and/or U-300 insulin analog as basal, premixed, and/or basal-bolus therapy delivered with pens and/or syringe and vial (but excluding CSII/insulin infusion pumps in the preceding three months).
Sample Size
Target enrollment was 32 patients with 24 completers expected. Based on an assumption of an intra-subject variability estimate of 20% for tmax, the sample size of 24 completed subjects would provide approximately 90% coverage probability that the half width of the 90% confidence interval (CI) for the ratio of geometric means for tmax would be within 0.116 in the log scale, which corresponds to approximately 12% of the geometric mean ratio estimate in the natural scale. Despite protocol amendments (eg, allowing patients with lower insulin doses, increasing BMI range, and permitting concomitant antihyperglycemic medications) and significant participant recruiting efforts, the study was terminated early due to difficulties recruiting this population. When the study was terminated, 11 patients were enrolled and followed through study completion. During a post-study analysis, a sample size of 11 subjects would provide at least 90% coverage probability such that the half-width of the 90% CI for the ratio of geometric means for tmax would be within 20% of the geometric mean ratio estimate in the natural scale.
Treatment
All patients received U-500R administered by a single 100-unit bolus SC injection and CSII through randomized crossover design. For CSII administration, U-500R bolus dose was administered via the investigational U-500 pump, which took approximately 13 to 14 minutes. The U-500 pump was programmed to reflect dosage in clinical practice, and a 12-hour basal 4.25 units/hour U-500R infusion was administered overnight prior to the 100-unit U-500R bolus, then continued at the same basal infusion rate during the 24-hour euglycemic clamp procedure following the bolus dose. For SC injection, U-500R was administered as a single injection at the beginning of the euglycemic clamp procedure. As U-500R CSII administration typically includes both basal infusion rates through the day and bolus doses at meal-times, the data provided a good representation for this particular treatment regimen. On the other hand, when U-500R is given as MDI, it is typically dosed either twice- (BID) or thrice-daily (TID) SC, as it has demonstrated both prandial and basal activity.3,4,7 The inclusion of a basal insulin infusion in the CSII arm only, but not in the SC injection arm, allowed us to assess the PK and PD of U-500R for both administration methods in the real-world dosing paradigm. Patients were permitted to take their pre-study oral antihyperglycemic agents (eg, metformin, pioglitazone, and/or sulfonylureas) at pre-study doses throughout the study, except on clamp assessment days. Any previous insulin was discontinued prior to starting study treatment.
Euglycemic Glucose Clamp Procedure
Patients fasted for 12 hours prior to the euglycemic clamp initiation (Day 1) until completion of the 24-hour clamp procedure (Day 2). Pre-study insulin was taken at approximately the same time each day prior to and between each visit and was stopped at least 15 hours prior to clamp initiation to allow washout and prevent insulin carryover. Overnight, all subjects had their plasma glucose (PG) stabilized, using an insulin lispro and/or glucose drip, to a target fasting PG concentration of 120 mg/dL (6.7 mmol/L) (with an acceptable range of 100 to 130 mg/dL). During the euglycemic glucose clamp, the glucose infusion rate (GIR) was adjusted every minute to maintain PG within ±5% of 120 mg/dL (6.7 mmol/L), the predetermined glucose target value for the individual participant. GIR was documented throughout the 24 hours. The euglycemic clamp procedure was performed using a Biostator®, which is an automated clamp device. Thus, blood glucose concentrations were kept constant while GIR varied; the varying GIR reflected the PD activity of insulin. All measurable GIR data (the sum of the GIR from the Biostator and the GIR from the external pump) were included in the PD analysis.
Pharmacokinetics/Pharmacodynamics
Serum samples were collected and analyzed for immunoreactive insulin (IRI) using a validated ELISA method. This method measured the total concentration of endogenous insulin as well as exogenous biosynthetic insulin after pretreatment with polyethylene glycol to remove anti-insulin antibodies. Time-matched C-peptide concentrations were also collected and used to correct serum IRI concentrations for endogenous insulin production.
For PK analyses, blood samples were collected at the following timepoints: 0 (predose), and 0.5, 1, 2, 3, 4, 5, 6, 7, 8, 12, 16, and 24 hours post-dose. PK parameters were calculated using non-compartmental methods of analysis using validated software (Phoenix WinNonlin Version 6.4, Pharsight Corporation, USA). PK parameters were reported for SC injection (100-unit bolus), CSII administration (100-unit bolus + basal infusion), as well as CSII administration (100-unit bolus alone). In order to calculate the PK parameter for the bolus dose component alone in the CSII arm, the concentrations resulting from basal infusion were adjusted from the total PK profile. If insulin concentrations from basal infusion had reached steady state by the time of clamp initiation, the insulin concentrations from basal infusion could be subtracted using baseline insulin concentrations (baseline corrected). However, it is likely that the insulin concentrations due to U-500R basal infusion had not reached steady-state after 12-hour fasting based on the half-life of U-500R observed in the study, and the insulin concentrations from basal infusion could still be increasing during the clamp procedure. Therefore, in order to more accurately account for the basal infusion, a one-compartment PK model with first order absorption using data from U-500R SC injection bolus treatment of 100 units was developed, and the estimated post hoc PK parameters were then used to simulate PK profiles following 4.25 units/hour basal infusion for each individual and to correct for the basal infusion concentrations using individual matched profiles (model corrected, Supplemental Figure 2). PK profiles for the SC injection period and the CSII period with and without basal infusion were reported. Key PK parameters included maximum drug concentration (Cmax), area under the concentration versus time curve from time zero to time t, where t is the last time point with a measurable concentration (AUC0-tlast), area under the concentration time curve from time zero to 24 hours (AUC0-24), time to maximum drug concentration (tmax), half-life associated with the terminal rate constant in non-compartmental analysis (t1/2), and the last time point with a measurable concentration (tlast).
For PD analyses (Supplemental Figure 2, panel 3), the parameters were derived from the GIR over time during the euglycemic clamp procedure as a measure of insulin effect. A locally weighted scatterplot smoothing (LOESS) function was applied to all individual GIR versus time profiles in each treatment group using TIBCO Spotfire S+ (Version 8.2). The fitted data for each participant were used to calculate the PD parameters, such as the maximum GIR (Rmax), the total amount of glucose infused over the duration of the clamp procedure (Gtot0-24), the time of maximum GIR (tRmax), the time of first non-zero value of GIR (tRonset), the time of last measurable GIR (tRlast), the time of 50% of maximum GIR before Rmax (early tRmax50), and the time of 50% of maximum GIR after Rmax (late tRmax50).
Statistical Methods
The values for AUC0-tlast, AUC0-24, Cmax, Rmax, and Gtot(0-24) were log-transformed and analyzed by a linear mixed-effects model with administration method, period, and sequence as fixed effects and the patient as a random effect. The ratios of geometric means and the 90% CI for the comparison of SC injection and CSII were presented using back-transformed difference in least squares means (LS mean) and 90% CI.
The time-action parameters (tmax, t1/2, tRmax, tRonset, tRlast, early tRmax50, late tRmax50) were analyzed using the Wilcoxon signed-rank test. Median differences between SC injection and CSII and approximate 90% CIs for the difference were calculated.
Safety
Safety parameters were listed and summarized using descriptive statistics. The frequency of treatment-emergent adverse events (AEs) was summarized by treatment and by preferred term in Medical Dictionary for Regulatory Activities (MedDRA) Version 18.0.
Results
Demographics
Patients with T2D (N = 11) participated in the study: eight male and three female between the ages of 37 and 65 with a mean (SD; range) HbA1c of 10.2% (1.08%; 8.9%-11.6%), body weight of 121.6 kg (33.5, 78.5-175.7 kg), BMI of 39.6 kg/m2 (8.6, 28.7-53.0 kg/m2), and with T2D disease duration of 12.5 years (6.9; 5.0-29 years; Supplemental Table 1), pre-study insulin total daily dose 1.1-3.2 units/kg, and total daily insulin dose of 154-410 units (mean = 229 U). Oral glucose-lowering medications are given in Supplemental Table 2.
Pharmacokinetics
The tmax values (median [range]) after a 100-unit bolus of U-500R were similar when administered via SC injection (six hours [0.5-8 hours]) or CSII (five hours [0.5-12 hours]) with or without model correction (Table 1; Figure 1). The time-course profile of insulin concentration was higher with CSII compared with SC injection due to the additional basal infusion for CSII. However, after the CSII profile was corrected for the 4.25 units/hour basal infusion using the PK modeling method, the profiles for SC injection and CSII for the 100-unit bolus dose of U-500R were similar (Table 1, Figure 1), and the Cmax and AUC0-tlast of a 100-unit bolus of U-500R were similar between SC injection and CSII (Table 1). The AUC0-tlast was 5230 pmol*h/L with SC injection and 6070 pmol*h/L with CSII. Geometric LS mean AUC0-24, AUC0-tlast, and Cmax were approximately 11%, 14%, and 8% lower, respectively, following SC administration compared with CSII; however, the differences were not statistically significant with the 90% CI of each ratio of LS means including 1 (Supplemental Table 3).
Pharmacokinetic Parameters After Administration of 100-Unit Bolus of U-500R.
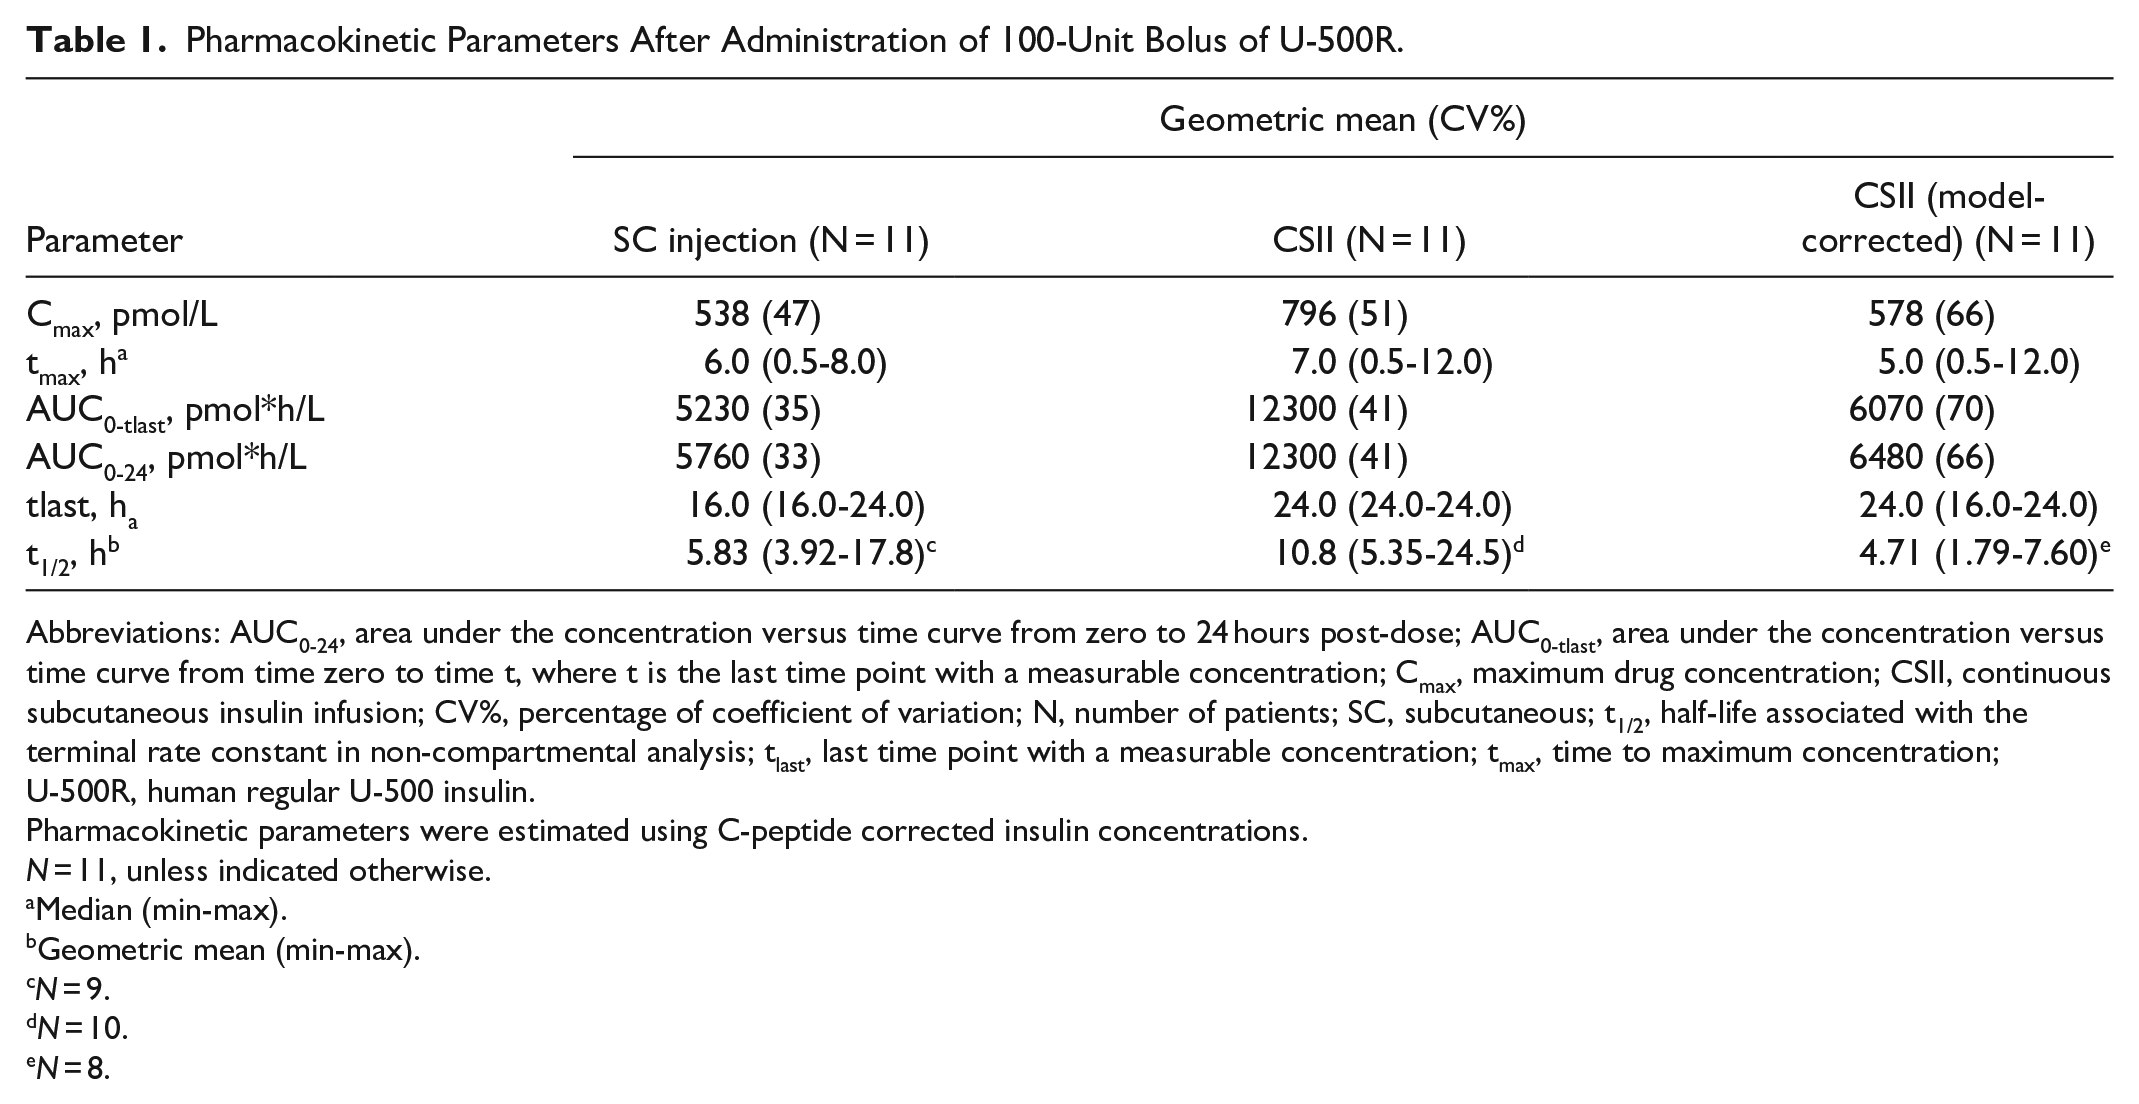
Abbreviations: AUC0-24, area under the concentration versus time curve from zero to 24 hours post-dose; AUC0-tlast, area under the concentration versus time curve from time zero to time t, where t is the last time point with a measurable concentration; Cmax, maximum drug concentration; CSII, continuous subcutaneous insulin infusion; CV%, percentage of coefficient of variation; N, number of patients; SC, subcutaneous; t1/2, half-life associated with the terminal rate constant in non-compartmental analysis; tlast, last time point with a measurable concentration; tmax, time to maximum concentration; U-500R, human regular U-500 insulin.
Pharmacokinetic parameters were estimated using C-peptide corrected insulin concentrations.
N = 11, unless indicated otherwise.
Median (min-max).
Geometric mean (min-max).
N = 9.
N = 10.
N = 8.
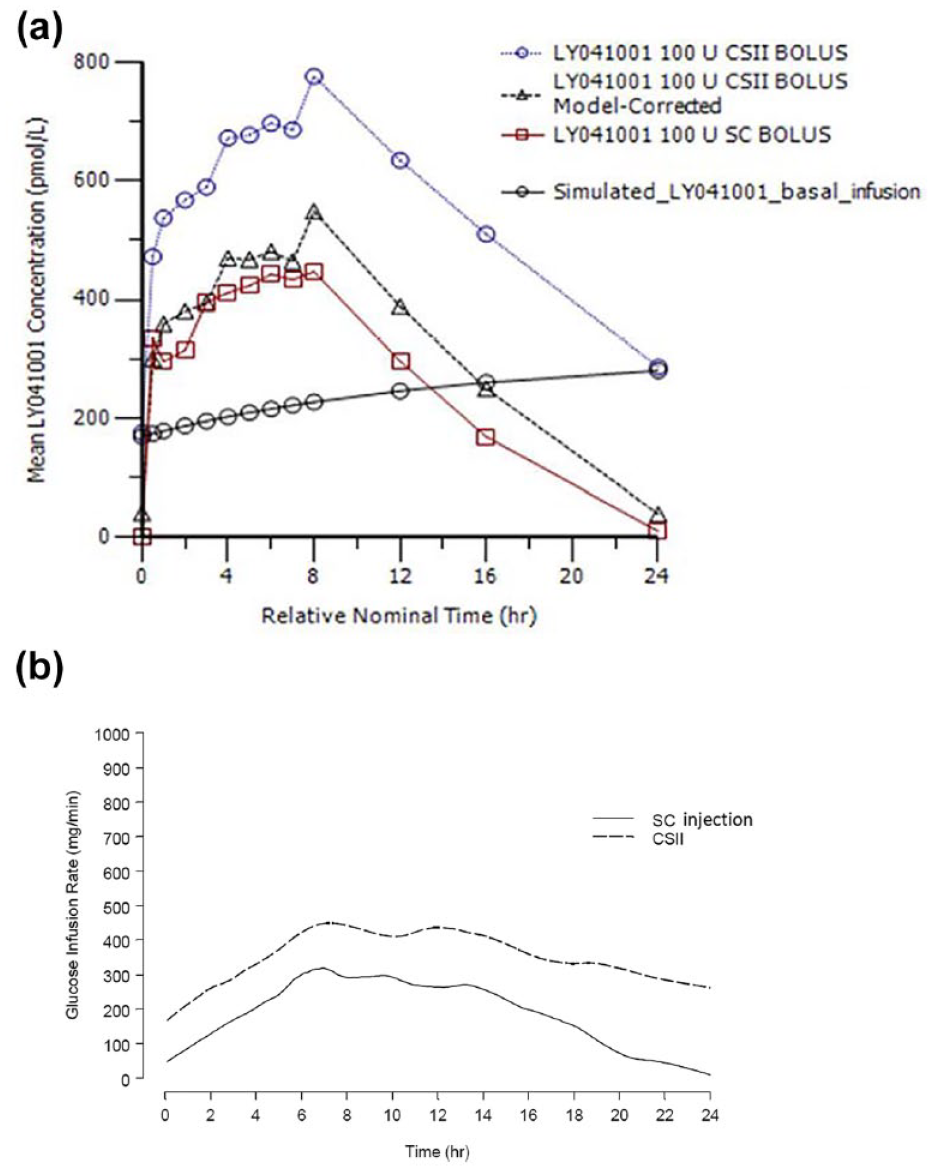
Pharmacokinetic and pharmacodynamic profiles. (a) PK time course profile following a 100-unit bolus of U-500R insulin by SC injection, CSII (before and after the profile was corrected for the 4.25 units/hour basal infusion using PK modeling method) and the simulated insulin profile from continuous basal infusion for CSII. (b) PD profile as measured by GIR following a 100-U bolus of U-500R insulin by SC injection and CSII.
Pharmacodynamics
The GIR from the euglycemic clamp was consistent with the PK profile (Table 2; Figure 1). tRmax after a 100-unit bolus of U-500R was similar when administered via SC injection or CSII. There was no statistically significant difference in time-action parameters such as tRmax, early tRmax50, or late tRmax50 between SC injection and CSII with the 90% CI for the differences all containing zero (Table 2). Rmax and Gtot were higher with CSII as expected due to the basal infusion. The ratios of GIR (Rmax and Gtot) between CSII and MDI were similar to the ratios of the PK parameters (Cmax and AUC0-24).
Pharmacodynamic Parameters After Administration of 100-Unit Bolus of U-500R.
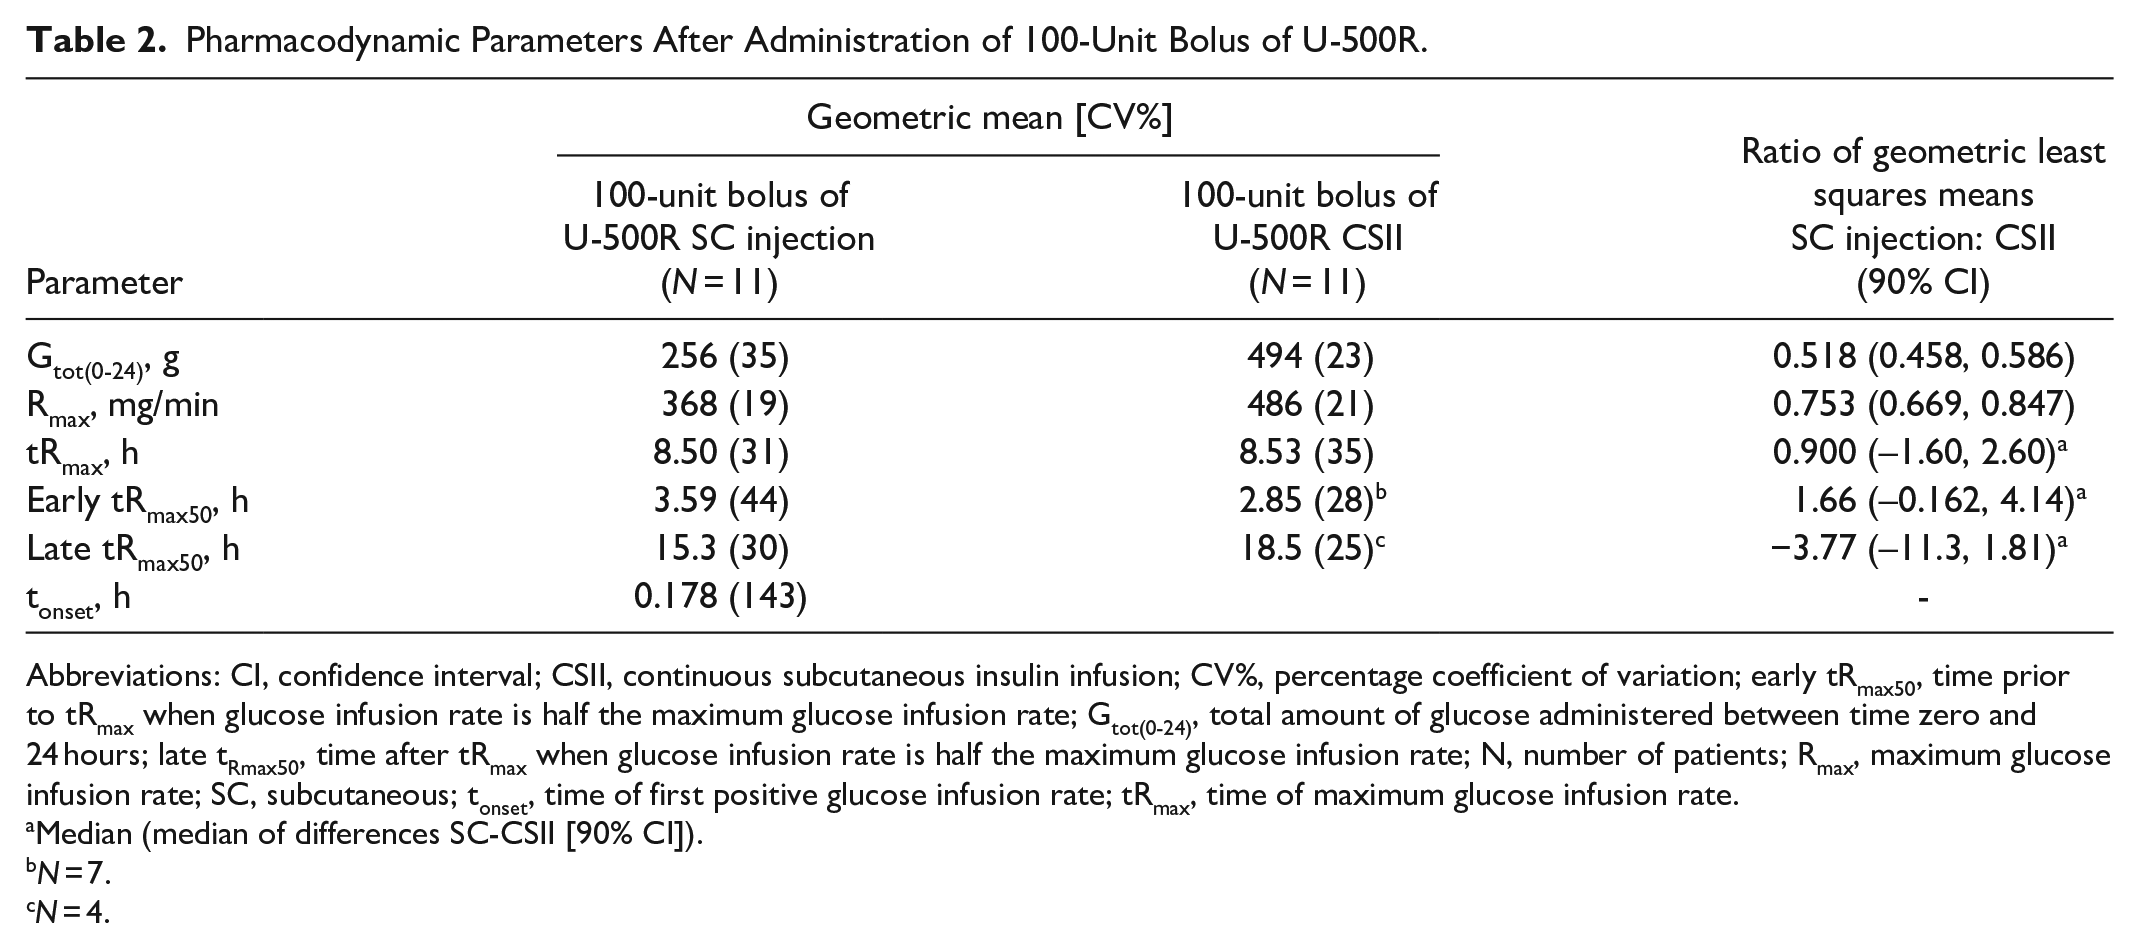
Abbreviations: CI, confidence interval; CSII, continuous subcutaneous insulin infusion; CV%, percentage coefficient of variation; early tRmax50, time prior to tRmax when glucose infusion rate is half the maximum glucose infusion rate; Gtot(0-24), total amount of glucose administered between time zero and 24 hours; late tRmax50, time after tRmax when glucose infusion rate is half the maximum glucose infusion rate; N, number of patients; Rmax, maximum glucose infusion rate; SC, subcutaneous; tonset, time of first positive glucose infusion rate; tRmax, time of maximum glucose infusion rate.
Median (median of differences SC-CSII [90% CI]).
N = 7.
N = 4.
Safety
There were no reported severe hypoglycemic events or serious AEs, and no discontinuation due to AEs. AE frequency was comparable between SC injection and CSII for all causalities.
Discussion
In patients with T2D, there have been very few studies performed to understand the PK and PD for insulin administered by CSII, even for U-100R insulin. Although the PK/PD characteristics of U-500R by bolus SC injection were studied in healthy obese participants, 4 this is the first PK/PD study to compare bolus SC injection with CSII administration of U-500R in patients with T2D requiring high-dose insulin. This study is also unique for U-500R to be given by an investigational U-500-specific pump (Omnipod U-500 Insulin Management System).
Although the PK and PD profiles showed a greater insulin concentration and effect following the 100-unit bolus with CSII compared to SC injection, this was primarily due to the additional basal infusion rate with CSII. After correction for the basal infusion, the 100-unit bolus portion of the U-500R resulted in similar time-action profiles for CSII and SC injection. In addition, the less than 15-minute onset of action observed with bolus SC injection in this study of insulin resistant patients with T2D was similar to that observed previously in obese healthy participants. 4
A PK-model correction method was used to correct basal infusion data using a model-predicted PK profile from patients who were treated with 100-units of U-500R with CSII. Serum insulin concentrations following CSII administration were higher at 24-hours post-bolus dose (in contrast, insulin concentrations following SC bolus administration had returned to baseline), suggesting that after 12 hours of continuous infusion, basal U-500R concentrations had not yet reached steady state. Subtraction of the pre-bolus dose concentrations before steady state could not, therefore, correct for the actual concentration of insulin contributed by the basal infusion at each time point, as it continued to increase during the euglycemic clamp period. An alternative method of correction, subtracting individual predicted concentrations of insulin contributed by the basal infusion of U-500R at each time point based on PK modeling was therefore applied. This model-correction method provided more accurate profiles of the insulin concentrations after U-500R administration by separating the concentration of basal infusion from the 100-unit bolus dose. These findings indicate that, after accounting for the contributions from the basal insulin infusion, the PK profiles of U-500R given as bolus by CSII or MDI are comparable at 100 units.
As the PK of U-500R has a prolonged tail, as shown in this study and de la Peña et al, 4 each time when adjusting the basal insulin infusion rate, it takes 24 hours or more before a new steady state is reached. When administered with a pump, each meal bolus of U-500R may also stack up on the basal insulin being infused. The consequences of this stacking can potentially expose patients to more insulin than is required. This risk of stacking is more likely in the first few days of CSII when the insulin being administered is still reaching steady state. Therefore, for patients treated with CSII, physicians should be mindful of ongoing basal infusion when interpreting blood glucose levels and dose adjustment.
Another pilot study assessing U-500R characteristics was published by Shrestha et al in a similar population of obese, insulin-resistant patients with T2D (N = 12) with high-dose insulin requirements. 13 In that study, however, patients were overtly hyperglycemic and around 40 mg/dL higher than their target glucose for clamp procedure. The GIR was adjusted less frequently, only every 15-60 minutes. The tonset measured by the GIR initiated during 0-4 hours was confounded by progressive decline in glucose over the first four hours when the euglycemia target was not achieved, indicating that the tonset should be earlier than that reported. The glucose concentrations dropped quickly after U-500R administration with a rise in insulin levels as early as the first measuring time point, suggesting that the onset of action is faster. This does not support the authors’ assertion that U-500R should not be a premeal bolus insulin with action one to two hours after meals to prevent hyperglycemia. 13 A quality euglycemic clamp study should have a stable target glucose to enable the correct interpretation of data, a situation not achieved in the Shrestha study, thus confounding any interpretation of the GIR data. Results from Shrestha et al 12 differ from the finding of an onset of action within less than 15 minutes observed in the MDI arm of this study as well as in a previous study in healthy obese patients with diabetes, 4 wherein the GIR was adjusted every minute and the glucose concentrations were kept in euglycemic range during the entire clamp procedure.
A major limitation of this study is the small sample size (due to the early termination of the study caused by slow enrolment, despite the implementation of measures to improve this), and the statistical inference should be interpreted with caution. Also, only the 100-U dose was studied and patients enrolled in this study were on relatively lower doses of insulin (TDD ≥150 units/day), compared with high-dose insulin patients in a previously published study (mean TDD 287.5 units/day). 8 Last but not least, despite the objective to study U-500R PK and PD under real-world dosing paradigms, the extra steps of modeling correction to characterize the insulin concentration profile following bolus dose for CSII might have added uncertainty or bias into the comparison, which needs to be addressed in future studies.
Conclusion
In adults with T2D and high-dose insulin requirements, the time-action parameters were similar after administration of a 100-unit bolus dose of U-500R with an investigational U-500R calibrated insulin pump (Omnipod U-500 System) and SC injection. Data in the present report add to the scientific knowledge regarding the PK and PD profiles of U-500R delivered by either CSII or SC injection in patients with T2D with high-dose insulin requirements and may further inform clinicians regarding appropriate usage in this patient population. U-500R delivered by CSII in a dedicated pump device could be a viable option for patients requiring high doses of insulin in the future.
Supplemental Material
sj-pdf-1-dst-10.1177_1932296820972719 – Supplemental material for Pharmacokinetics and Pharmacodynamics of Human Regular U-500 Insulin Administered via Continuous Subcutaneous Insulin Infusion Versus Subcutaneous Injection in Adults With Type 2 Diabetes and High-Dose Insulin Requirements
Supplemental material, sj-pdf-1-dst-10.1177_1932296820972719 for Pharmacokinetics and Pharmacodynamics of Human Regular U-500 Insulin Administered via Continuous Subcutaneous Insulin Infusion Versus Subcutaneous Injection in Adults With Type 2 Diabetes and High-Dose Insulin Requirements by Xiaosu Ma, Charles T. Benson, Randy Prescilla, Shuyu Zhang, Helle Linnebjerg, Elizabeth S. LaBell, Linda A. Morrow, Jeffrey A. Jackson, Alex Nguyen, Liza L. Ilag, Jennal L. Johnson and Derek Leishman in Journal of Diabetes Science and Technology
Footnotes
Acknowledgements
The authors would like to acknowledge Insulet Corporation for supplying the pumps and training for the study and Gina Moore, Syneos Health, for writing and editorial assistance.
Abbreviations
AEs, adverse events; AUC0-24, area under the concentration versus time curve from zero to 24 hours postdose; AUC0-tlast, area under the concentration versus time curve from time zero to time t, where t is the last time point with a measurable concentration; BID, twice daily; BMI, body mass index; CI, confidence interval; Cmax, maximum drug concentration; CSII, continuous subcutaneous insulin infusion; CV%, percentage of coefficient of variation; early tRmax50, time prior to tRmax when glucose infusion rate is half the maximum glucose infusion rate; GIR, glucose infusion rate; Gtot(0-24), total amount of glucose administered between time zero and 24 hours; IRI, immunoreactive insulin; late tRmax50, time after tRmax when glucose infusion rate is half the maximum glucose infusion rate; LOESS, locally weighted scatterplot smoothing; LS, least squares; MDI, multiple daily injections; MedDRA, Medical Dictionary for Regulatory Activities; N, number of patients; PD, pharmacodynamic; PK, pharmacokinetic; Rmax, maximum glucose infusion rate; SC, subcutaneous; SC, subcutaneous; T2D, type 2 diabetes; t1/2, half-life associated with the terminal rate constant in non-compartmental analysis; TID, thrice daily; tlast, last time point with a measurable concentration; tonset, time of first positive glucose infusion rate; tRmax, time of maximum glucose infusion rate; U-500R, human regular U-500 insulin.
Author Contributions
JLJ, XM, DL, HL, JAJ, LM participated in designing the study.
HL, XM, SZ, ESL, JJ, LLI, RP, AN, LM conducted experiments and analyzed data.
All authors contributed to writing the manuscript.
All authors reviewed and edited this manuscript.
Preliminary results were presented at the American Diabetes Association 78th Scientific Sessions, Orlando, FL, June 22-26, 2018.
Declaration of Conflicting Interests
The author(s) declared the following potential conflicts of interest with respect to the research, authorship, and/or publication of this article: Xiaosu Ma, Charles T. Benson, Shuyu Zhang, Helle Linnebjerg, Elizabeth S. LaBell, Liza L. Ilag, Jennal L. Johnson, and Derek Leishman are employees and stockholders of Eli Lilly and Company. Jeffrey A. Jackson is a former employee and minor stockholder of Eli Lilly and Company. Alex Nguyen is an employee and stockholder of Insulet Corporation. Randy Prescilla is a former employee of Eli Lilly and Company and an employee of Sanofi Genzyme in Cambridge, MA. Linda Morrow is an employee and stockholder of ProSciento, Inc.
Funding
The author(s) disclosed receipt of the following financial support for the research, authorship, and/or publication of this article: The study was sponsored by Eli Lilly and Company.
Ethics Approval
This study was conducted in accordance with consensus ethics principles derived from international ethics guidelines, including the Declaration of Helsinki and Council for International Organizations of Medical Sciences International Ethical Guidelines, the International Conference on Harmonization Good Clinical Practice Guideline (E6), and applicable laws and regulations. All participants provided their informed consent, and the protocol was approved by the Ethical Review Board.
Data Availability Statement
Eli Lilly and Company provides access to all individual participant data collected during the trial, after anonymization, with the exception of pharmacokinetic or genetic data. Data are available to request six months after the indication studied has been approved in the US and EU and after primary publication acceptance, whichever is later. No expiration date of data requests is currently set once data are made available. Access is provided after a proposal has been approved by an independent review committee identified for this purpose and after receipt of a signed data sharing agreement. Data and documents, including the study protocol, statistical analysis plan, clinical study report, and blank or annotated case report forms, will be provided in a secure data sharing environment. For details on submitting a request, see the instructions provided at ![]() .
.
Supplemental Material
Supplemental material for this article is available online.
References
Supplementary Material
Please find the following supplemental material available below.
For Open Access articles published under a Creative Commons License, all supplemental material carries the same license as the article it is associated with.
For non-Open Access articles published, all supplemental material carries a non-exclusive license, and permission requests for re-use of supplemental material or any part of supplemental material shall be sent directly to the copyright owner as specified in the copyright notice associated with the article.