
Abstract
Background:
Each measurement is subject to measurement uncertainty (MU). Consequently, each measurement of plasma glucose concentration used for diagnosis and monitoring of diabetes mellitus (DM) is affected. Although concepts and methods of MU are well established in many fields of science and technology, they are presently only incompletely implemented by medical laboratories, neglecting MU of target values of internal quality control (IQC) materials.
Methods:
An empirical and practical approach for the estimation of MU based on the analysis of routine IQC using control samples with assigned target values is presented. Its feasibility is demonstrated exemplarily by analyzing IQC data from one year obtained for glucose employing the hexokinase method with IQC of two different concentrations.
Results:
Combined relative extended (k = 2) MU comprising bias, coefficient of variation (CV), and MU of the target values assigned to control materials were about 9% with a lower (~ 56 mg/dL; ~3.1 mmol/L) and 8% with a higher (~ 346 mg/dL; ~19.2 mmol/L) concentration sample, analyzing IQC of one year from three different devices.
Conclusions:
Estimation of MU in this study is quite reliable due to the large number of IQC data from one year. The MU of the target values of the commercial control material in this study was considerably larger than other MU contributions, ie, standard deviation and bias. In the future, the contribution of MU of commercial IQC should be addressed more carefully and technologies to measure glucose should be geared toward smaller MU possible, as needed, especially for glucose concentration measurements in diagnosis and management of DM.
Keywords
Introduction
Plasma glucose concentration measurements are essential in diagnosis and management of diabetes mellitus (DM). Consequently, requirements for analytical quality need to be adequate for this purpose. For diagnosis of DM, the measured plasma glucose is compared to fixed cutoffs that apply all over the world.1,2 Under ideal circumstances, a patient sample would receive the same result eg, for plasma glucose, regardless of the medical laboratory used. This is a prerequisite to use commonly defined guidelines and recommendations, containing well-defined and globally applied cutoff values. In reality, however, the results will differ and the true value 3 of a measurand like the plasma glucose concentration cannot be determined, regardless of the method used or the effort spent. Depending on the country, a deviation of about ±10% to ±15% from the target value is allowed.4,5 Applied to a patient sample sent to a randomly chosen medical laboratory, results may vary between 113.5 mg/dL (6.3 mmol/L) and 138.7 mg/dL (7.7 mmol/L) if the “true” value of the sample was 126.1 mg/dL (7.0 mmol/L). Some countries allow even larger deviation in their external quality control schemes of up to 15%.
As a quantitative indication of closeness of a measurement result to the true value, the concept of measurement uncertainty (MU)6,7 was developed and has been accepted widely during recent years. To demonstrate the current variability and consequences of MU of plasma glucose measurements, it is helpful to look at data from external quality assurance programs.8,9 Despite all efforts to harmonize results, eg, by using reference methods for target value assignments in external quality control schemes, target values for internal quality controls (IQCs) are generally not assigned using reference methods. Reference methods are highly accurate measurement procedures with a clearly smaller MU compared to routine methods for a given measurand. 3 Poor target value assignment for IQCs is, at present, rarely considered a contribution to MU.
Despite the unavoidable presence of MU, technologies to measure glucose should be geared toward smaller MU, as needed. In addition, the complete MU needs to be considered in order to provide sufficient care for DM patients. In this article, we propose an empirical approach for the estimation of MU and its different components based on frequent (daily) IQC data. In addition to commonly considered contributions of bias and imprecision, we include the MU of commercial control samples, called target value uncertainty (TVU) in the following, as an important input to the overall MU.
Methods
The basic considerations and concepts of MU have been laid down in the Guide to the Expression of Uncertainty in Measurement (GUM)6,7 of the International Organisation for Standadisation and the International Electrotechnical Commission (ISO/IEC). For details of GUM and its application to laboratory medicine, we refer the interested reader to other sources.8-13
The GUM allows a variety of methods to estimate MU, which usually comprises several components. In brief, some of them may be determined by a top-down or so-called Type-A method, ie, investigation of the statistical distribution and variability of results with the help of repeated measurements under repeating conditions. The MU is given by the standard deviation in this case and is often called the standard measurement uncertainty. This may be used as MU of other measurements with the same method under the same conditions.
Since direct observation of the variability of results is not always feasible for estimation of standard MU, there is alternately a Type-B method, which is a bottom-up approach to harness all other type of information about the probability distribution of the results around the unknown true value. This information could be uncertainties stated in calibration certificates of measuring devices used (eg, balances, pipettes, thermometers etc.), could be due to digitization of quantity values, or could be a known systematic measurement deviation—to just mention a few examples. A Type-B MU is estimated by analyzing all potential sources and components contributing to the uncertainty and combining them in a mathematical model of the measurement process to yield the combined MU for the whole process. Although the Type-B approach is applicable universally, the mathematical model of the measuring procedure may become complex easily and analyzing the uncertainty budget could be unhandy.
On the other hand, it is very common in laboratory medicine to employ control samples with known target values for IQC. Hence, these IQC data can be analyzed easily to estimate the MU of a measuring procedure based on (mainly) the Type-A method, if the control material behaves very similar to patient samples. In fact, a combined MU, complementing the Type-A method with Type-B information about the MU of the target value of the control material, is proposed as follows.
Consider a medical laboratory frequently performing IQC for a certain measurand
The three components contributing to the MU are given by
(I) the standard deviation
(II) bias
(III) the target value uncertainty (TVU)
The number of IQC results analyzed per control sample is denoted as
Although strict interpretation of GUM requires that all results are corrected for known bias,
14
this correction is usually not common in laboratory medicine as well as in other analytical measurements for several good reasons.15-17 Some of them are evident as well with the practical examples discussed below. Hence, we follow the procedures to estimate MU consistent with GUM, but without correcting bias, as described in references.15,16 Accordingly, the bias of a method could be estimated as mean bias
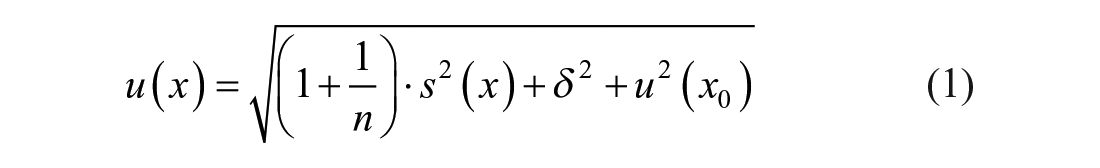
For practical reasons, the MU is commonly used to state an interval of measurement values in which the true value is believed to lie in with a high (typically 95%) probability. This interval is calculated with the help of the extended measurement uncertainty

where
Results
The MU per eqn. (1) has been exemplarily estimated by analyzing IQC data from one year obtained in one laboratory on three different instruments of the same type (Dimension Vista, Siemens Healthineers, Eschborn, Germany) for glucose employing the hexokinase method with control samples of two different concentrations (A and B). In total, 2291 results of samples A and B obtained with all three devices have been analyzed. First, the data for each device and control sample were approved to be normally distributed. The monthly means observed with each device for both control samples are shown in Figure 1. The average number of results per month for each mean was approximately n = 32 (range 25-37). The error bars shown in Figure 1 display the standard deviations of the mean and are of the same size as the symbols in this representation. Results are all quite close to the assigned target values of the control samples.
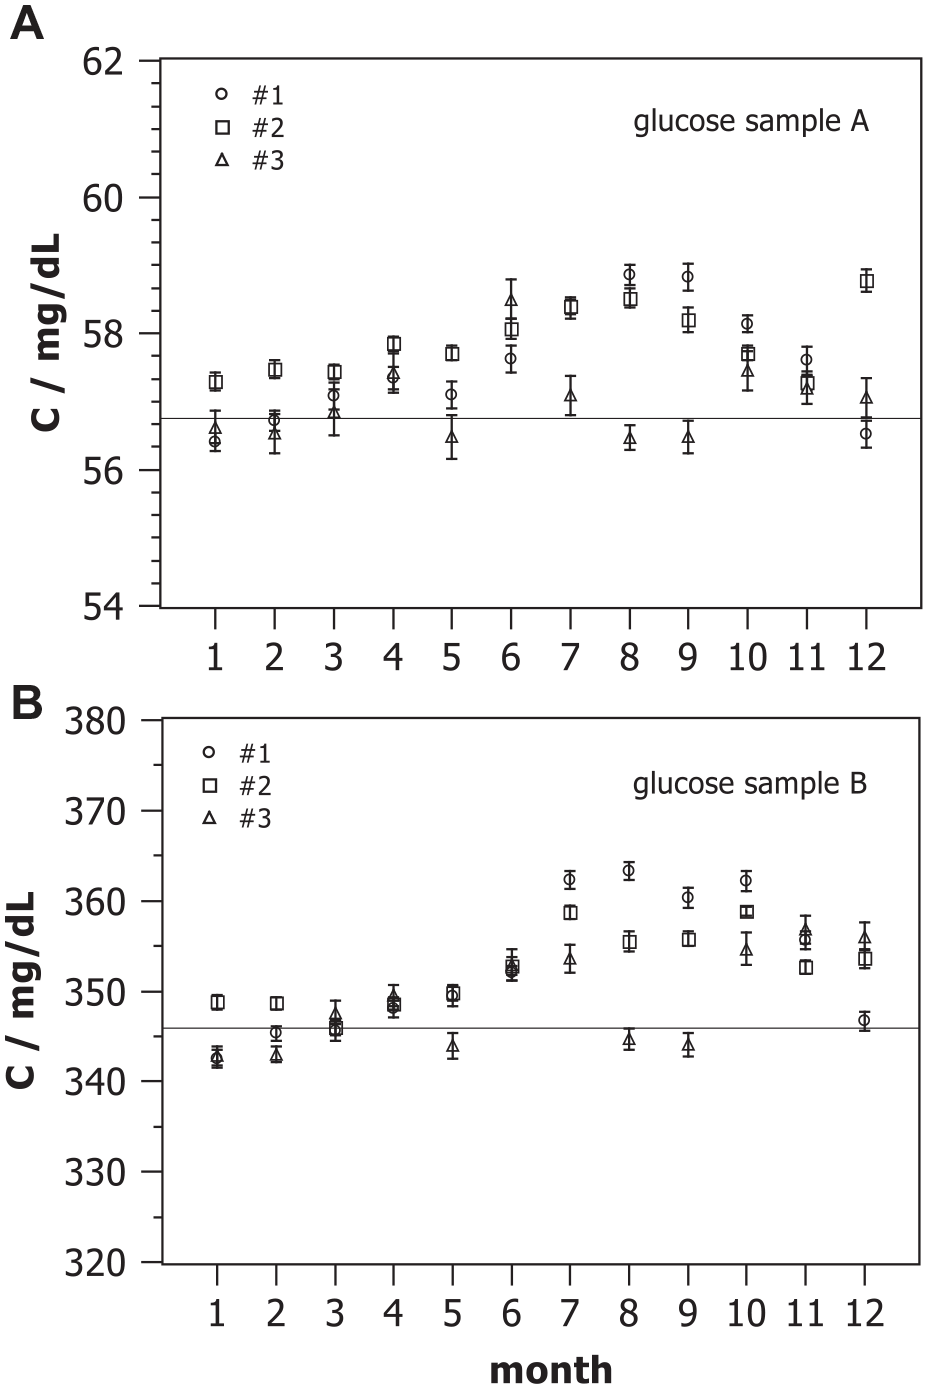
Monthly means of glucose concentration measured with three devices #1, #2, and #3 on two control samples A (
Figure 2 shows monthly coefficients of variation
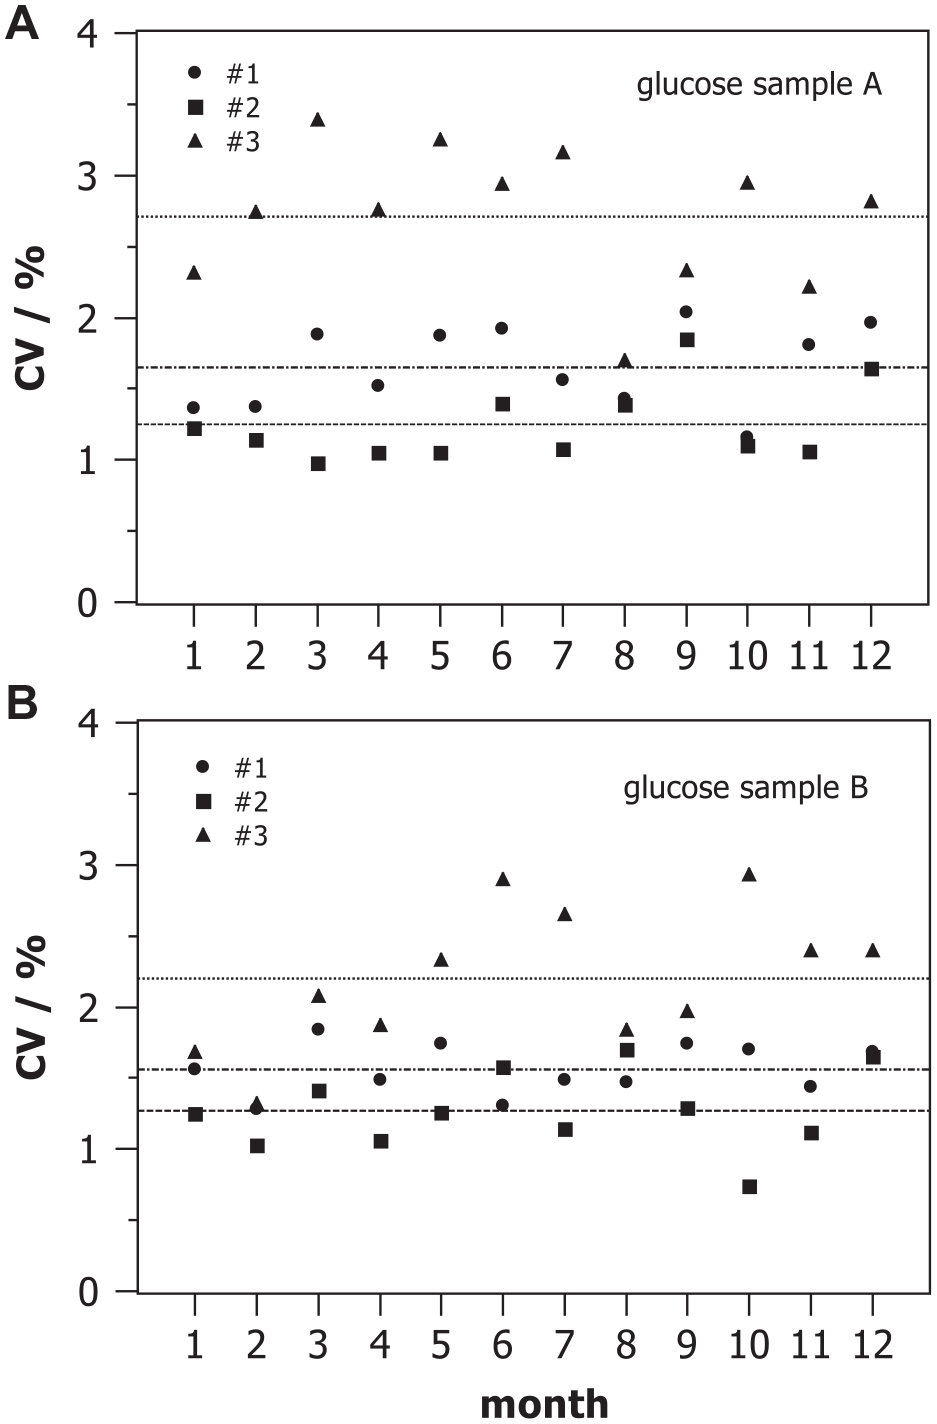
Monthly coefficient of variation of glucose concentrations measured with three devices #1, #2, and #3 on two control samples A and B of different concentration during internal quality control.
Figure 3 displays the monthly relative systematic deviation
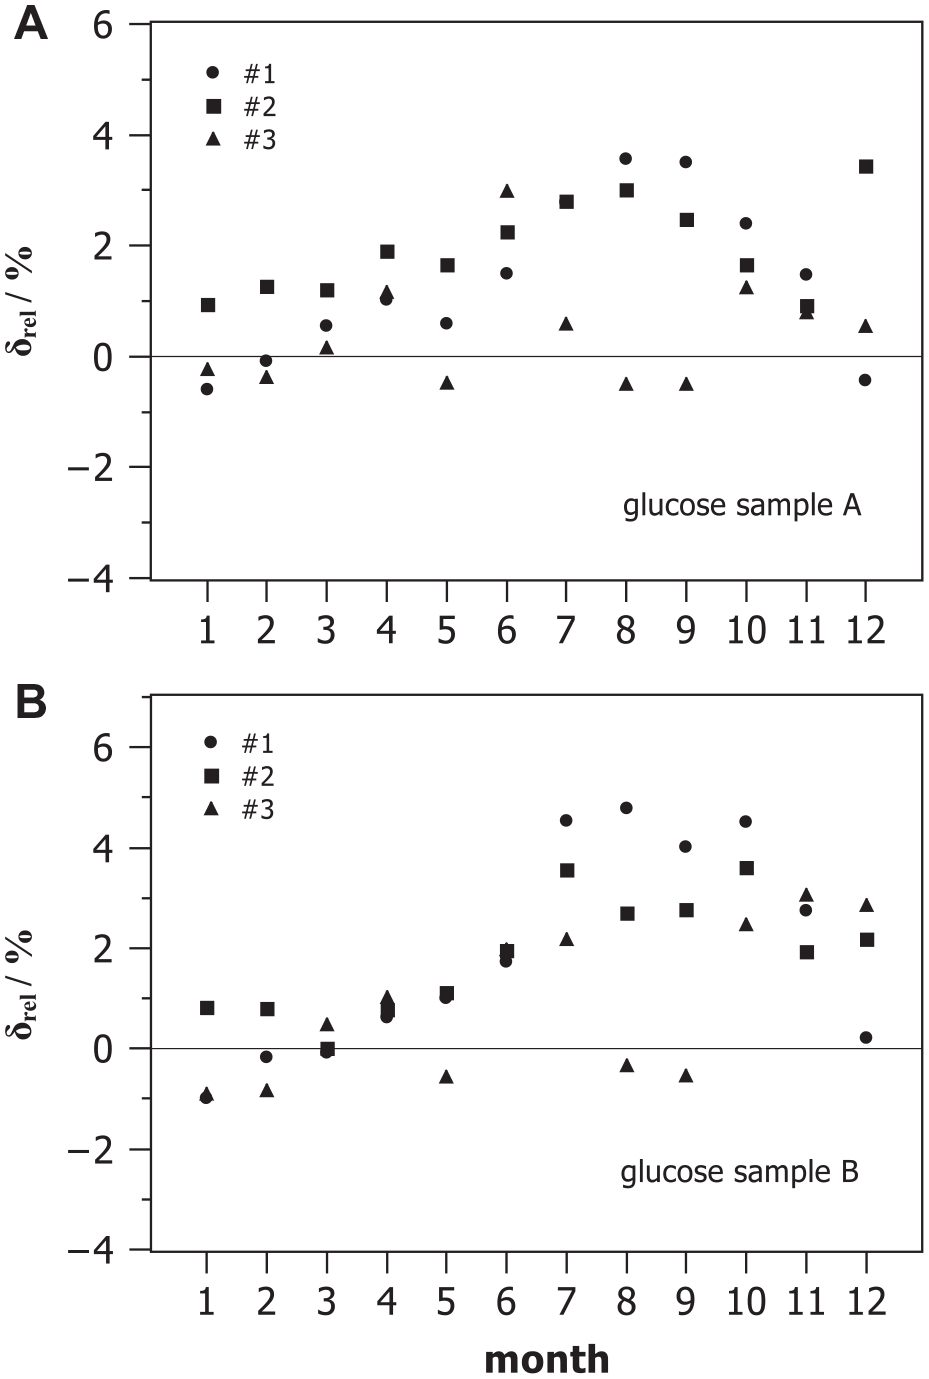
Monthly relative measurement deviation between measured mean glucose concentrations and target values of two control samples A and B during internal quality control observed with three devices #1, #2, and #3.
With the help of the results shown in Figures 2 and 3, we estimated the monthly combined MU considering the three components, ie, the analytical MU of the laboratory, the bias, and the MU of the target value, as given with eqn. (1), provided the uncertainties of the target values of the controls are known. For the control samples under discussion, the manufacturer provided specific
Analysis of IQC Data for Glucose (Hexokinase Method) with Two Control Samples on Three Devices for One Year.
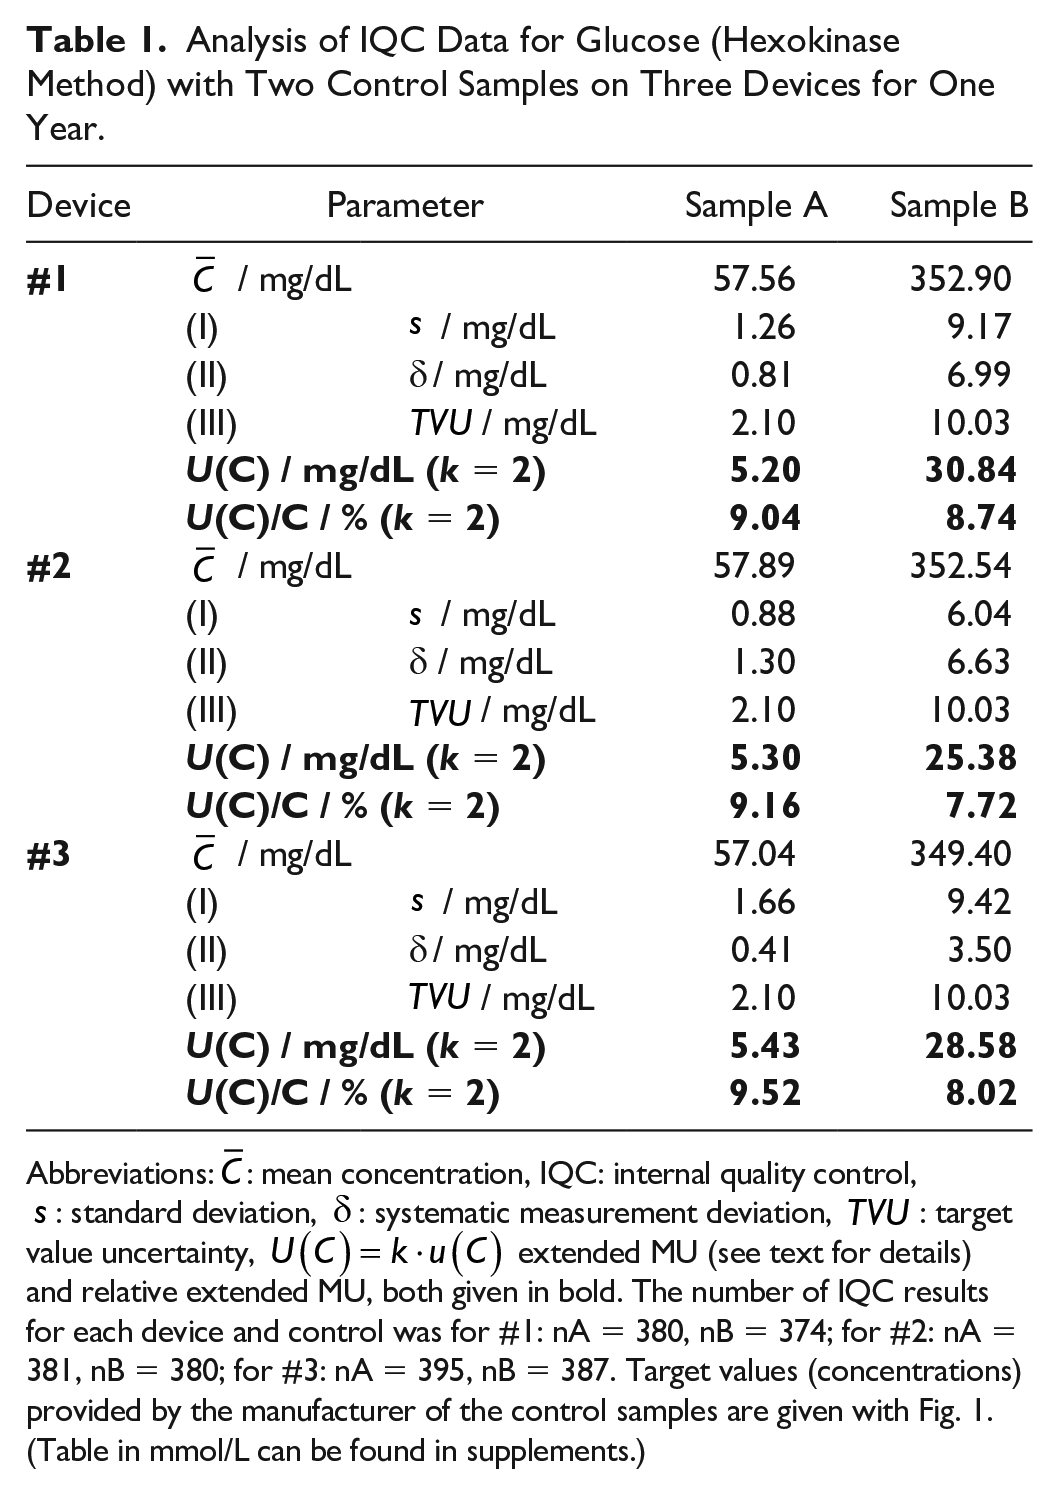
Abbreviations:
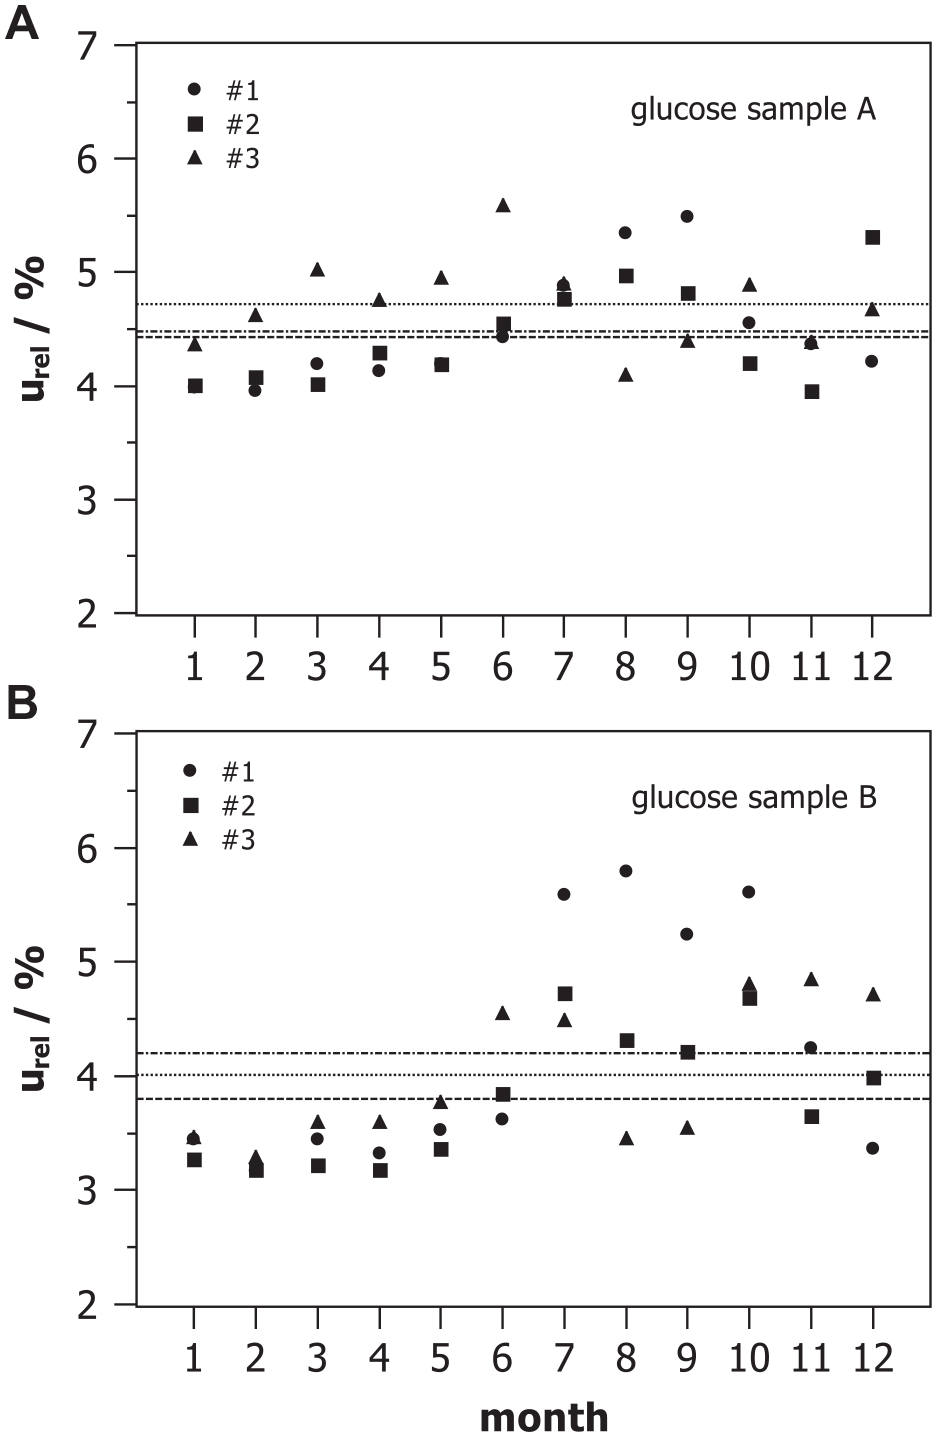
Monthly relative combined measurement uncertainty estimated for three devices #1, #2, and #3 with two control samples A and B from internal quality assessment.
Discussion
The combined MU as shown in Table 1 may be used as MU of other measurements with the same method under the same conditions if data are normally distributed. It was checked that at least 95% of the results were within the range
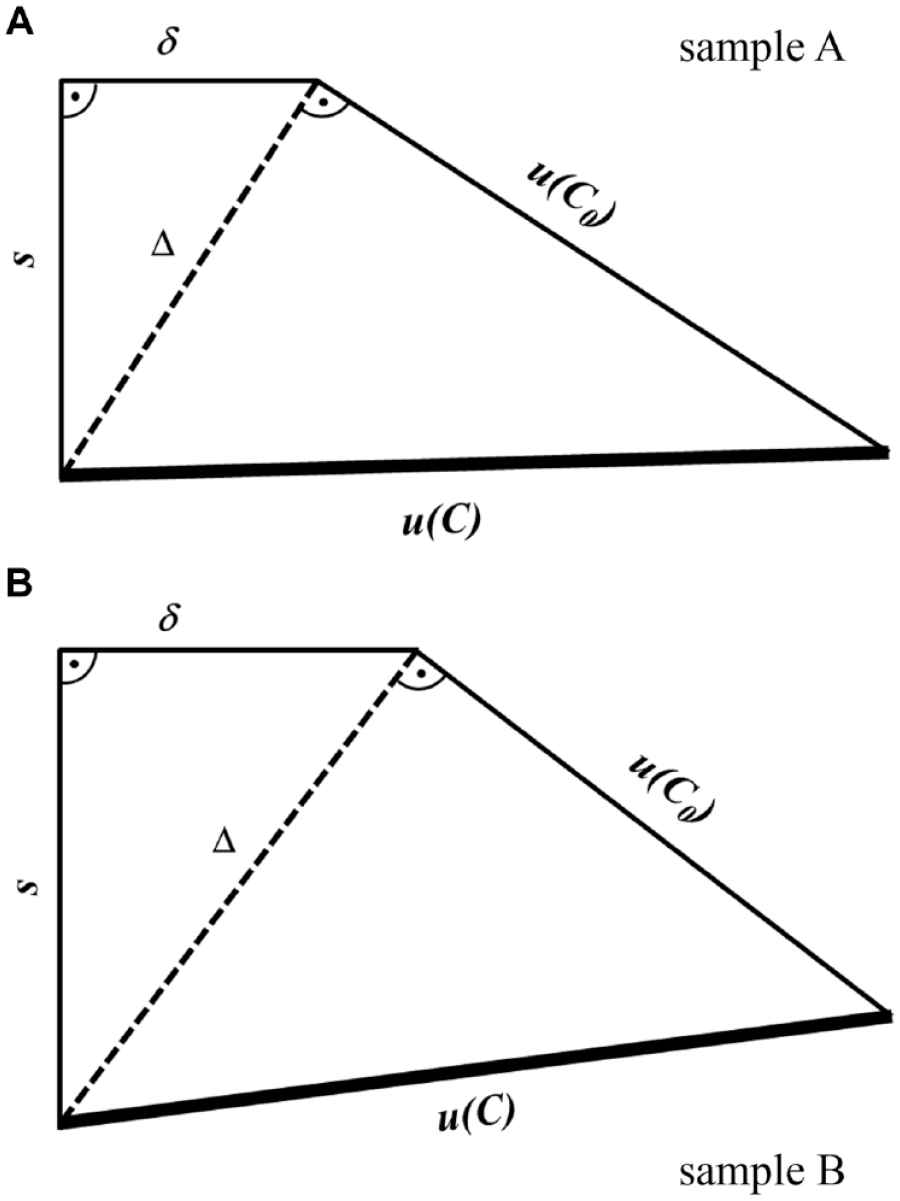
Geometric representation of quantitative contributions of (I) standard deviation s, (II) bias
For large n, the quantity
Based on MU as proposed here, accuracy and quality of measurement results in laboratory medicine can be estimated in a comparable and practical way. “Normal” analytical variations can be distinguished from other variations. Proper consideration of MU allows for a comparison and assessment of test results with a reference value or with clinical decision limits based on clear statements about the level of significance. With the help of MU, serial test results may be assessed whether they are different (or not) with a certain level of significance, as well. A practical conclusion from that is that MU should be the relevant parameter to derive so-called minimal differences20,21 rather than CV alone.
Official requirements and frequently monitoring of combined MU bear the potential to improve analytical quality of quantitative measurands. Especially for key measurands such as plasma glucose, this can improve patient care for both diagnosis and management of DM. The success of these efforts could be monitored by quality assurance schemes.
Conclusion
All measurements, including those for plasma glucose concentration, are subject to MU. It is important to know and report a reliable and complete MU in order to be able to meet the needs eg, in the diagnosis and management of DM. Employing an empirical and practical approach for the estimation of MU based on analysis of multiple data usually obtained during daily routine IQC using control samples with assigned target values is proposed. TVU of the commercial control materials used with the data set investigated was considerably larger than standard deviation and bias of the measurement procedure. This in turn has a negative impact on the combined MU of medical laboratory results. This problem should be addressed more carefully in the future eg, by legal and normative regulations.
Supplemental Material
sj-pdf-1-dst-10.1177_1932296820966353 – Supplemental material for Disregarded Measurement Uncertainty Contributions and Their Magnitude in Measuring Plasma Glucose
Supplemental material, sj-pdf-1-dst-10.1177_1932296820966353 for Disregarded Measurement Uncertainty Contributions and Their Magnitude in Measuring Plasma Glucose by Astrid Petersmann, Rainer Macdonald and Matthias Nauck in Journal of Diabetes Science and Technology
Supplemental Material
sj-pdf-2-dst-10.1177_1932296820966353 – Supplemental material for Disregarded Measurement Uncertainty Contributions and Their Magnitude in Measuring Plasma Glucose
Supplemental material, sj-pdf-2-dst-10.1177_1932296820966353 for Disregarded Measurement Uncertainty Contributions and Their Magnitude in Measuring Plasma Glucose by Astrid Petersmann, Rainer Macdonald and Matthias Nauck in Journal of Diabetes Science and Technology
Supplemental Material
sj-tif-1-dst-10.1177_1932296820966353 – Supplemental material for Disregarded Measurement Uncertainty Contributions and Their Magnitude in Measuring Plasma Glucose
Supplemental material, sj-tif-1-dst-10.1177_1932296820966353 for Disregarded Measurement Uncertainty Contributions and Their Magnitude in Measuring Plasma Glucose by Astrid Petersmann, Rainer Macdonald and Matthias Nauck in Journal of Diabetes Science and Technology
Footnotes
Abbreviations
CV, coefficient of variation; DM, diabetes mellitus; GUM, Guide to the Expression of Uncertainty in Measurement; IQC, internal quality control; Rili-BAEK, Guideline of the German Medical Association on Quality Assurance in Medical Laboratory Examinations; MU; measurement unscertainty; TVU, target values.
Declaration of Conflicting Interests
The author(s) declared no potential conflicts of interest with respect to the research, authorship, and/or publication of this article.
Funding
The author(s) received no financial support for the research, authorship, and/or publication of this article.
Supplemental Material
Supplemental material for this article is available online.
References
Supplementary Material
Please find the following supplemental material available below.
For Open Access articles published under a Creative Commons License, all supplemental material carries the same license as the article it is associated with.
For non-Open Access articles published, all supplemental material carries a non-exclusive license, and permission requests for re-use of supplemental material or any part of supplemental material shall be sent directly to the copyright owner as specified in the copyright notice associated with the article.