
Abstract
Background:
Adsorption of insulin to infusion sets impacts patient therapeutic outcomes and, unaccounted for, may exacerbate persistent hyperglycemia or result in therapy-induced hypoglycemia. This article aims to provide recommendations for clinicians involved in intensive care and/or outpatient pump therapy contexts.
Methods:
A dynamic adsorption model is used to evaluate time-varying insulin concentration in the infusion set outflow. Hourly and daily percentage insulin loss to adsorption is examined for neonatal, pediatric, and adult intensive care patients, as well as outpatient children and adults weighing 30, 50, and 80 kg. A short review of preconditioning methods is included.
Results:
Insulin adsorption in outpatient pump therapy is most pronounced in the first hour, where as much as 80% of the intended insulin dose may be lost to adsorption. Subsequently, insulin adsorptive loss is typically negligible. Overall, extra care should be taken in the first 1-6 h of a new infusion set, particularly in children or teenagers. Typically, insulin adsorption in the adult intensive care unit is negligible unless infused at low flow rates (<2 mL/h). Insulin adsorption is significant in pediatric and neonatal intensive care, resulting in delivery concentrations as low as 5%-50% of that intended. Thus, it is recommended that preconditioning of insulin delivery lines be carried out prior to infusion initiation in this context. However, no preconditioning method completely removes adsorption, and care should still be taken in the first 1-6 h of insulin dosing.
Conclusions:
Recommendations made in this article are dependent on the insulin concentration and flow rate used in each clinical context.
Introduction
Adsorption is the binding of a substance to a material surface, a phenomenon extremely common in the delivery of protein-based therapies.1,2 In particular, the adsorption of insulin to materials involved in its delivery has been well noted over the last half century,3-16 but is not well understood in a clinical context. The aim of this article is to highlight the problem, and present recommendations based on a model-based approach, with the intention of unifying the diverse literature in this field.
This article first presents a description of the problem and recommendations for a clinical response, followed by the model- and literature-based analysis from which the recommendations are drawn. A final section summarizes key literature around methods to minimize the impact of adsorption, and their efficacy and/or limitations. The overall problem is addessed in the context of insulin infusions in the adult intensive care unit (ICU), neonatal intensive care unit (NICU) and/or pediatric intensive care unit (PICU), and outpatient diabetes.
Straight to the Point: Problem and Recommendations
The Problem: “Dude, Where’s My Insulin?”
Insulin adsorption reduces delivery of insulin to the patient, a phenomenon that is almost always unaccounted for in insulin dosing regimens. Insulin adsorption, or binding, to delivery surfaces, such as glassware,17,18 syringes,4,19 IV bags,5,13,18,20 delivery tubing, and catheters,3,6,8-10,16,18,21 removes insulin that would otherwise be delivered to the patients. This phenomena is different from, but similar to, aggregation, which is the binding of insulin to itself. The result is under-delivery of insulin, which has had clinically significant effects on insulin dosing.7,10
The Actual Problem: “Ignorance is Not Bliss”
Clinically, unknown under-delivery of insulin appears as persistent hyperglycemia and/or lowered insulin sensitivity. A worst-case scenario could see over-response to apparent insulin-resistance, where higher insulin doses combined with saturation of adsorptive losses may result in over-dosing and hypoglycemia. Thus, unaccounted for insulin adsorption represents unmanaged risk.
Pre-flushing or pre-priming of lines is used to mitigate the effects of insulin adsorption. However, this practice is not universally applied.9,22 Nor is there any consistency in approach, using insulin, flushes or soaks, albumin or other proteins, all of which have different effects and degrees of efficacy.
Clinical Recommendations
The recommendations in Table 1 show the main clinical recommendations based on clinical context, which is a function of infusion set material and volume, insulin concentration, and flow rate. Recommendations are based on an experimental data-based model and a range of predicted insulin losses for each context, which in turn determine whether adsorption is an issue that needs to be addressed. Details on the model and methods are provided in subsequent sections.
Clinical Recommendations to Minimize the Impact of Insulin Adsorption on Delivered Insulin Therapy.
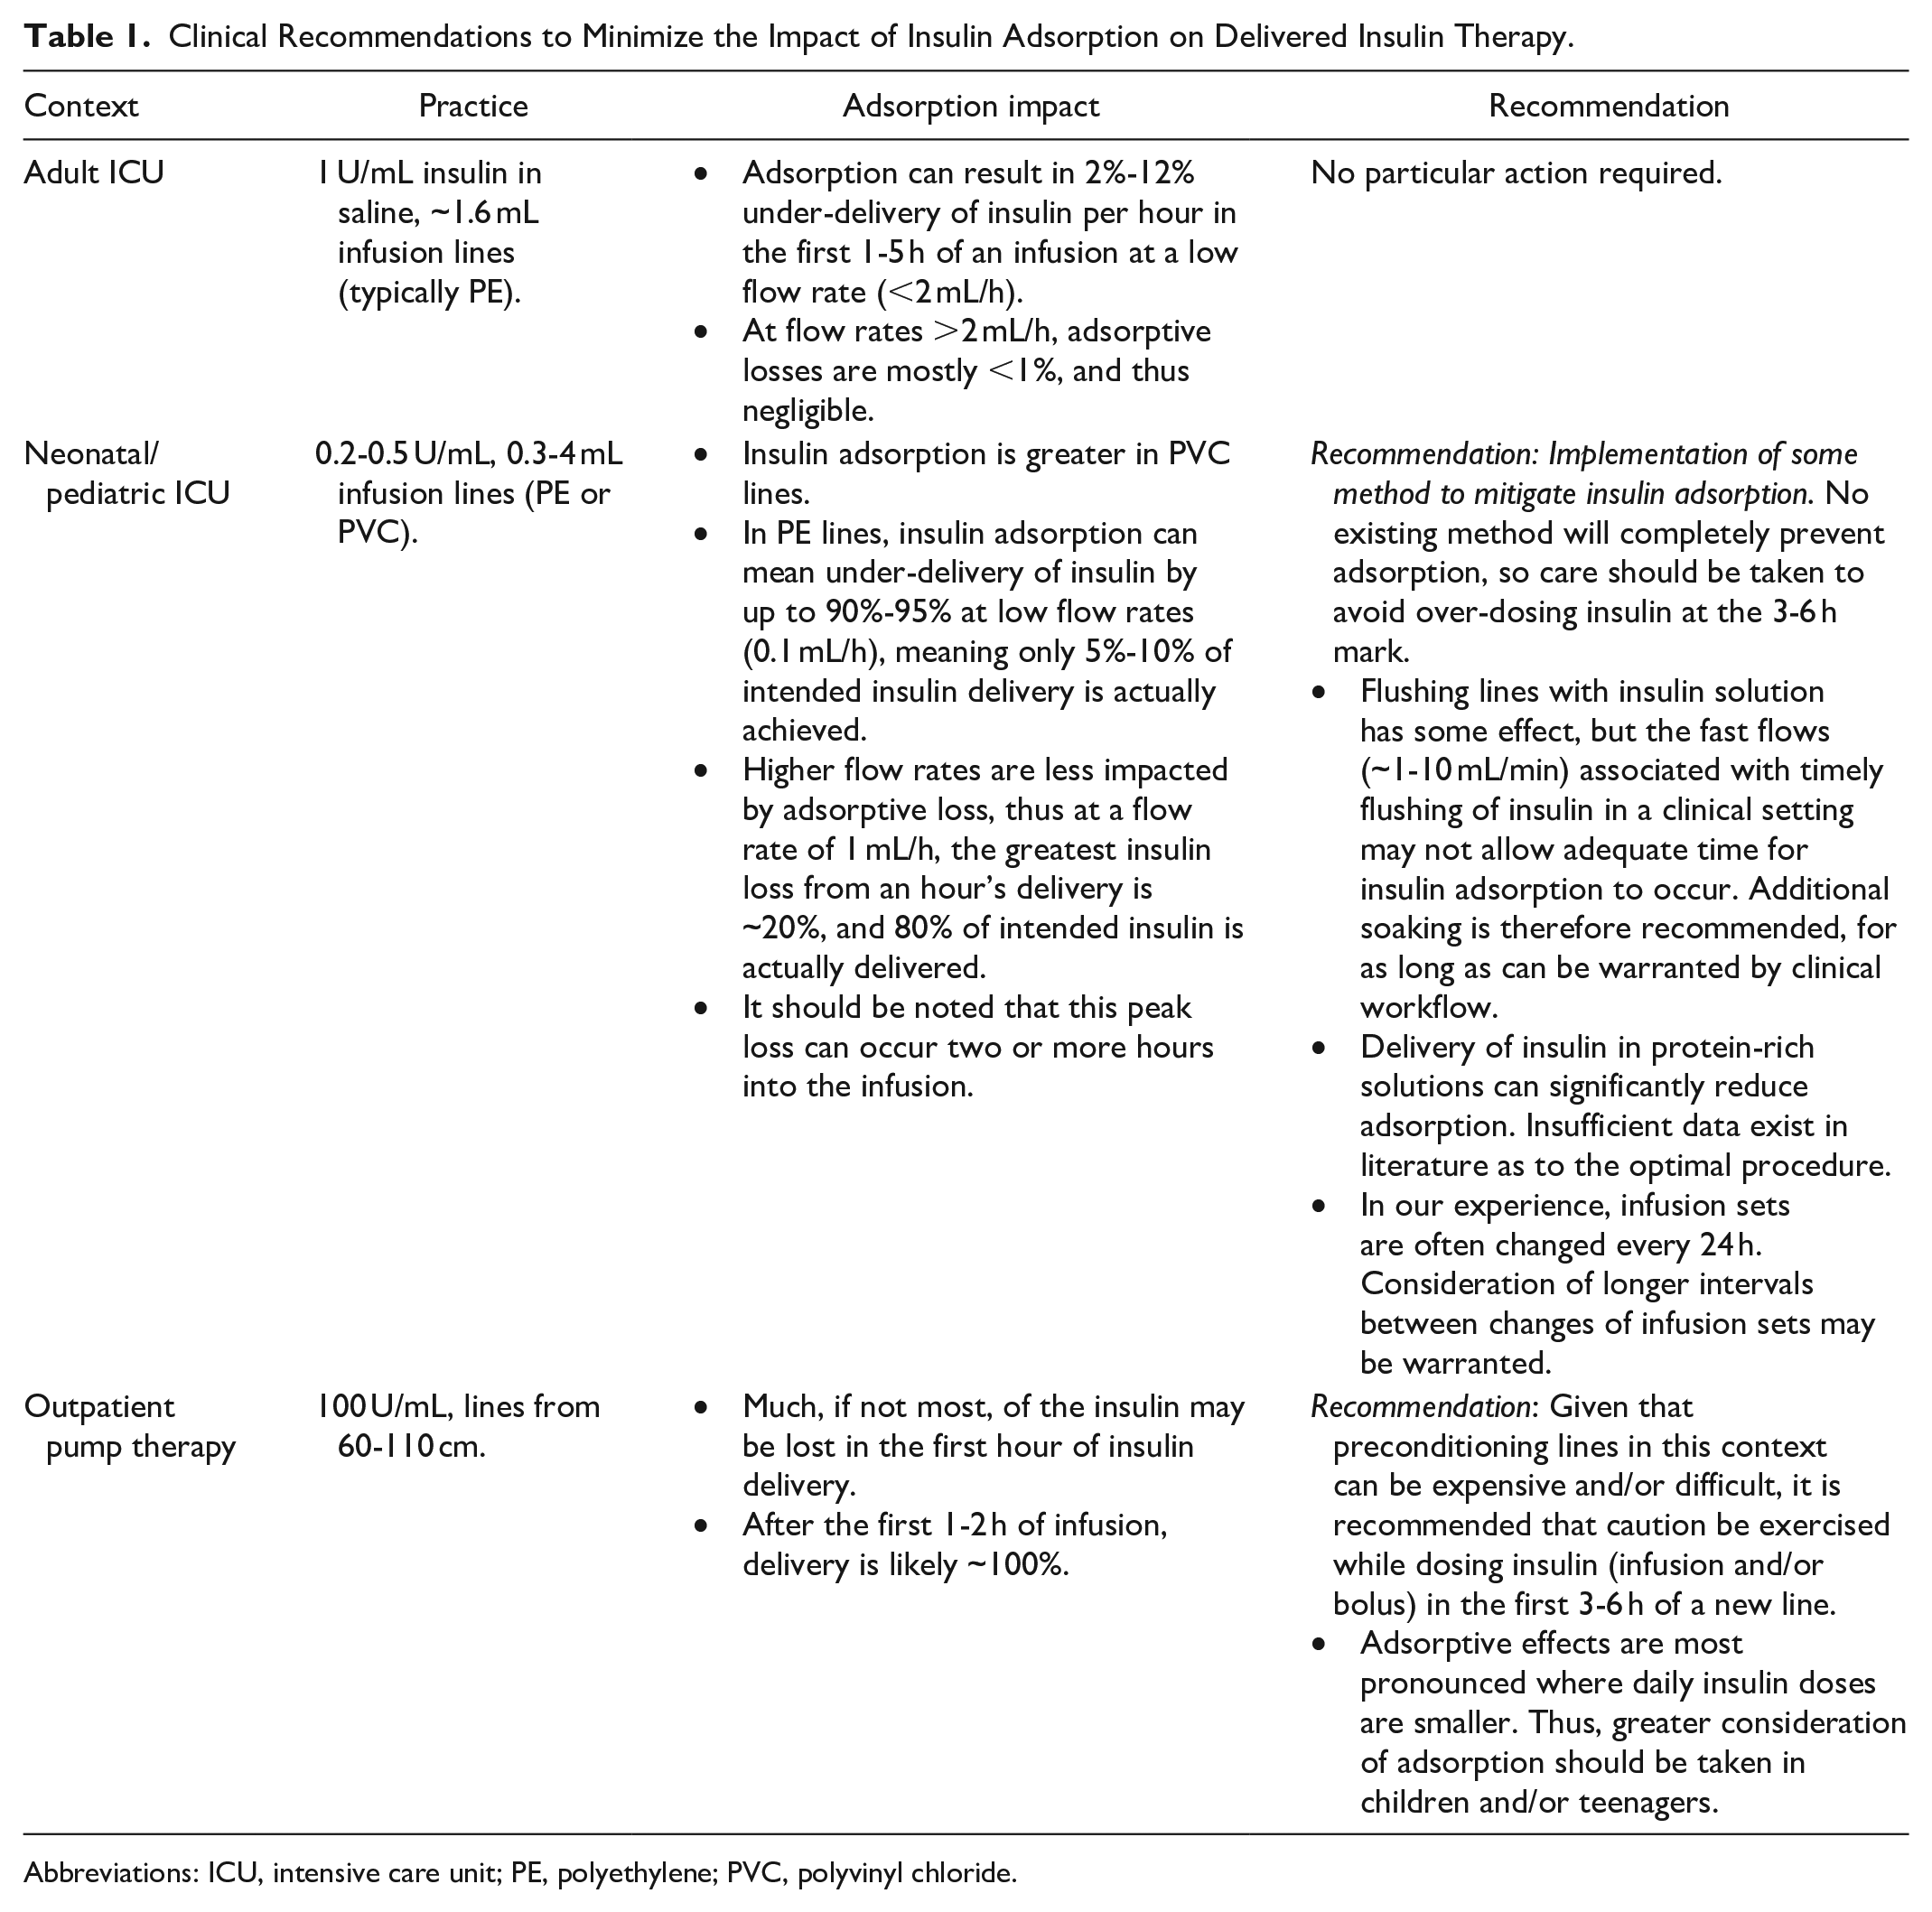
Abbreviations: ICU, intensive care unit; PE, polyethylene; PVC, polyvinyl chloride.
Model-Based Analysis
Methods
Two contexts are considered: intensive care unit (ICU) infusion of insulin and outpatient pump therapy. Three lines are considered for each context and are denoted “Low,” “Medium,” and “High” volume. ICU line dimensions are pulled from Refs8-10 and are considered reflective of the range of lines across neonatal, pediatric, and adult intensive care. Pump infusion sets are categorized by typical lengths available commercially, with an assumed internal radius based on Ref. 23 as tubing inner diameter is not commonly stated. Derived characteristics, such as volume, surface area, or radius, as appropriate, are calculated assuming a circular cylinder, and connection geometries and/or cannula are ignored. These values are given in Table 2.
Typical Internal Geometric Characteristics of Infusion Lines.
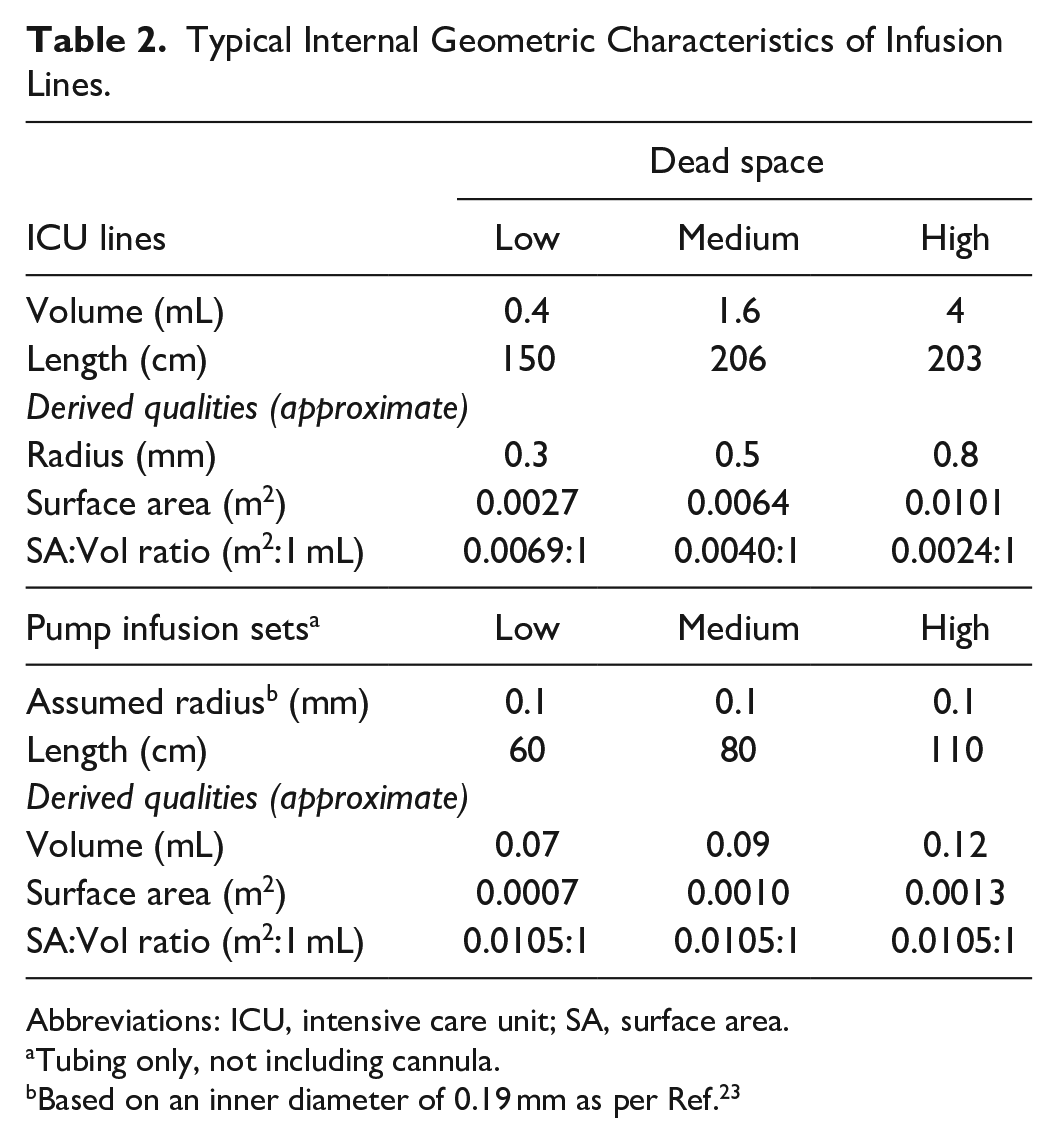
Abbreviations: ICU, intensive care unit; SA, surface area.
Tubing only, not including cannula.
Based on an inner diameter of 0.19 mm as per Ref. 23
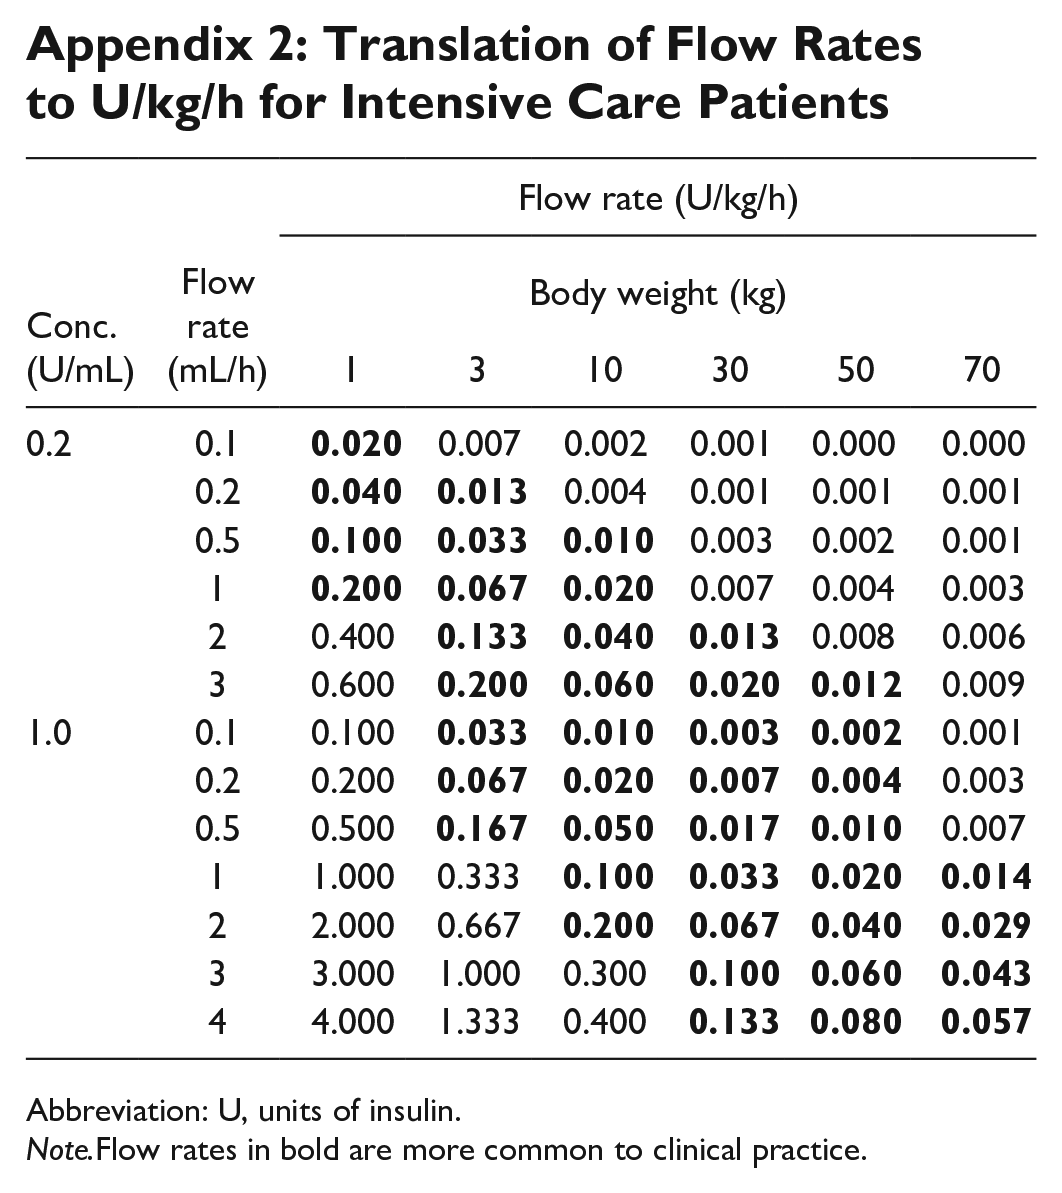
The most common materials used are polyethylene (PE) and polyvinyl chloride (PVC). For this analysis, all lines are assumed to be PE or PE-lined, as the most conservative case, since PE adsorbs less insulin than PVC. 24 A model-based analysis (see Appendix 1 for model) is carried out to assess the impact of adsorption at three different concentrations: 0.2, 1.0, and 100 U/mL. The model in Appendix 1 is used to calculate time-dependent insulin concentration at the infusion line outlet, representing the time profile of insulin delivered to the patient. Appendix 2 translates concentrations and flow rates in mL/h to U/kg/h, for comparison across different ICU contexts.
The material’s total capacity for insulin adsorption (U/m2) is assumed hyperbolic, based on relationships observed in previous work, 24 and the resulting equation in Figure 1 is used. In the case of very low flow pump infusions (of the order of μL/h), reflecting significant extrapolation of the relationship in Figure 1, adsorptive capacity is constrained to 500 U/m2, which is approximately twice the maximum observed across both materials in Ref. 24
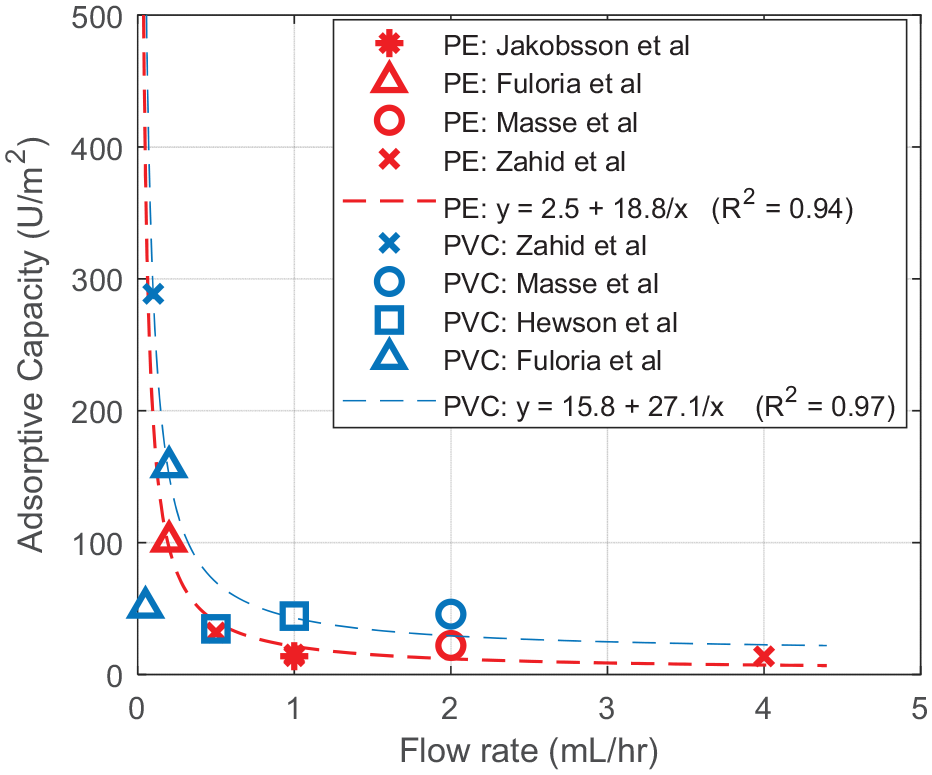
Flow dependence of total adsorptive capacity of polyethylene.
Results
Intensive care
Model-based results
Figure 2 and Table 3 show that insulin adsorptive loss is a function of concentration, flow rate, and line size:
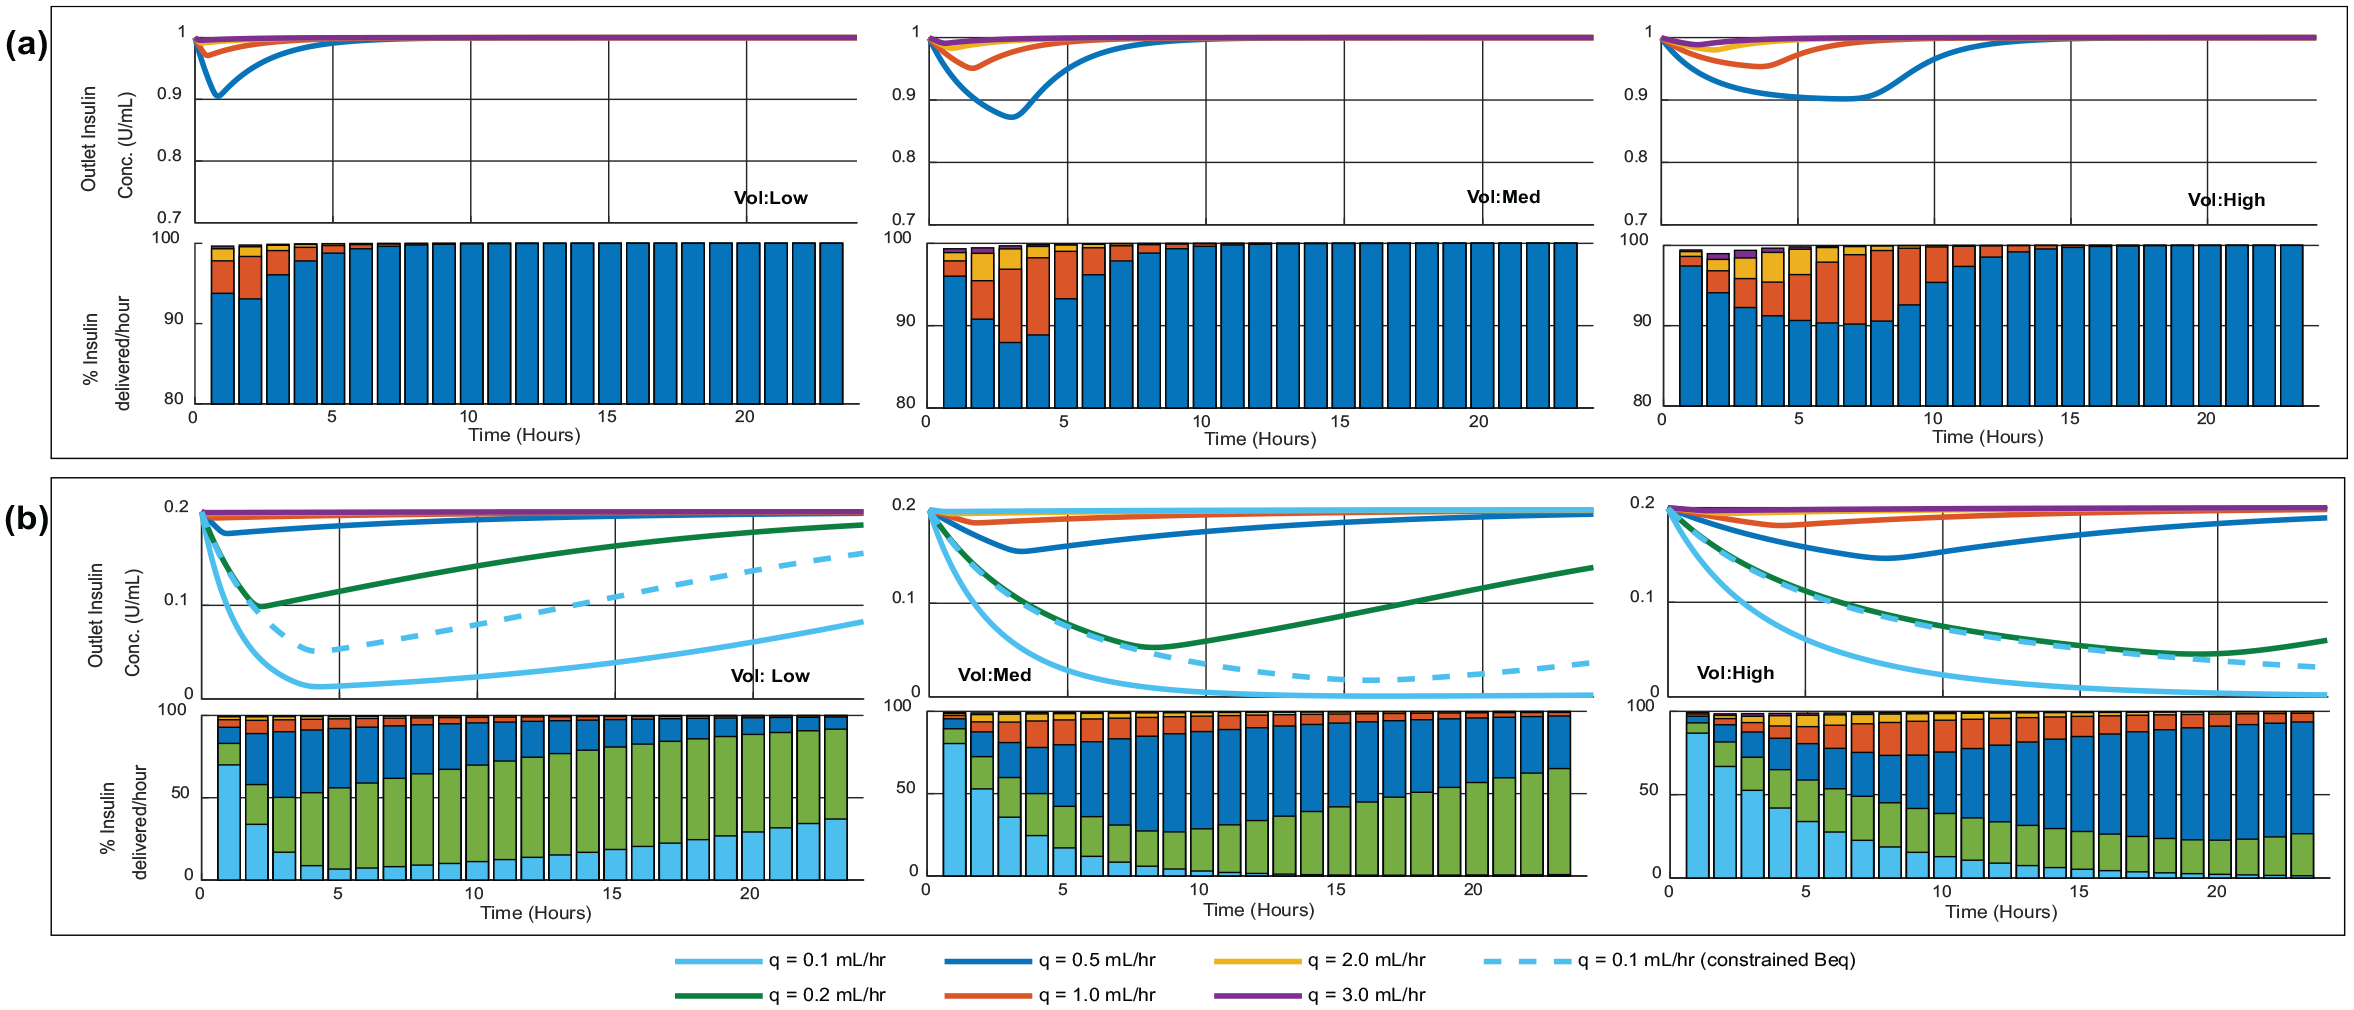
Infusion line outlet concentration (delivered insulin) for three different intensive care unit lines (defined in Table 2), with inlet concentration: (a) 1.0 IU/mL and (b) 0.2 U/mL. Bar charts show total insulin delivery per hour as a percentage of expected/intended delivery, and bars are overlaid on the same axes so are not representative of sums to 100%. Dashed lines represent results with adsorptive capacity (Beq) constrained to a hypothetical lower maximum of 100 U/m2.
Case Study for a Medium Volume Infusion Line.
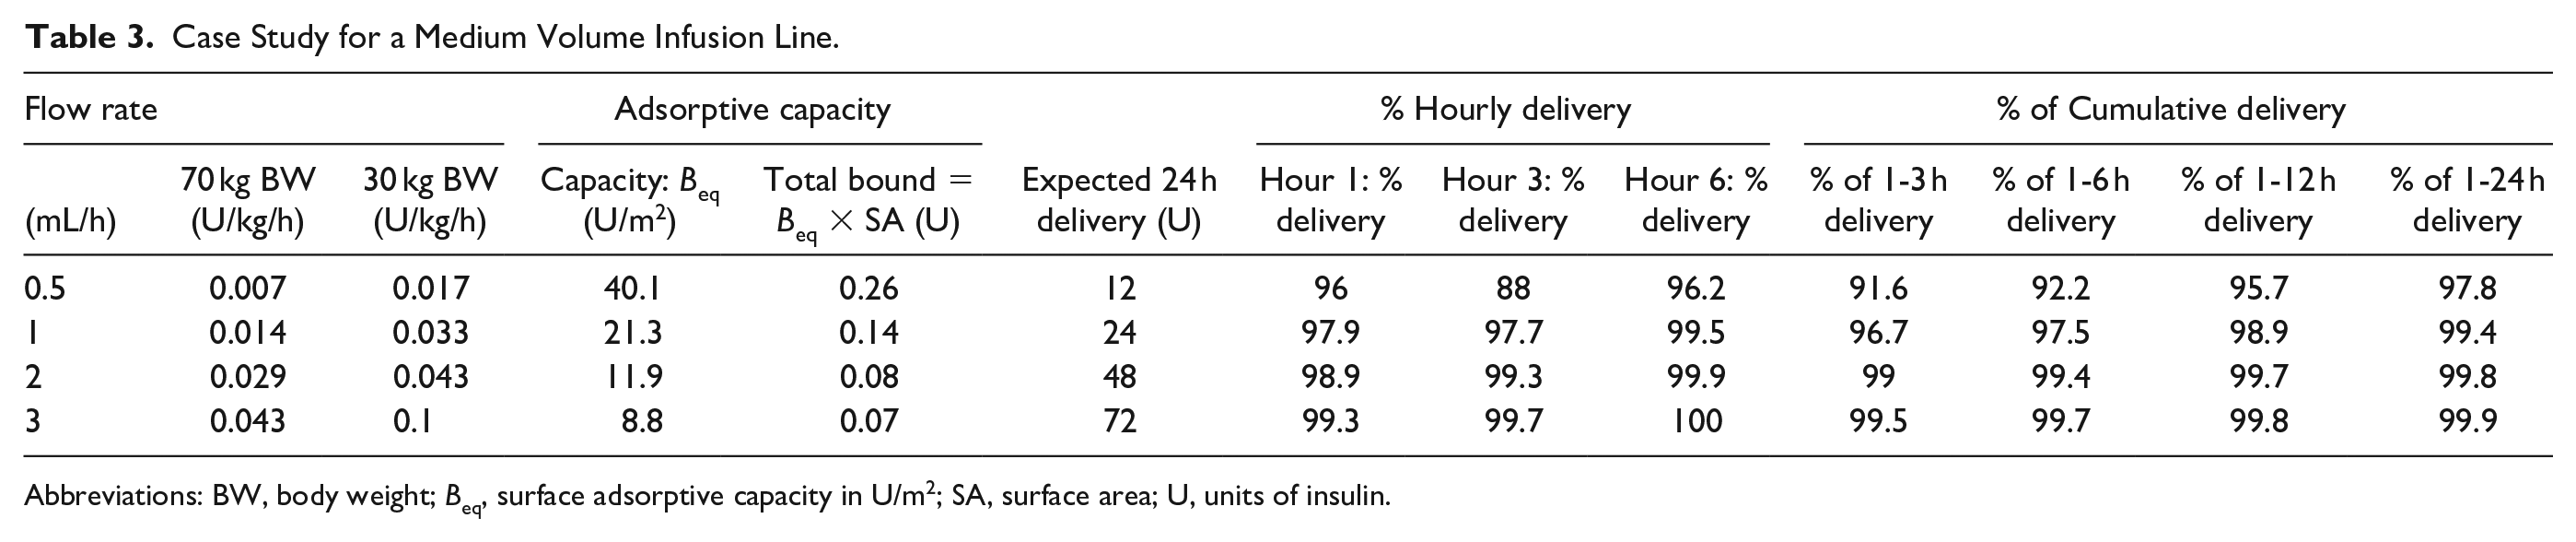
Abbreviations: BW, body weight; Beq, surface adsorptive capacity in U/m2; SA, surface area; U, units of insulin.
Lower input concentration exacerbates loss impact: Adsorptive loss had lower overall impact at concentrations of 1 U/mL, where Figure 2a shows the minimum delivery is of the order of 90% of expected, matching literature. 8 By comparison, infusions at the lower concentration of 0.2 U/mL had slightly lower minimum delivery (78% vs 88%) under the same flow rate and infusion set conditions (Vol:Med in Figure 2a).
More insulin is lost overall at lower flow rates: The total insulin lost to the line (surface adsorptive capacity) is a function of flow rate, based on results in Ref. 24 The greatest total loss occurs at lower flow rates, decreasing hyperbolically with increasing flow.
Lower flow rates take longer to reach the minima: Insulin concentration at the outlet do not necessarily occur immediately after infusion initialization, in part due to time taken for priming-volume turnover. Figure 2b shows this delay can be much greater than 5 h in low flow low concentration scenarios.
Larger surface areas affect total loss: Higher surface areas result in greater adsorptive loss of insulin due to a larger number of surface binding sites. In Figure 2, the highest volume line had the highest surface area, and the effect of insulin loss was prolonged.
Clinical takeaway
ICU: Panel a in Figure 2, and the medium volume line in particular, is representative of likely insulin adsorptive effects on adult ICU delivery of insulin (Table 3). The effects are most significant during the first 1-3 h, and likely have negligible or very little clinical impact, since typical ICU flow rates (Appendix 2) are greater than 1 mL/h at 1 U/mL concentration. Total insulin adsorption to the medium volume line is ≤0.25 U, representing a very small proportion of daily insulin requirements (~2% at 0.5 mL/h, 0.1%-0.5% at higher flow rates). Overall, insulin adsorptive effects have only small to negligible clinical significance for adult ICU delivery of insulin.
NICU/PICU: Panel b in Figure 2 is representative of neonatal or pediatric intensive care insulin infusions. Results in Figure 1b with the low volume infusion line approximate previous experimental results by Ref. 10 Adsorptive effects are much more significant in this cohort, as losses and their impact are exacerbated by low flow and low concentration settings. Overall insulin loss may represent a significant proportion of daily insulin delivery. Thus, pre-priming/preconditioning of infusion sets is important in this clinical context, as the lower flow and lower concentration combination exacerbate adsorption.
Pump therapy
Model-based results
Input insulin concentration is 100 U/mL, and thus very low flow rates are required to delivery 0.01-0.02 U/kg/h basal insulin. As these infusion rates are of the order of μL/h rather than mL/h, the adsorptive capacity of the material is constrained to a maximum of 500 U/m2, as in Figure 1. The upper limit on adsorptive capacity of 500 U/m2 was chosen as being similar or greater than the maximum adsorptive capacities seen in PE and PVC, 24 presenting the clinically conservative case of the maximal possible adsorptive loss.
Figure 3 shows rapid insulin adsorptive loss, with insulin adsorption typically saturating within an hour. Given the extremely low flow rates, the minimum insulin recovery is 0 U/mL at all flow rates examined, and remains <5% for typically 5-55 min. In Table 4, such a loss might represent around 1%-5% of total insulin for the first day of delivery, but the 0.25 U bound can represent 31% (80 kg person at 0.01 U/kg/h)—80% (30 kg person at 0.01 U/kg/h) of the first hour’s intended insulin delivery. If the limit on adsorptive capacity was half that modeled here (250 U/m2) then it might be expected that 15%-40% of the first hour’s intended insulin delivery. If higher, as posed in Table 5, the impact could be higher.
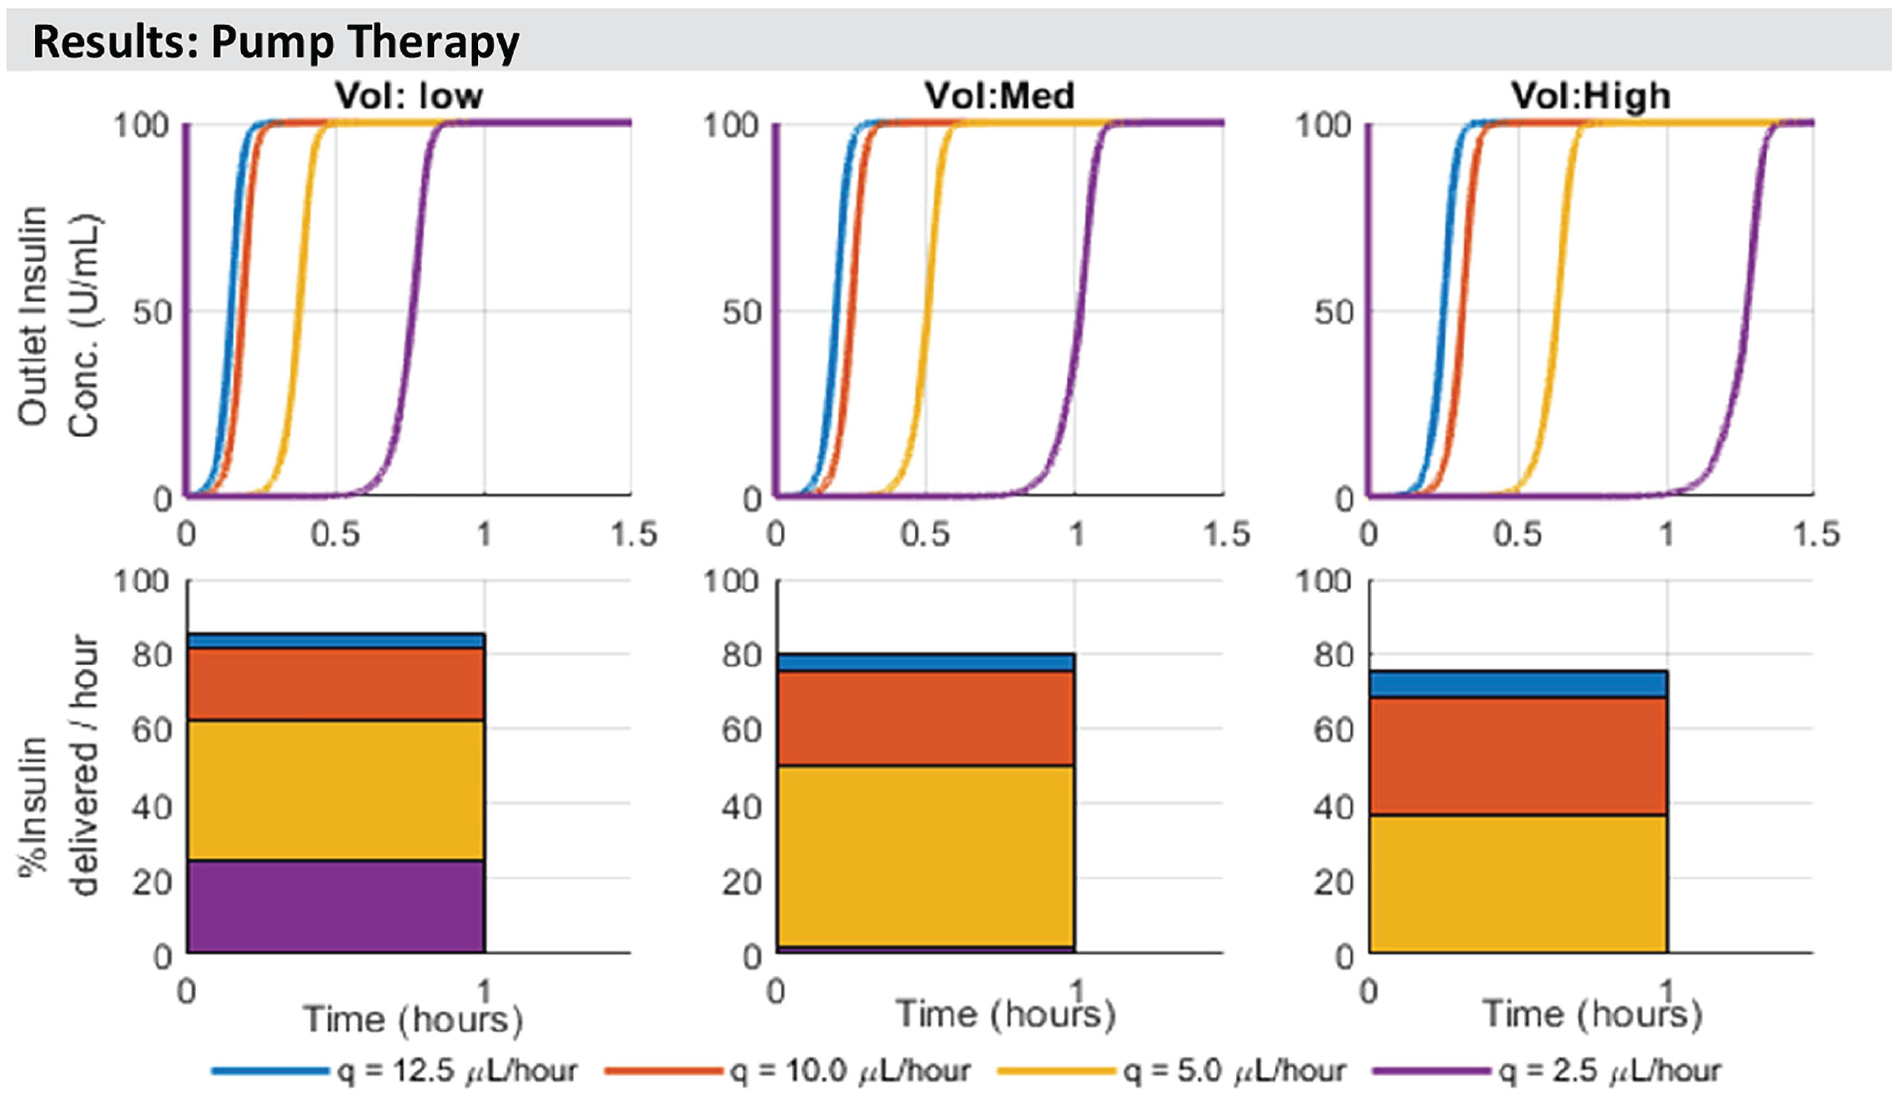
Model-based estimation of delivered insulin concentration at the outlet of different length infusion sets for wearable insulin pumps. Dimensions for each size (low, medium, and high) are in Table 2. Note that bars are overlaid on the same axes so are not representative of sums to 100%. Adsorptive capacity is limited to a maximum 500 U/m2, based on previous observations. 24
Case Studies—Impact of Infusion Line Adsorptive Losses for a Weight-Based Basal Delivery.
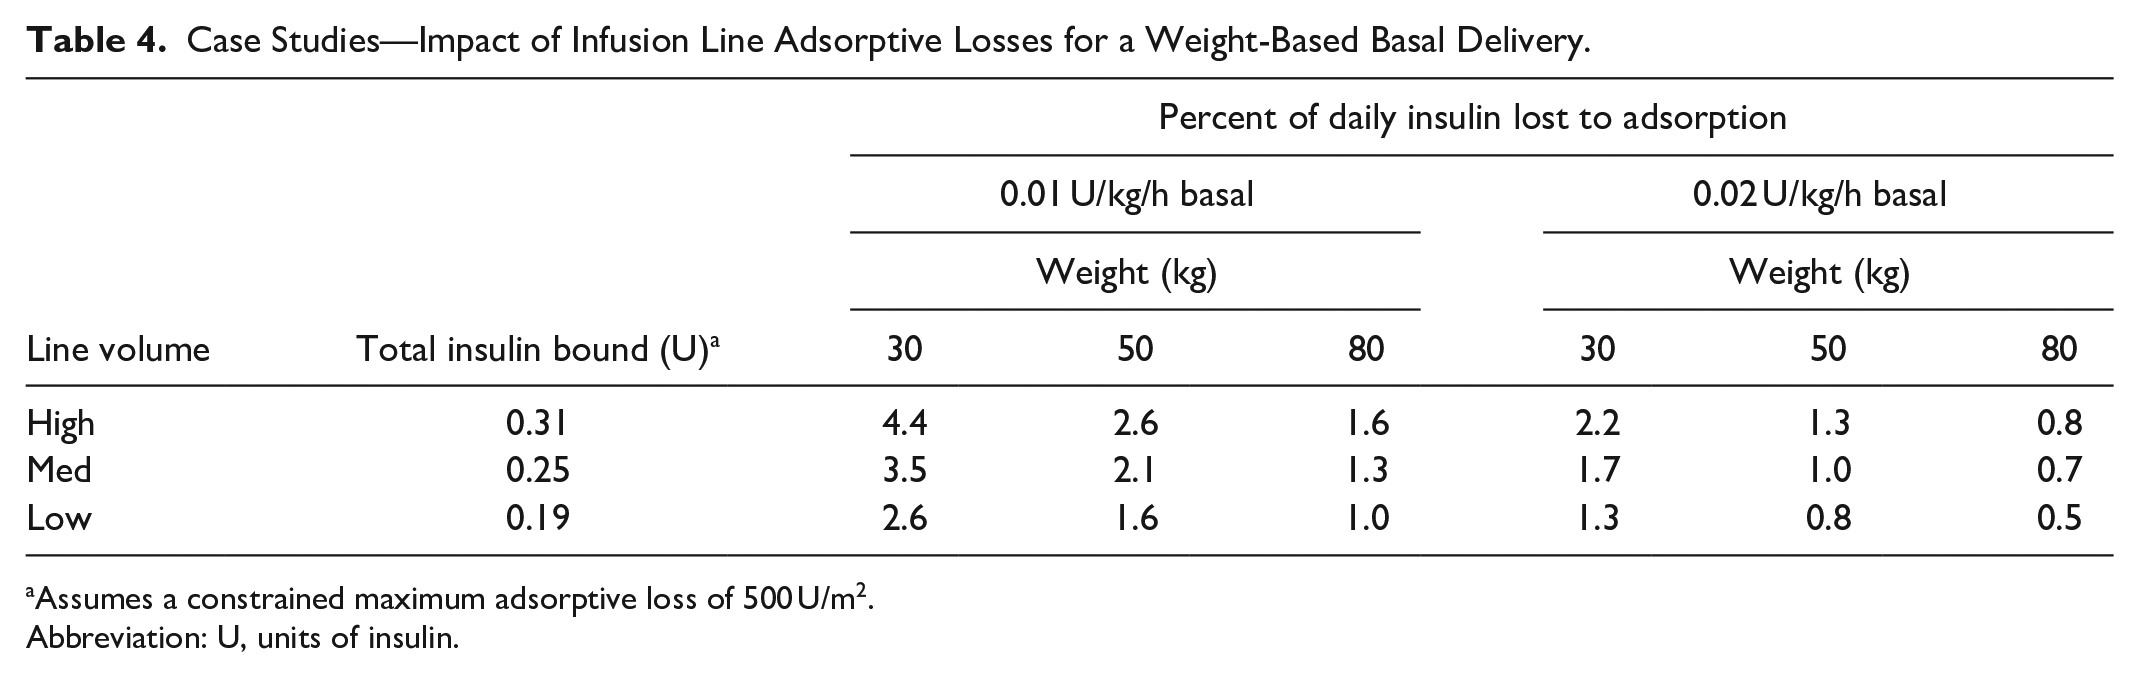
Assumes a constrained maximum adsorptive loss of 500 U/m2.
Abbreviation: U, units of insulin.
Impact of Model Extrapolation to Very Low Flow Rates—Upper Extremes on Potential Insulin Loss if Limit on Adsorptive Capacity is Removed.
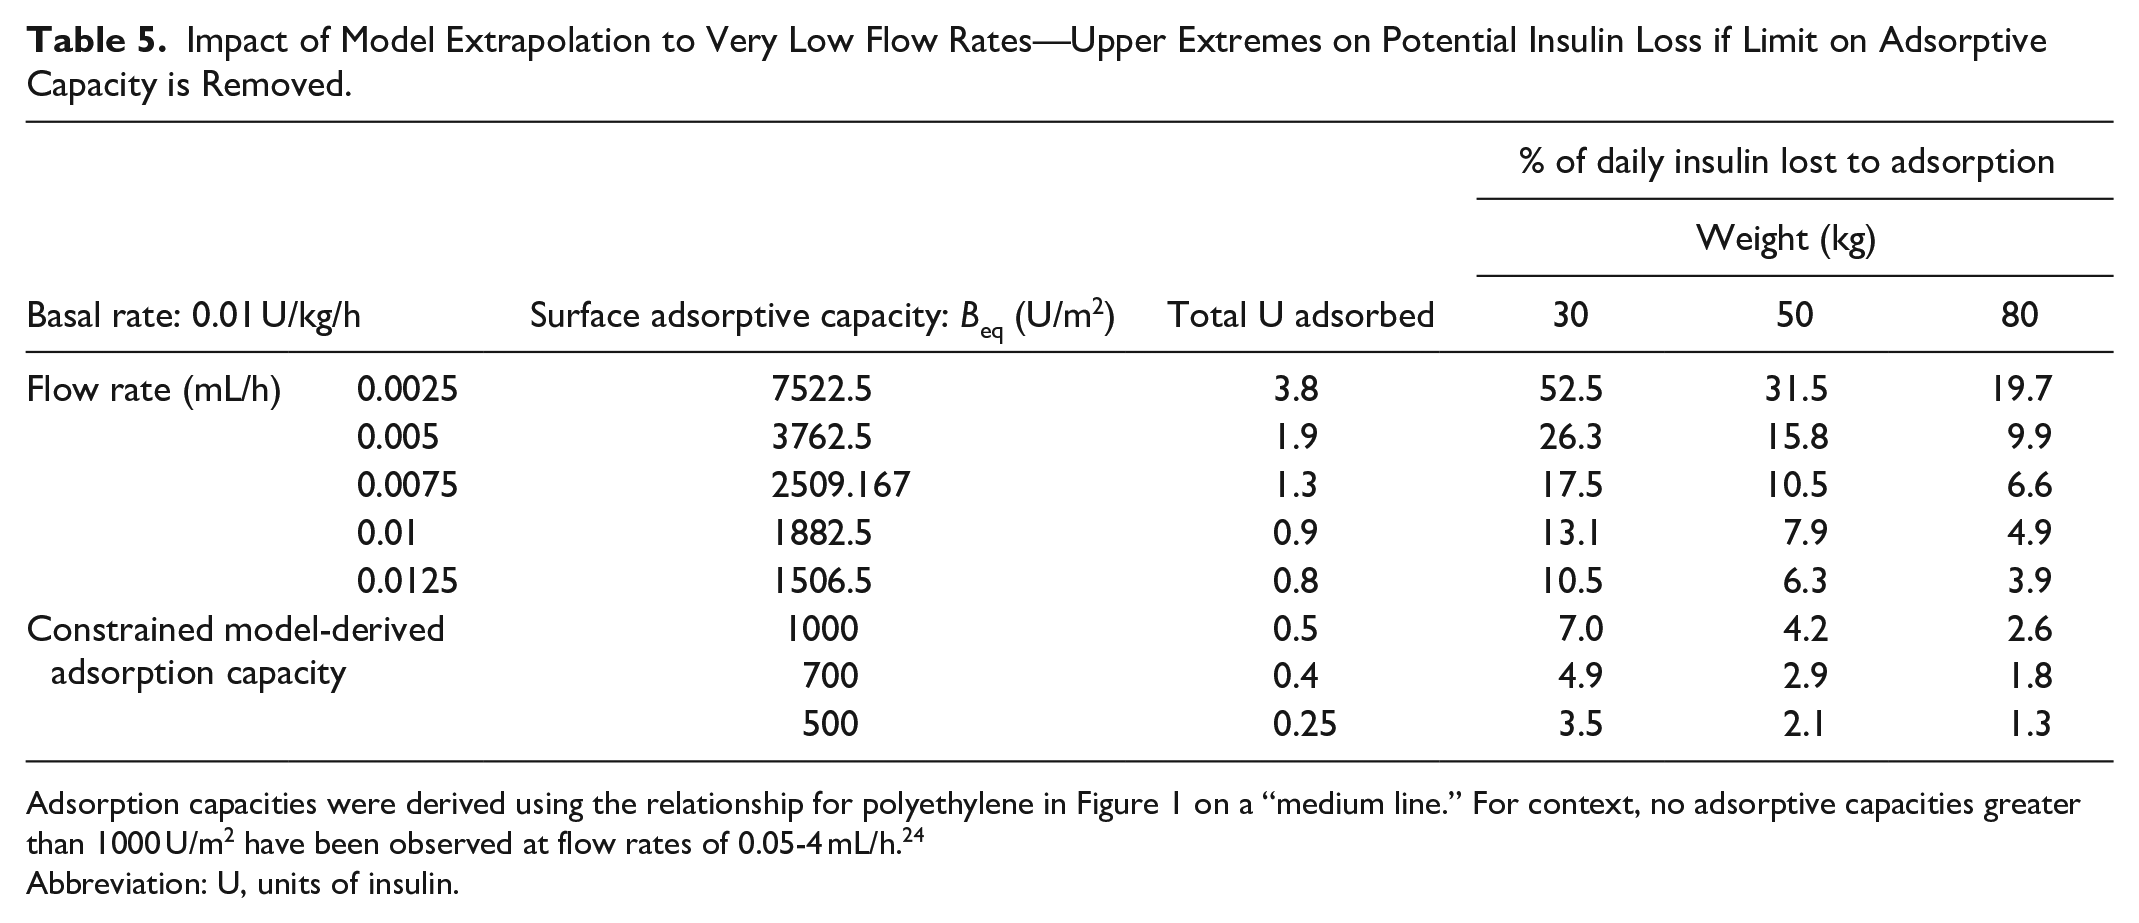
Adsorption capacities were derived using the relationship for polyethylene in Figure 1 on a “medium line.” For context, no adsorptive capacities greater than 1000 U/m2 have been observed at flow rates of 0.05-4 mL/h. 24
Abbreviation: U, units of insulin.
Clinical takeaway
Total adsorption to insulin lines is currently difficult to estimate due to uncertainties in dynamics at low flow rates and no reported test data. It is likely of the order of 1%-5% of total insulin requirements for the first day, but may be much higher in children. The greatest impact is seen in the first hour, where potentially as much as 30%-80% of the intended hour’s dose of insulin may not be delivered. Thus, caution should be exercised in the first 1-2 h of insulin delivery when a new infusion line is inserted.
How Might I Mitigate This Issue?
Having identified the impact of adsorption, the logical follow on is “how do I minimize its effect?” Various attempts to mitigate the impact of adsorption have been explored, including pre-priming the line with flushes or soaks with insulin (at delivery or higher concentration), or with other protein-rich solutions such as albumin.6,9-11,25,26 While these methods are able to reduce the impact of adsorption, they are not able to completely remove it. Equally, their impact has not been assessed completely, and may be method specific. This section aims to review and summarize the experimental evidence available for different priming methods and their efficacy.
Table 6 summarizes a few key studies in this area. The majority of them are carried out in the context of the NICU, as the low concentrations and flow rates used in the NICU mean adsorption has greatest impact on insulin delivery.
Summary of Literature—Methods to Reduce the Impact of Insulin Adsorption.
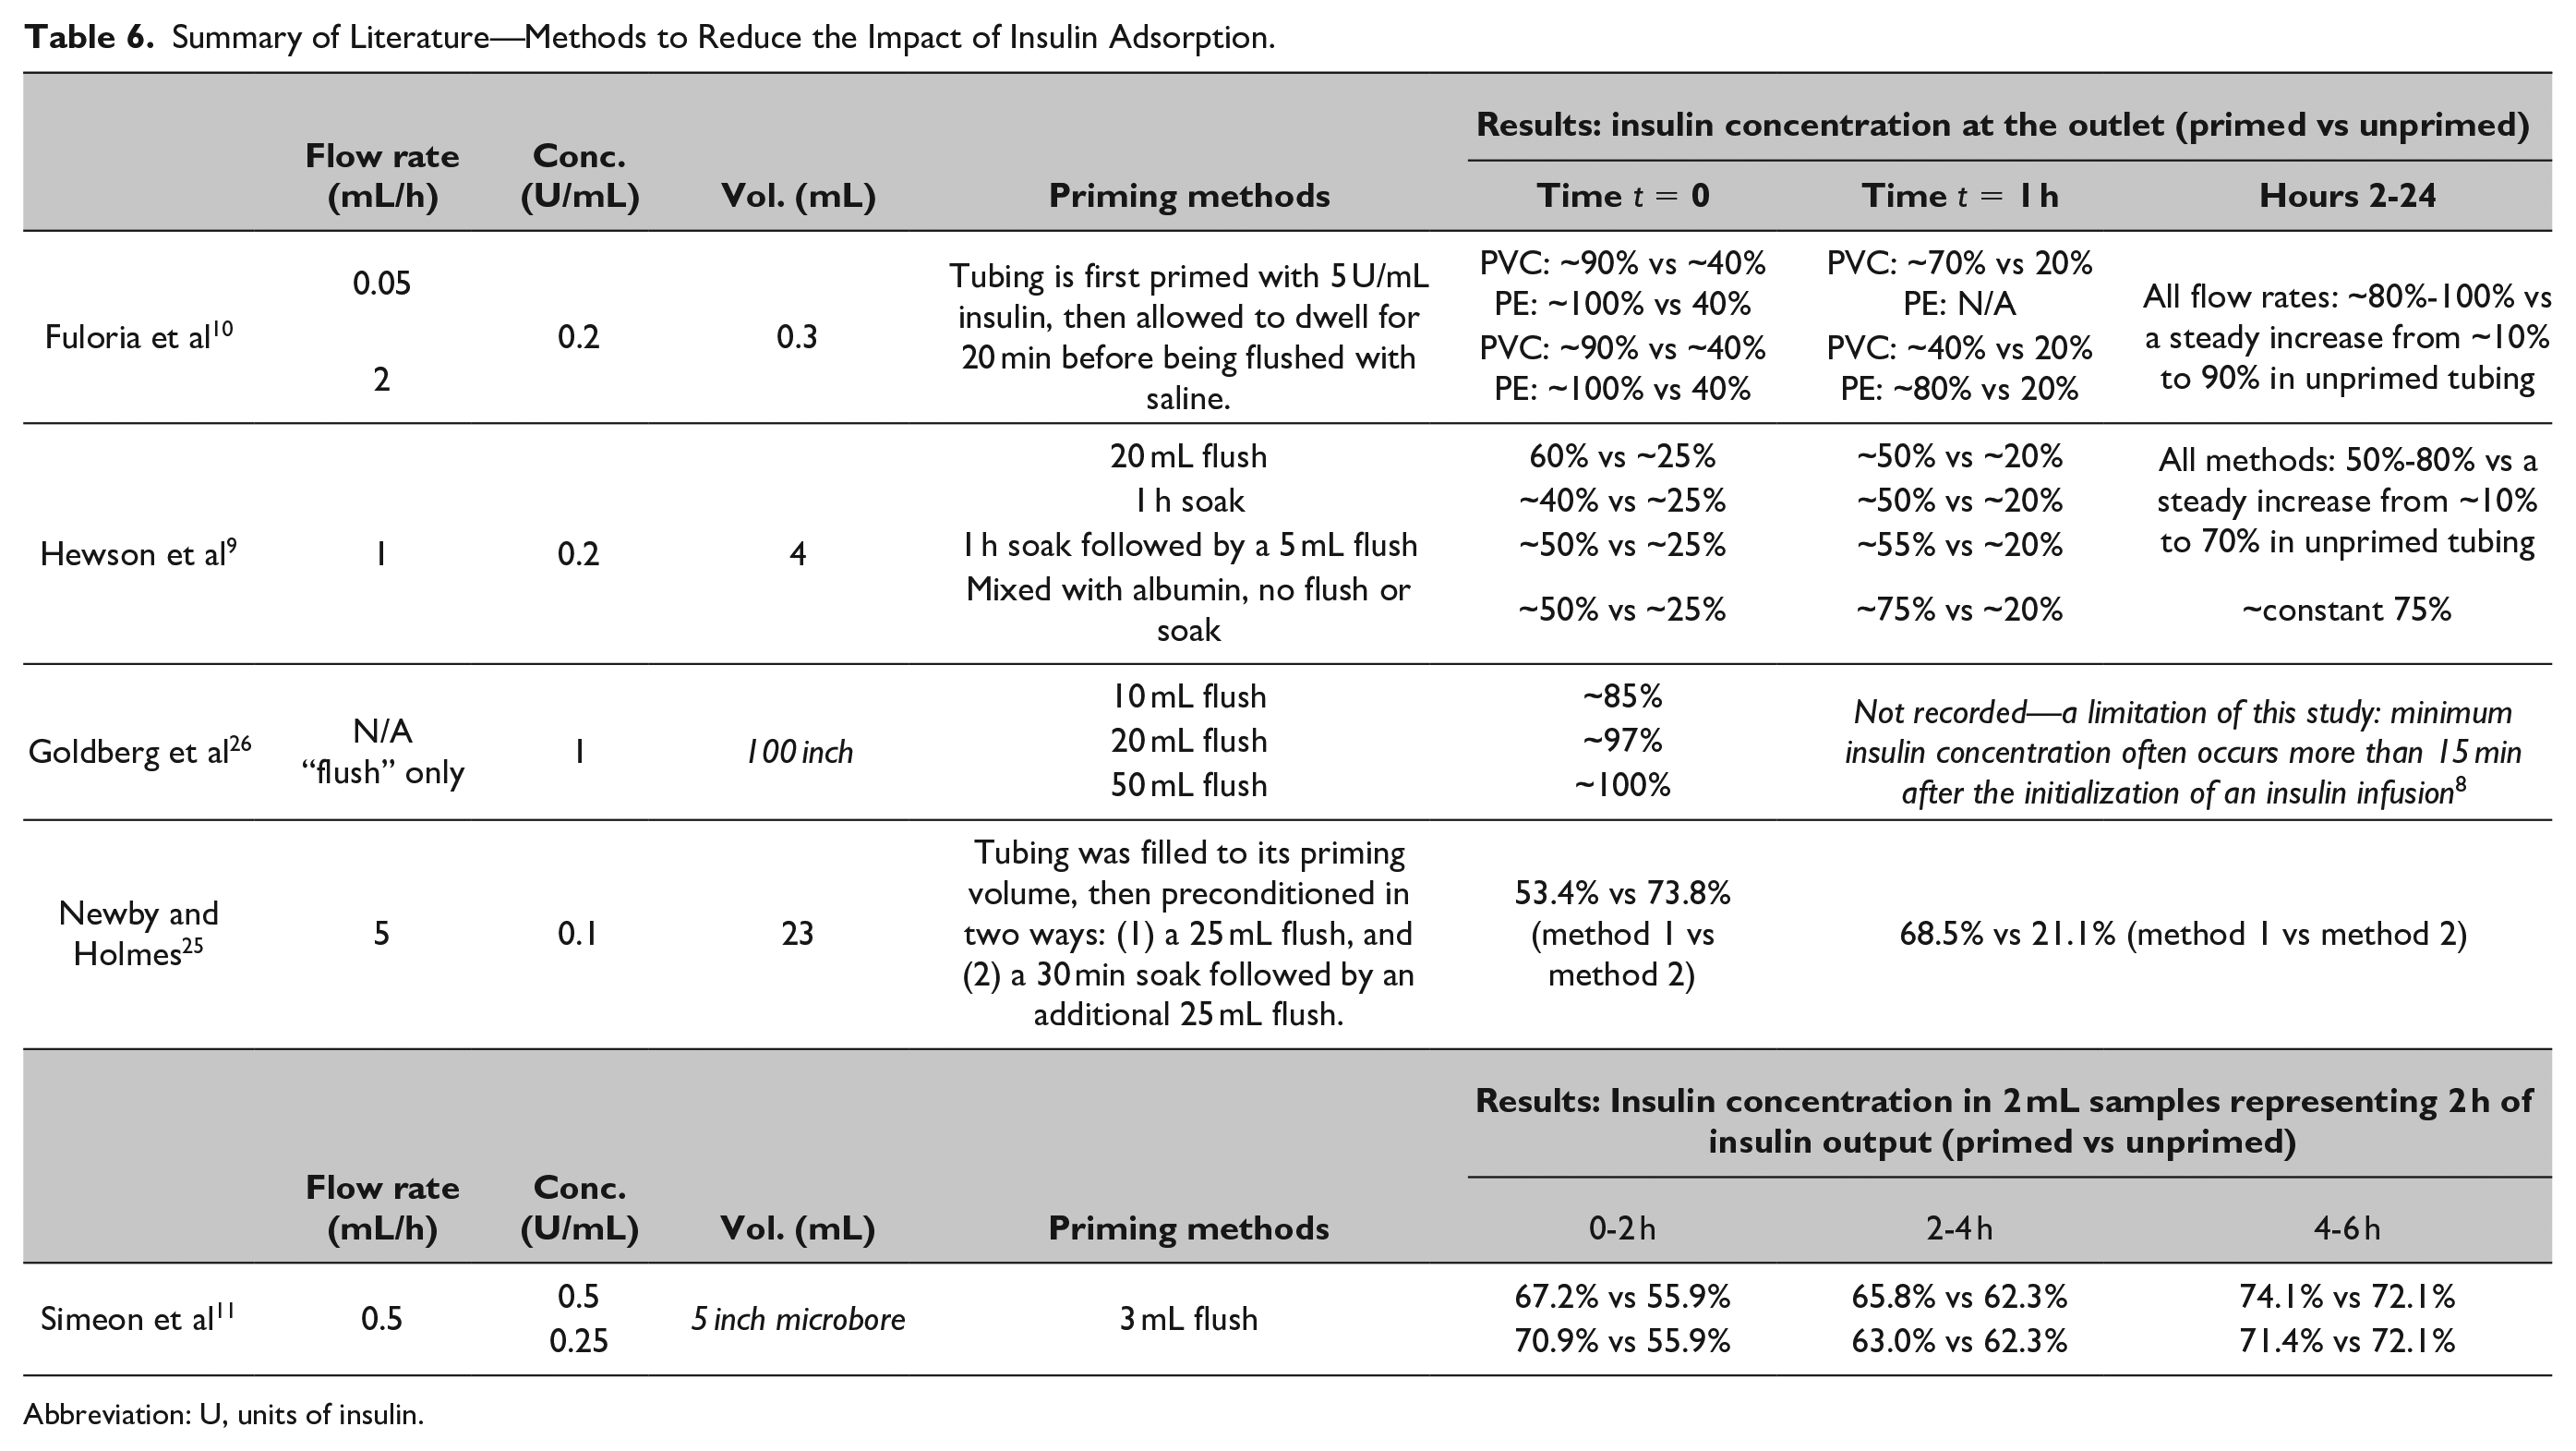
Abbreviation: U, units of insulin.
A publication by Goldberg et al 26 is a perhaps more widely used standard for insulin preconditioning in critical care, recommending a 20 mL flush with insulin to mitigate the effects of insulin adsorption. However, their results do not seem to translate to the NICU setting with lower concentrations and flow rates, as seen in Hewson et al. 9 A further limitation of the Goldberg et al 26 study is that they only measure the concentration in the first samples taken from the end of the line post-flush (t = 0,), and other studies have shown that the minimum insulin concentration delivered often occurs more than 15 min after the initialization of an insulin infusion,8-10 due to fast flush/priming vs much slower infusion flow rates.
Summary of Mitigation Methods and Efficacy
Preconditioning of lines using flushes, soaks, or delivery alongside other proteins are effective ways to reduce the impact of insulin adsorption, but they do not completely mitigate the problem. In addition, they may present barriers to implementation in a clinical setting:
Flushes: Flushing the line with insulin solution prior to infusion can reduce insulin adsorption effects,11,25,26 as it offers the opportunity to presaturate binding sites on the material surface. A limitation of this method is faster flow rates in flushing (1-10 mL/min vs 0.1-5 mL/h delivery rate) tend to result in lower overall adsorption (Figure 1), so flushing the line at flow rates convenient to clinical practice will have lower effect on adsorption and pre-saturation compared to additional soaking 25 or slower flushes. 27 In addition, the insulin solution flushed is “wasted,” which may impose a cost consideration in some contexts.
Soaks: Soaking the line with an insulin solution prior to infusion can reduce adsorption,9,10,25 and is more effective than a flush alone, 25 but requires delays in the initiation of insulin therapy by 20-60 min. Such delays may be detrimental to patients or impose clinical burden on staff.
Sacrificial proteins: co-delivery of insulin alongside other proteins, such as albumin, is a very effective way to reduce insulin adsorption. However, delivery in albumin or plasma may present health concerns in some contexts.
Limitations and Disclaimers
This analysis is model based, rather than directly experimental. It is thus able to describe adsorption dynamics at a broad range of flow rates and conditions not feasible experimentally. The models presented have had preliminary validation using experimental data reported in literature,24,28,29 and so are considered indicative of adsorption dynamics across the range of intensive care flow rates analyzed. Their extrapolation to the very slow infusion rates used in pump therapy may be less reflective of actual dynamics, as no study has examined adsorption at very low flow rates. The lack of clinically focused experiments in this low flow region force extrapolation, but also point out the need for focused clinical experiments in this region to add precision to the recommendations made.
However, the studies used are perhaps most comparable to “bath” studies from a material science perspective, where the adsorptive capacities reported broadly match those at intensive care type flow rates. 28 Most studies in this area use a short acting insulin (summarized in Refs24,28), though one study also compared a short and a rapid acting insulin, with extremely comparable results. 3 Overall, results presented here provide strong indications of likely outcomes in intensive care contexts, and a reasonable estimation of the range of possible outcomes when the models are extrapolated to pump therapy.
Footnotes
Appendix 1: Model
A two-state compartment model is used to describe insulin “free” in solution (F), and bound to the material surface (B) within the infusion tubing. The infusion tubing is discretized into N subcylinders. By conservation of mass:
where
The rate constant for adsorption to the material surface (mL/U.min) is
The first element has input concentration
Total adsorptive capacity of a material surface is modeled as a hyperbolic function of flow rate, based on previous results. 24 For PE materials:
Appendix 2: Translation of Flow Rates to U/kg/h for Intensive Care Patients
| Conc. (U/mL) | Flow rate (mL/h) | Flow rate (U/kg/h) |
|||||
|---|---|---|---|---|---|---|---|
| Body weight (kg) |
|||||||
| 1 | 3 | 10 | 30 | 50 | 70 | ||
| 0.2 | 0.1 |
|
0.007 | 0.002 | 0.001 | 0.000 | 0.000 |
| 0.2 |
|
|
0.004 | 0.001 | 0.001 | 0.001 | |
| 0.5 |
|
|
|
0.003 | 0.002 | 0.001 | |
| 1 |
|
|
|
0.007 | 0.004 | 0.003 | |
| 2 | 0.400 |
|
|
|
0.008 | 0.006 | |
| 3 | 0.600 |
|
|
|
|
0.009 | |
| 1.0 | 0.1 | 0.100 |
|
|
|
|
0.001 |
| 0.2 | 0.200 |
|
|
|
|
0.003 | |
| 0.5 | 0.500 |
|
|
|
|
0.007 | |
| 1 | 1.000 | 0.333 |
|
|
|
|
|
| 2 | 2.000 | 0.667 |
|
|
|
|
|
| 3 | 3.000 | 1.000 | 0.300 |
|
|
|
|
| 4 | 4.000 | 1.333 | 0.400 |
|
|
|
|
Abbreviation: U, units of insulin.
Note.Flow rates in bold are more common to clinical practice.
Declaration of Conflicting Interests
The author(s) declared no potential conflicts of interest with respect to the research, authorship, and/or publication of this article.
Funding
The author(s) disclosed receipt of the following financial support for the research, authorship, and/or publication of this article: NZ National Science 7 Science for Technological Innovation (SfTI) and Callaghan Innovation NZ, grant #CRS-S3-2016, Royal Society of New Zealand Cook Fellowship #JCF-UOC-1501, Tertiary Education Commission of NZ, MedTech Centre of Research Excellence, #3705718.