
Abstract
Background:
The objective of this study was to estimate the combinations of total bias and total imprecision required for devices to meet the Food and Drug Administration (FDA) specifications using Monte Carlo simulation rather than collection and analysis of experimental data.
Methods:
A model Gaussian distribution of true-glucose values was altered by adding bias and imprecision to create measured-glucose values affected by analytic error. The fraction of measured-glucose values that met the 2018 FDA criteria for blood glucose monitoring system (BGMS) or self-monitoring blood glucose (SMBG) devices was determined as a function of bias and imprecision.
Results:
The BGMS model determined that a maximum total imprecision of 6% was required with no bias, and with a total bias of +10 mg/dL the total imprecision allowed was reduced to 5% to achieve the 95% FDA performance expectation: 95% of results ≥75 mg/dL within ±12% and 95% of results <75 mg/dL within ±12 mg/dL. The SMBG model determined that a maximum total imprecision of 6% was required at no bias, and with a total bias of +10 mg/dL the total imprecision allowed was reduced to 4% to achieve the 98% FDA expectation: 98% of results ±75 mg/dL within ±15% and 98% of results <75 mg/dL within ±15 mg/dL.
Conclusions:
The 2018 FDA guidance criteria require strict conditions for glucose meter clinical trials to achieve <10 mg/dL total bias and total imprecision of <5%. Total imprecision and bias values assessed in models in this study represent the cumulative imprecision and bias errors for the glucose meters, the reference method, and preanalytic processes.
Introduction
Performance expectations for glucose meters have and will continue to be scrutinized to ensure optimal clinical accuracy. Clinical accuracy is a term that describes clinical treatment decisions based on test results that can ultimately affect clinical outcome. 1 In 2010, the Food and Drug Administration (FDA) held a public forum to explore expectations for appropriate analytical and clinical requirements for glucose meters in response to patient adverse events and deaths reported in its MAUDE (Manufacturer and User Facility Device Experience) database. At that time, ISO 15197:2003 expectations (95% of results must fall within ±15 mg/dL for glucose concentrations <75 mg/dL and within ±20% at concentrations ≥75 mg/dL) were generally agreed to be acceptable performance expectations for glucose meters. The FDA published two final guidance documents in 2016 for accuracy criteria of blood glucose monitoring systems (BGMSs) and self-monitoring blood glucose (SMBG) systems that were updated in 2018.2,3 These documents were intended for glucose meter manufacturers, not providers, and were developed as recommendations for pre-market assessment of blood glucose testing devices and closely resemble the accuracy EU standards of ISO 15197:2013 4 and Clinical Laboratory Standards Institute standards in POCT12-A3. 5 The advantages and disadvantages of each system have been debated.6,7 The aims of the FDA recommendations are to promote the accuracy and safety of glucose meters for both hospital and self-monitoring requirements but do not assure 100% safety in all post-market patient applications.
In 2001, Boyd and Bruns described the use of a Monte Carlo simulation model to derive the quality specifications for glucose method precision and accuracy in order to meet the 1987 quality goals of the American Diabetes Association and 1988 Clinical Laboratory Improvement Amendments.8,9 In 2010, Karon et al applied this approach to investigate how glucose meter error could influence insulin dosing errors with a tight glycemic control protocol for intensive care patients. 10 DuBois et al also used this approach, in addition to others, to assess BGMS evaluation data to determine its safety in critically ill patient care settings. 11 The objective of the current study was to use the Monte Carlo simulation model described by Boyd and Bruns to determine the combinations of total imprecision and total bias that are required to meet the 2018 FDA guidance performance specifications for BGMS and SMBG systems.
Materials and Methods
Simulation Models
We created programs in STATA/IC 15.1 (Stata Corp LLC, College Station, TX, USA) to carry out Monte Carlo trials to simulate the effect of adding assay imprecision and bias to glucose methods. In the simulation programs, we first generated a set of true-glucose results using a random number generator following a Gaussian distribution with mean 163 mg/dL (9.0 mmol/L) and SD of 35 mg/dL (1.9 mmol/L) as described by Boyd and Bruns for models and programs.8,9 The initial (input) glucose values were considered the true glucose concentrations (GlucT). A second series of glucose values was derived by adding imprecision and bias and labeled measured-glucose (GlucM) depicted in the following equations.
The 2018 FDA guidance document described analytic goals for glucose ≥75 mg/dL (4.2 mmol/L) in units of percentage, and for glucose <75 mg/dL in units of mg/dL2,3:
For BGMS devices:
95% of results ≥75 mg/dL within ±12% and
95% of results <75 mg/dL within ±12 mg/dL
For SMBG devices
98% of results ≥75 mg/dL within ±15% and
98% of results <75 mg/dL within ±15 mg/dL
A Gaussian distribution (mean 163, SD 35) in mg/dL was used to derive the following three datasets: (a) data truncated to glucose ≥75 mg/dL for Monte Carlo sampling to assess the accuracy criteria by percentage and (b) data truncated to glucose <75 mg/dL to assess the accuracy criteria in mg/dL, or (c) use of the whole dataset (ie, no truncation). The modified results for the BGMS model that exceeded the FDA guidance limits of ±12% or ±12 mg/dL were counted and the fraction determined. The modified results for the SMBG model that exceeded the FDA guidance limits of ±15% or ±15 mg/dL were counted and the fraction determined. In the models, the coefficient of variation (CV) was increased in increments of 1%. Bias was added in increments of 1% or 1 mg/dL. Descriptions of the distribution datasets and Monte Carlo resampling used are provided in each figure legend.
For glucose ≥75 mg/dL: GlucM = GlucT + [n(0,1) × CV × GlucT] + [Bias% × GlucT ]
For glucose <75 mg/dL: GlucM = GlucT + [n(0,1) × CV × GlucT] + [Bias]
GlucT: the true glucose concentration;
GlucM: the measured glucose concentration reflecting the effects of analytical imprecision and bias.
CV: the CV of the assay expressed as a fraction assumed to be imprecision solely contributed by the glucose meter.
n(0,1): a random number drawn from a Gaussian distribution with a mean of 0 and an SD of 1 to reflect assay imprecision.
Bias%: the assay bias (expressed as a fraction).
Bias: the assay bias (expressed in mg/dL).
Results
The BGMS Model
The FDA guidance criteria document for BGMSs has two component rules for glucose results above or below 75 mg/dL. These component rules were analyzed separately in Figure 1(a) and (b) and then analyzed together in Figure 1(c). The green line in Figure 1(a) shows the influence of total imprecision and total bias to meet the BGMS rule of 95% of GlucM values within ±12% of GlucT values for values ≥75 mg/dL because the distribution of simulation data was truncated at 75 mg/dL. For context, the isocontour lines in light blue and blue that limit 90% and 85% of pairs of results within ±12% are included for comparison. In the model’s Gaussian distribution of glucose values with mean 163 mg/dL and SD of 35 mg/dL, 98.4% of the data exceed 75 mg/dL (z = −2.14). It appears that with no bias, the maximum precision that meets the BGMS criteria is a CV of <6%. The isocontour line for 95% depicts that greater precision is required if a BGMS method is prone to bias, but at either +4% or −4% bias, the CV required for data ≥75 mg/dL is ~5%. As expected by the BGMS criteria, the bias cannot be above +12% or below −12% and in Figure 1(a) at a CV of 0% all isocontour curves meet the vertical axis for bias at +12% or −12%.
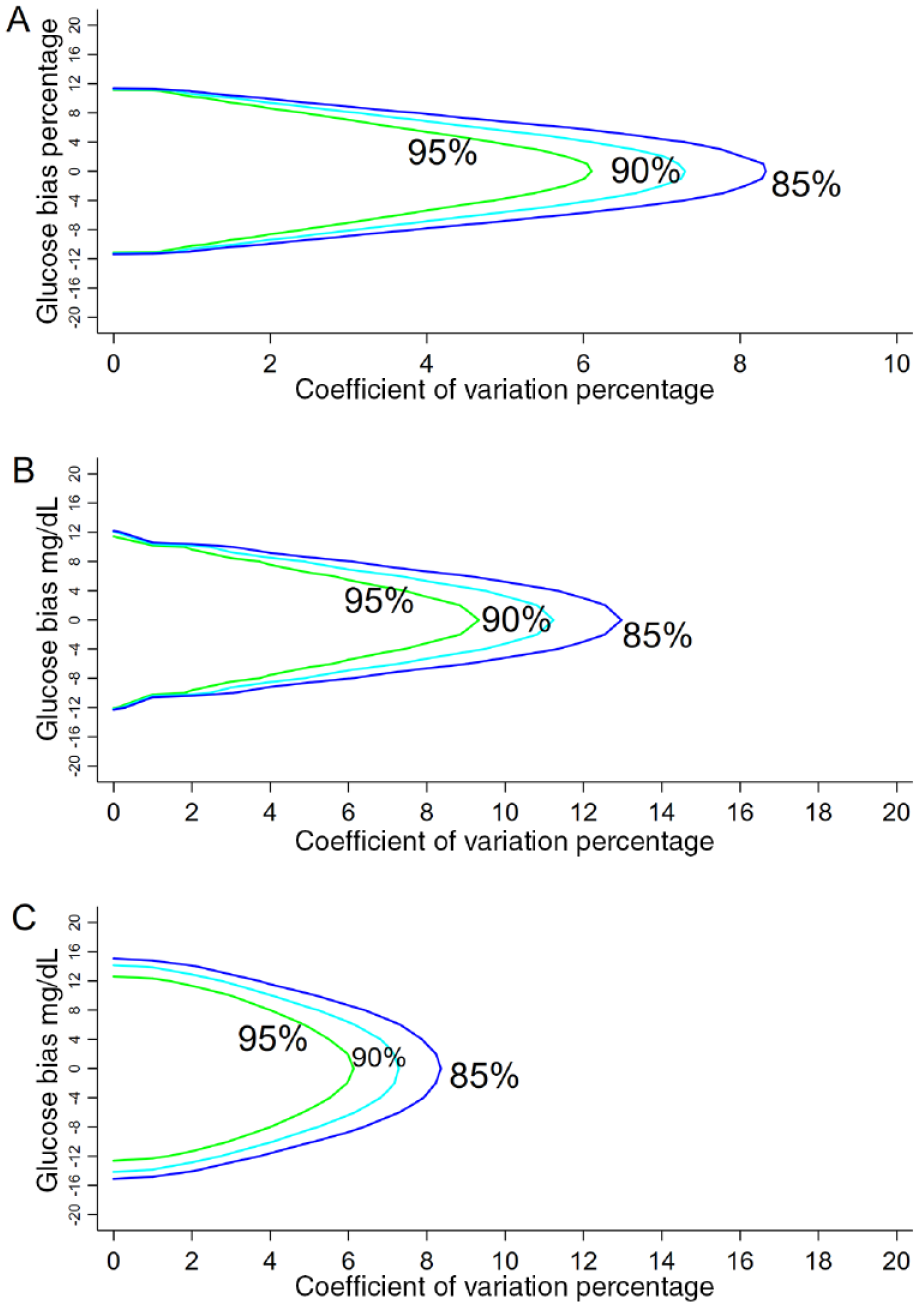
Contour plots of the fraction of BGMS glucose results that exceed the FDA BGMS 2018 Guidelines as functions of imprecision (coefficient of variation %) and bias in Monte Carlo simulation. The model used an initial glucose distribution with a Gaussian distribution (mean 163, SD 35). 8 (a) BGMS model with glucose ≥75 mg/dL: The glucose distribution was truncated to contain glucose ≥75 mg/dL n = 20 000 with 10 repeats. For pairs of glucose results within ±12%, the solid green line denotes the limit with 95% of results; the light blue line denotes the limit with 90% of pairs and the dark blue line denotes the limit of 85% of glucose results. (b) BGMS model with glucose <75 mg/dL: The glucose distribution was truncated to contain glucose <75 mg/dL n = 10 000 with 10 repeats. The solid line denotes the limit with 95% of pairs of glucose results within ±12 mg/dL, the light blue line denotes the limit with 90% of pairs and the dark blue line denotes the limit of 85% of glucose results. (c) BGMS model with the whole glucose distribution n = 20 000 with 10 repeats. The solid line denotes the limit of 95% of the total number of pairs of glucose values within ±12% for reference glucose ≥75 mg/dL and ±12 mg/dL for reference glucose <75 mg/dL, the light blue line denotes the limit with 90% of pairs and the dark blue line denotes the limit of 85% of glucose results.
Figure 1(b) shows the influence of total imprecision and total bias to achieve the BGMS criteria of 95% within ±12 mg/dL for values <75 mg/dL using the distribution data truncated above 75 mg/dL. Only 1.6% of the glucose values in the distribution were <75 mg/dL, so the overall influence of the lower glucose values on the combined BGMS criteria was expected to be small; however, this influence can be assessed by simulation with <75 mg/dL data. A green isocontour line in Figure 1(b) shows that with no bias, precision needs total CV values of less than ~9.5% for 95% of pairs of results to be within ±12 mg/dL. As expected for values <75 mg/dL, the bias cannot be above +12 mg/dL or below −12 mg/dL and at a CV of 0% the isocontour lines meet the vertical axis for bias at +12 mg/dL or −12 mg/dL.
Figure 1(c) shows the influence of total imprecision and bias on the combined BGMS criteria for ≥75 mg/dL and <75 mg/dL that would apply to clinical trial observations. The BGMS requirements were applied separately in units of percentage bias (≥75 mg/dL glucose) and fixed bias in mg/dL (<75 mg/dL glucose) and the combined outcome of the model was displayed in units of the bias mg/dL scale in Figure 1(c). The green isocontour line curve that limits 95% of the results closely resembles the green curve in Figure 1(a) with ~6% CV at zero bias because 98.4% of the glucose values in the simulation data set exceeded 75 mg/dL. With bias of +10 mg/dL, total imprecision up to 5% CV will meet the guideline. In retrospect, we realized that this observed maximum tolerable CV value of ~6% at zero bias in Figure 1(a) and (c) could be predicted: CV is a measure of SD in units of percentage of the mean. Assuming a Gaussian distribution of GlucM−GlucT values has a 95% confidence interval that is bound by ± 1.96z (z: SD) encompasses ±12%, then 1.96z = 12% or or z = 6.1% as observed in Figure 1(a) and (c), at zero bias.
The SMBG Model
The FDA guidance criteria for SMBG systems have two component rules that are above or below 75 mg/dL. These SMBG component rules were analyzed separately and then combined as performed for the BGMS model. The green line in Figure 2(a) shows the influence of total imprecision and total bias to meet the SMBG rule 98% within 15% for values ≥75 mg/dL using the simulation data truncated below 75 mg/dL. Isocontour lines in shades of blue that encompass 95%, 90%, and 85% of pairs for results within 15% are included for comparison. It appears that with no bias, the total imprecision of SMBG systems needs a CV of less than 6.5%. The green isocontour line depicts that greater precision is required if the method is prone to bias, but even with up to + or −4% bias, the total CV required for data ≥75 mg/dL is less than ~5.5%.
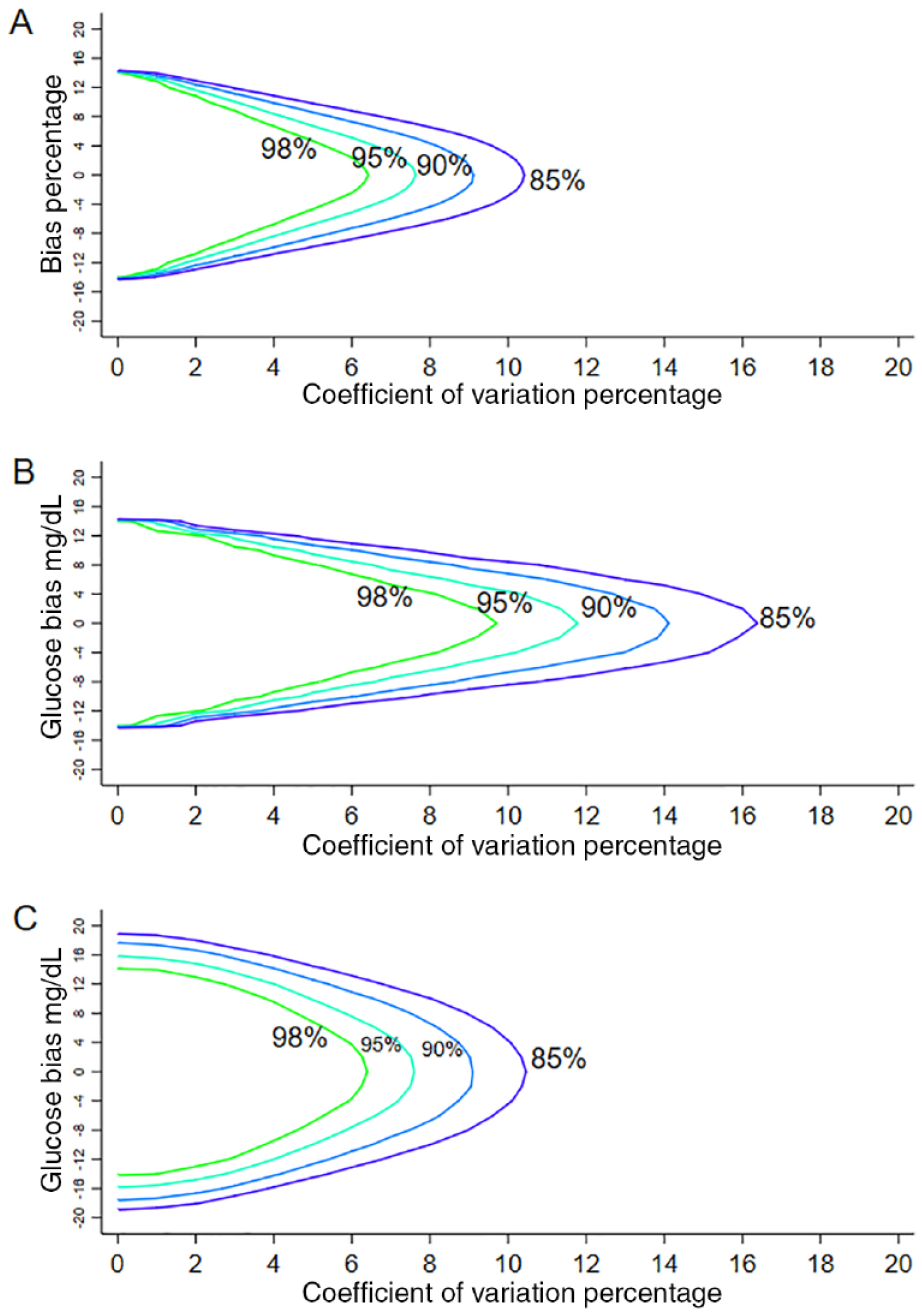
Contour plots of the fraction of SMBG results that exceed the FDA 2018 Guidelines as functions of imprecision (coefficient of variation %) and bias in Monte Carlo simulation. The model used an initial glucose distribution with a Gaussian distribution (mean 163, SD 35). 8 (a) SMBG model with glucose ≥75 mg/dL: The glucose distribution was truncated to contain glucose ≥75 mg/dL n = 20 000 with 10 repeats. For pairs of glucose results within ±15%, the solid green line denotes the limit with 98% of results; the lighter blue lines denote the limit with 95% and 90% of pairs and the dark blue line denotes the limit of 85% of glucose results. (b) SMBG model with glucose <75 mg/dL: The glucose distribution was truncated to contain glucose <75 mg/dL n = 10 000 with 10 repeats. The solid line denotes the limit with 98% of pairs of glucose results within ±15 mg/dL, the lighter blue lines denote the limit with 95% and 90% of pairs and the dark blue line denotes the limit of 85% of glucose results. (c) SMBG model with the whole glucose distribution n = 20 000 with 10 repeats. The solid line denotes the limit of 98% of the total number of pairs of glucose values within ±15% for reference glucose ≥75 mg/dL and ±15 mg/dL for reference glucose <75 mg/dL, the lighter blue lines denote the limit with 95% and 90% of pairs and the dark blue line denotes the limit of 85% of glucose results.
Figure 2(b) shows the influence of total imprecision and total bias on the SMBG rule of 98% within ±12 mg/dL for values <75 mg/dL using data truncated above 75 mg/dL. It appears that with no bias, the imprecision of SMBG system needs a CV of approximately 9.5%, which is an SD of 7.1 mg/dL at 75 mg/dL. As expected by this component of the rule, the bias cannot be above +15 mg/dL or below −15 mg/dL and at CV of 0% the isocontour lines meet the vertical axis for bias at +15 mg/dL or −15 mg/dL.
Figure 2(c) shows the influence of total imprecision and total bias on the combined SMBG rules for ≥75 mg/dL and <75 mg/dL that would apply in clinical trial observations. The green curve that limits 98% of the results closely resembles the curve in Figure 2(a) with ~6% CV at zero bias because most glucose values in the simulation data set exceeded 75 mg/dL. The green isocontour line indicates that with a total bias of 10 mg/dL, precision of no more than 4% CV is required for 98% of pairs of results to meet the guideline. This observed maximum CV value of ~6% at zero bias can also be predicted: assuming a Gaussian distribution of GlucM−GlucT values a 98% confidence interval is bound by ±2.325z (SD) for ±15%: then 2.325z = 15% or z = 6.4% as observed in Figure 2(a) and the value of ~6% observed in Figure 2(c) at zero bias.
Discussion
In 2016, the FDA published two guidance documents regarding the accuracy criteria for BGMS and SMBG systems, which were updated in 2018.2,3 These guidance criteria documents provide performance criteria for manufacturers for pre-market evaluation of BGMS and SMBG systems. The BGMS and SMBG accuracy criteria equations reproduced in the methods section are clear but they have implications for instrument specifications and clinical trial design that are not obvious. This simulation study was undertaken to address practical questions: What are the precision and accuracy (ie, lack of bias) required for devices to meet the 2018 FDA criteria? Do the FDA-required precision and accuracy for devices differ at glucose levels <75 mg/dL and ≥75 mg/dL? How do the required precision and accuracy values differ for BGMS and SMBG devices? In this study we aim to evaluate total bias and total imprecision, which are terms that refer to the sum of errors derived from the reference method, the glucose meter, and preanalytic processes. We applied Monte Carlo simulation models to determine the total bias and total imprecision that can be tolerated in premarket analytic studies. This assessment is indisputably useful to instrument manufacturers but it also provides error estimates for clinical laboratorians to consider when such BGMS and SMBG devices are employed.
In the initial applications of Monte Carlo simulation modeling to glucose measurement by Boyd and Bruns, the authors emphasized that there was no error in the true glucose values. 8 Bias and imprecision were added in the model to create measured glucose values and it was interpreted that the bias and imprecision values of the model represented the bias and imprecision of the measuring devices, such as glucose meters. 8 In previous studies we also assumed that there was no error in the true values and that bias and imprecision in simulation models represented the properties of the measuring devices such as glucose meters and coagulation testing devices.11,12 In this report we used the model equations described by Boyd and Bruns, but we intend that the models in this report have a new meaning and represent the relationship between measured-glucose and reference-method glucose values like the pairs of glucose values collected in a pre-market clinical trial evaluation. With this new interpretation, the bias and imprecision values added in the models are intended to represent the “total bias” and “total precision” in clinical trial scenarios. The total bias and total imprecision added in the simulation models represent the sum of errors derived from the reference method, the glucose meter method, and the preanalytic process involved in the trial.
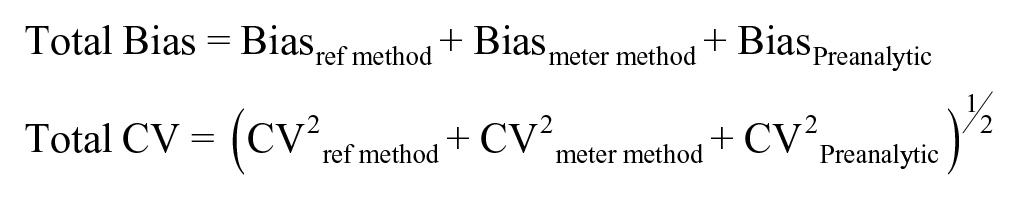
Awareness that the simulations in this report are intended to mimic clinical trial conditions with total bias and total imprecision offers new insight to interpret the results for BGMS and SMBG models in Figures 1 and 2. The BGMS model in Figure 1 determined that a maximum total imprecision of 6% was required with no bias, and with total bias of +10 mg/dL the total imprecision allowed was reduced to 5% to achieve the 95% performance expectation. The challenge of pre-market evaluations is that the bias and imprecision contributed by preanalytic processes or reference methods are not zero, which reduces the precision and bias allowed for glucose meters, as shown in the equations presented earlier. This study did not establish the bias and imprecision contributed by preanalytic processes and the reference method. It is possible that bias conferred by preanalytic process could exceed the total bias allowed unless carefully controlled in the clinical trial design. The impact of precision can be estimated. For example, using the equations presented earlier, if the total precision allowed is 5% and the CVref method is 2% and CVpreanalytic is 2%, then the precision remaining for the CVmeter method is 2.8%.
The SMBG model outcomes shown in Figure 2 determined that a maximum total imprecision of 6% was required at no bias, and with a total bias of +10 mg/dL the total imprecision allowed was reduced to 4% to achieve the 98% FDA expectation. The simulation outcomes in Figure 2 indicate that the SMBG criteria are more relaxed than the BGMS criteria in Figure 1, but only modestly increased total imprecision and increased total bias can occur to meet the 98% FDA SMBG expectations.
This study has several limitations: This analysis involves a simulation model rather than collection and analysis of experimental data and all models are incomplete representations of reality. All simulation models are subject to this criticism; however, it should be noted that the studies described in this report are well suited for simulation analyses rather than expensive clinical trials that would require very large numbers of participants. This simulation model addresses imprecision and bias but does not consider protocol-specific bias or random patient interferences. 13 Real-world paired meter and central laboratory results demonstrate the sum of all types of error and this simulation model offers useful insight into a portion of the real-world error. 14 This analysis was limited to use of a single Gaussian distribution of glucose values, and evaluation of other artificial or natural glucose datasets was beyond the scope of this report. The Gaussian distributions are highly reproducible and convenient but are incomplete representations of post-market errors that may lead to skewed glucose distributions. Boyd and Bruns found that simulation models for glucose error are not sensitive to the frequency distribution of glucose values but this observation needs to be further investigated by future studies. 8
In conclusion, strict protocols for glucose meter clinical trials will be required to achieve <10 mg/dL total bias and total imprecision of <5%. Total imprecision and bias values assessed in models in this study represent the sum of components of imprecision and bias for the glucose meters, the reference method, and preanalytic processes. Variation in each component needs to be considered in the design, performance, and interpretation of pre-market clinical trials to meet the 2018 FDA guidance criteria for BGMS and SMBG systems.
Footnotes
Declaration of Conflicting Interests
The author(s) declared no potential conflicts of interest with respect to the research, authorship, and/or publication of this article.
Funding
The author(s) received no financial support for the research, authorship, and/or publication of this article.