
Abstract
Background:
Oral delivery of insulin was recently demonstrated to have therapeutic relevance in patients with diabetes. Insulin receptors are expressed in the gastrointestinal tract and can be activated by insulin in the bloodstream, but it is not known if the large amount of insulin in the intestinal lumen required for sufficient oral delivery will induce a different effect. The aim of this study was to compare the acute effect in the intestine of insulin administered in the intestinal lumen with that of insulin administered by a parenteral route.
Method:
Intraintestinal (ii) injection in the mid-jejunum of anaesthetized rats with insulin analogue 106 (I106), formulated with the absorption-enhancer sodium caprate, was used as an animal model of oral insulin administration. As control treatment, rats were treated with I106 by iv infusion according to algorithms which precisely mimicked the pharmacokinetic and pharmacodynamic properties of ii administered I106. Several fold more I106 was administered by ii injection than by iv infusion. Phosphorylated Akt (Ser473) was used as indicator of insulin-stimulated acute effects in the intestine.
Results:
Treatment with I106 resulted in activation of Akt in the intestine, with no significant difference between the effects of ii or iv administration.
Conclusion:
The results from this rat model of orally administered insulin indicate that the unabsorbed insulin in the intestinal lumen after oral administration will not result in an enhanced acute effect in the intestine.
Oral administration of insulin to people with diabetes has been explored since the discovery of insulin in the 1920s. 1 It is a challenge to obtain sufficient absorption of a peptide such as insulin from the gastrointestinal tract. However, recent data from a phase 2 clinical trial demonstrated that in combination with an absorption-enhancing technology, oral administration of a basal insulin analogue has therapeutic relevance. 2 Based on the known mitogenic effect of insulin in vitro, unabsorbed insulin in the gastrointestinal tract has been suggested to have growth-stimulating effects locally in the intestine.1,3 Insulin and IGF-1 receptors are expressed in the intestine, and a few studies have shown that sc treatment with insulin is able to activate insulin receptor signaling in the large intestine in vivo.4,5 However, the effect in the small intestine, where the absorption of orally administered insulin is anticipated to take place, is not well characterized.
The aim of the present study was to explore the acute effect of orally administered insulin compared to that of parenterally administered insulin. This was conducted to address whether insulin absorbed from the gastrointestinal tract could have local effects in the intestine different from that of exogenous insulin circulating only in the bloodstream. For this purpose, an animal model was established, where oral administration of insulin was mimicked by injection of a liquid formulation of an insulin analogue and an absorption-enhancer directly into the mid-jejunum (ie, intraintestinal [ii] injection). The rats were treated with the insulin analogue 106 (I106), which is designed to have improved stability toward enzymatic degradation (see patent US9018161B2 and the report from clinical trial NN1952-3646, available at www.novonordisk-trials.com/studie/151). For ii injection I106 was formulated with the absorption-enhancer sodium caprate which was also used in GIPET® tablets.2,6,7 To obtain pharmacokinetic (PK) and pharmacodynamic (PD) effects similar to parenteral administered I106, several fold more I106 was administered by ii injection. The acute effect in the intestine and selected reference tissues was compared between groups by assessing the levels of phosphorylated (ie, activated) Akt (Ser473) (P-Akt), which is activated upon stimulation of insulin and IGF-1 receptors and frequently used as a marker of an acute insulin-mediated response. By comparing the effect of ii and iv administration of I106, any difference would be expected to be due to luminal activation of receptors by the ii administered I106.
Methods
Animals
Outbred male Sprague-Dawley rats were purchased from Taconic (NTac:SD), at an age of 8 weeks and bodyweight of 250-270 g. The rats were housed in transparent type VI macrolone cages (floor area 1800 cm2) with five animals per cage at 18-24ºC, relative humidity of 30-70%, air change 8-15 times/hour and light/dark cycle of 12/12 hours. The rats were acclimatized for minimum seven days and had unrestricted access to a standard rodent diet (Altromin 1324, Brogården, Hørsholm, Denmark) and tap water. The day before an experiment food was removed from 14.00 o’clock. The following day, rats were anesthetized by sc injection of a 1:1:2 mixture of Hypnorm (VetaPharma Ltd, Sherburn-in-Elmet, UK), Dormicum (Hoffmann-La Roche AG, Basel, Switzerland) and deionized water, respectively. Anesthesia was supplemented every 40th min, starting 20 min after induction. All rats had a 20 cm long PE50 catheter attached to a 1-ml syringe prefilled with I106/vehicle placed in mid-jejunum and a 15 cm Tygon® tubing S-50-HL catheter placed in the external jugular vein for infusion of I106/vehicle. The procedures for catheterization are described in Supplementary Information.
Design of Animal Experiments and Treatment with Insulin or Vehicle
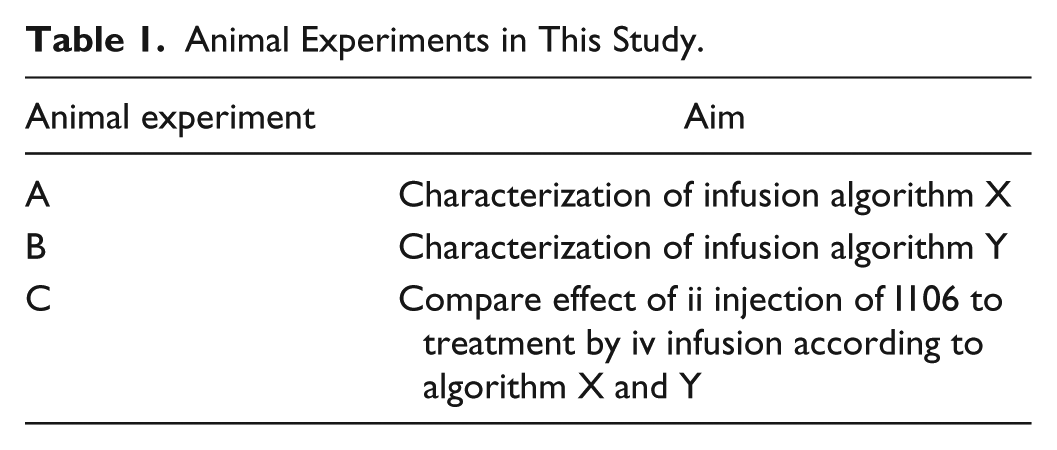
In a pilot experiment rats were treated with I106 in doses of 5-200 nmol/kg by ii injection. Doses of 15-50 nmol/kg decreased blood glucose with ≈20-50 mg/dl compared to vehicle and were on the linear part of the dose-response curve for lowering of blood glucose (Supplementary Figure 1). The present study was therefore performed within this range of doses and blood glucose lowering. Furthermore, to fully mimic the PK/PD effects of ii injection of I106 in a control group, it was decided to develop algorithms for iv infusion of I106. This study therefore comprised three animal experiments. In experiment A and B algorithms for iv infusion of I106 were characterized and in experiment C the effect of ii injection of I106 in the intestine was compared to iv infusion according to the algorithms (Table 1).
Animal Experiments in This Study.
Experiment A and B each comprised two groups of 25 animals. In each experiment, one group was treated with I106 40 nmol/kg by ii injection via the catheter placed in mid-jejunum, and the other group was treated with I106 by iv infusion according to infusion algorithm X (experiment A) or infusion algorithm Y (experiment B). When I106 was administered by ii injection, vehicle was infused iv and vice versa. I106 for ii injection was formulated with concentration 100 µM in a vehicle containing 55 mg/ml sodium caprate and 50 mM sodium phosphate (Sigma-Aldrich, Brøndby, Denmark). I106 for iv infusion was formulated with concentration 0.5 µM in a vehicle containing 5 mM phosphate, 140 mM sodium chloride and 70 ppm polysorbate 20 (Sigma-Aldrich). Vehicle or I106 was infused iv via the jugular catheter according to algorithm X or Y using LabVIEW software (National Instruments, Austin, TX, USA) and a Harvard PHD 22/2000 Advance Syringe Pump (Harvard Apparatus, Cambridge, MA, USA), mounted with 10-ml syringes containing vehicle or I106, connected to the jugular catheter. Blood samples were collected 2, 5, 10, 20, 30, 60, and 120 min after treatment.
Experiment C comprised one group with 20 animals (group 1) and two groups with 35 animals each (group 2 and 3). The design of the experiment is shown in detail in Supplementary Table 1. Rats in group 1 were treated with vehicle by ii injection and iv infusion as described for experiment A and B. Rats in group 2 were treated with I106 by iv infusion according to algorithm X or Y as described above, while rats in group 3 were treated with I106 40 nmol/kg by ii injection as described above. Blood samples were collected immediately before treatment, 2 and 5 min after treatment. Right after euthanasia samples were collected from the liver (left lateral lobe) and mid-jejujumum (two cm piece centered around the intestinal catheter). Tissue samples from five rats in each group were used for immunohistochemistry (IHC). Tissue samples from the remaining rats were analyzed by SureFire ELISA. The 5 min time-point was chosen as it was the time for maximal plasma concentration (tmax) of I106, and because a pilot experiment showed P-Akt levels also peaked at this time-point (data not shown).
Analysis of Blood Glucose and Plasma Concentration of Insulin
Blood glucose was measured in heparin-stabilized blood on a Biosen apparatus (EKF Diagnostics, Barleben, Germany) as described previously. 8 Plasma for assessment of plasma concentration of I106 was collected in EDTA-coated Microvette 200 K3E tubes (Sarstedt AG & Co, Nümbrecht, Germany) and measured as described previously. 9
Calculation of Pharmacokinetic Parameters
In experiment A and B area under the curve (AUC) describing plasma concentration of I106 from time 0 min and extrapolated until infinity (AUC0-inf) was calculated as described previously 10 using Excel (Microsoft, Redmond, WA, USA). In experiment C AUC describing plasma concentration of I106 was calculated from time 0 to 5 min after treatment using the software GraphPad Prism (GraphPad Inc, La Jolla, CA, USA).
Design of Infusion Algorithms
For development of infusion algorithm X, PK profiles from a previous study where I106 was injected iv in rats (data not shown) were fitted to a two-compartment model using the software Phoenix WinNonlin (Pharsight Corp, Sunnyvale, CA, USA). Geometric mean of the resulting model parameters resulted in Kel = 0.0550 1/min, K12 = 0.279 1/min, K21 = 0.0780 1/min and V1 = 0.0449 l/kg. To establish an infusion profile to mimic gut injection, PK profiles from nine animals treated by ii injection with I106 40 nmol/kg were deconvoluted using the estimated model parameters listed above. For development of infusion algorithm Y, data from experiment A describing plasma concentration versus time following iv infusion was subject to a population PK analysis using the software NONMEM® 7.2.0 (Icon Plc, Dublin, Ireland). A two-compartment iv model with infusion rates from experiment A as dosing input described the data well. The population typical values of macro-constant parameters A, B, alfa and beta were used for deconvolution of the gut injection data from experiment A, using Phoenix WinNonlin. Parameters A of 15.91 pmol/kg, B of 2.78 pmol/kg, alpha of 0.291 min-1 and beta of 0.0205 min-1 obtained from population PK analysis were inserted as exponential term parameters for the deconvolution. The resulting mean input rates in pmol/min/kg were adjusted to give a dose 40 nmol/kg prior to the use as infusion algorithm in experiment B. The profiles from algorithm X and Y were finally summarized into 0.1-min intervals of constant infusion (See Supplementary Table 2).
Preparation of Tissue Lysates
Tissue samples were lysed in Cell Extraction buffer (Invitrogen, Carlsbad, CA, USA), supplemented with 4-(2-aminoethyl)benzenesulfonyl fluoride hydrochloride and Protease Inhibitor Cocktail (Sigma-Aldrich) using a Qiagen Tissue Lyzer (Qiagen, Copenhagen, Denmark). Protein concentration of the supernatant was assessed with the Pierce BCA protein assay kit according to the manufacturer’s instructions (Thermo Fisher Scientific, Hvidovre, Denmark).
AlphaScreen SureFire Phosphorylated Akt Assay
The levels of P-Akt (Ser473) was assessed in samples of liver and jejunum using a commercially available AlphaScreen SureFire Akt 1/2 (phosphorylation at Ser473) Assay Kit (Perkin Elmer, Skovlunde, Denmark), according to the manufacturer’s instructions and normalized to the protein concentration of each sample.
Immunohistochemistry
IHC for P-Akt (Ser473) in sections from jejunum and liver was done essentially as described previously 4 (detailed description in Supplementary Information). The stained slides were scanned in a NanoZoomer 2.0HT slide scanner (Hamamatsu, Hamamatsu City, Japan) and the average optical density in liver and jejunal mucosal section was analyzed with HALO software (Indica Labs, Corrales, NM, USA).
Statistical Analysis
All PK-data followed a log-normal distribution and were therefore plotted as geometric mean values with 95% confidence intervals. Statistical analysis was performed with the software SAS JMP 10.0.2 (SAS Institute Inc, Cary, NC, USA). In experiment A and B, the endpoints blood glucose at 60 and 120 min after treatment, plasma concentration of I106 5 min after start of treatment (C5min) and AUC0-inf were log-transformed and compared between the iv and ii-treated groups using a general linear model. The mean differences and 90% confidence intervals (required for demonstration of bioequivalence 11 ) were calculated on log-scale and back-transformed to obtain ratios. The statistical analysis of experiment C is described in detail in the Supplementary Information. In brief, the endpoints AUC 0-5 min after treatment, C5min and P-Akt levels in liver and jejunum were log-transformed and compared between the groups treated by iv infusion or ii injection in a general linear model. P-Akt levels in tissue samples were for the I106-treated groups compared to the vehicle-treated group, and the group treated with I106 by ii injection was compared to the group treated by iv infusion, with Tukey adjustment for multiple comparisons. Differences between groups on log-scale and corresponding 95% confidence intervals were back-transformed to express differences and confidence intervals as ratios.
Results
Two Algorithms for iv Infusion of Insulin Mimicked the Pharmacokinetic and Pharmacodynamic Properties of ii Injected I106
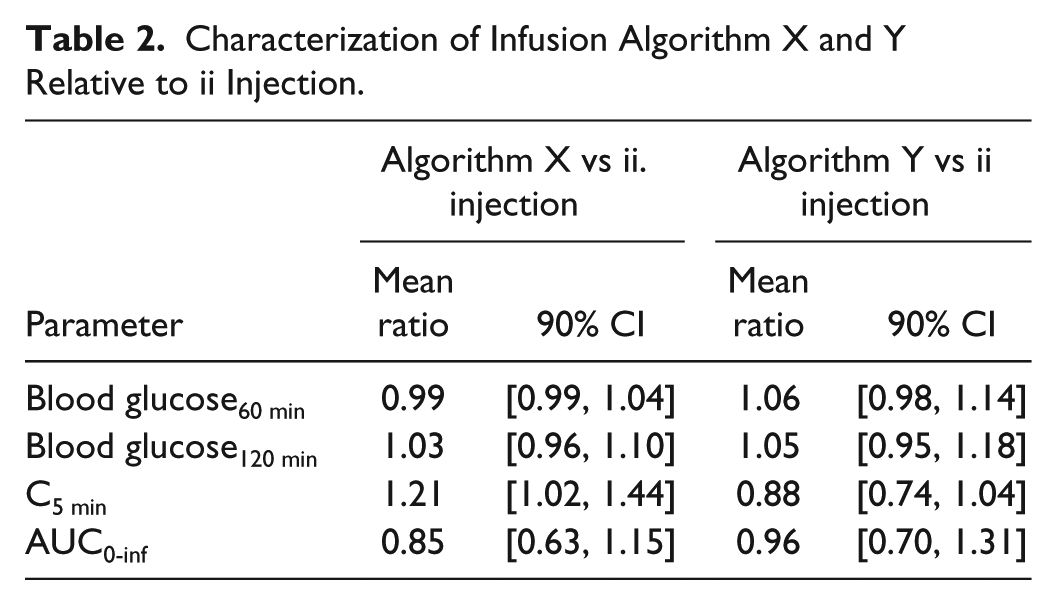
Mean plasma concentration and the effect on blood glucose in rats treated according to infusion algorithm X or Y or by ii injection of I106 is shown in Figures 1A-1D. For all treatments, tmax (median value) was 5 min after treatment. Infusion algorithm X resulted in slightly higher Cmax and slightly faster elimination than treatment by ii injection, whereas infusion algorithm Y resulted in somewhat lower Cmax than treatment by ii injection (Figures 1A and 1C). With both algorithms the effect blood glucose was fully comparable to ii injection of I106 40 nmol/kg (Figures 1B and 1D). All mean ratios between groups were within the interval [0.80, 1.25], which are the limits for demonstration of bioequivalence 11 (Table 2). The limits for the 90% confidence intervals for C5min and AUC0-inf were not within this range, which likely reflects high variability in PK after ii injection and/or an inadequate number of rats per group for formal demonstration of bioequivalence. However, based on the mean ratios, we were confident that both algorithms could mimic PK and PD properties of ii injection of I106 40 nmol/kg sufficiently.
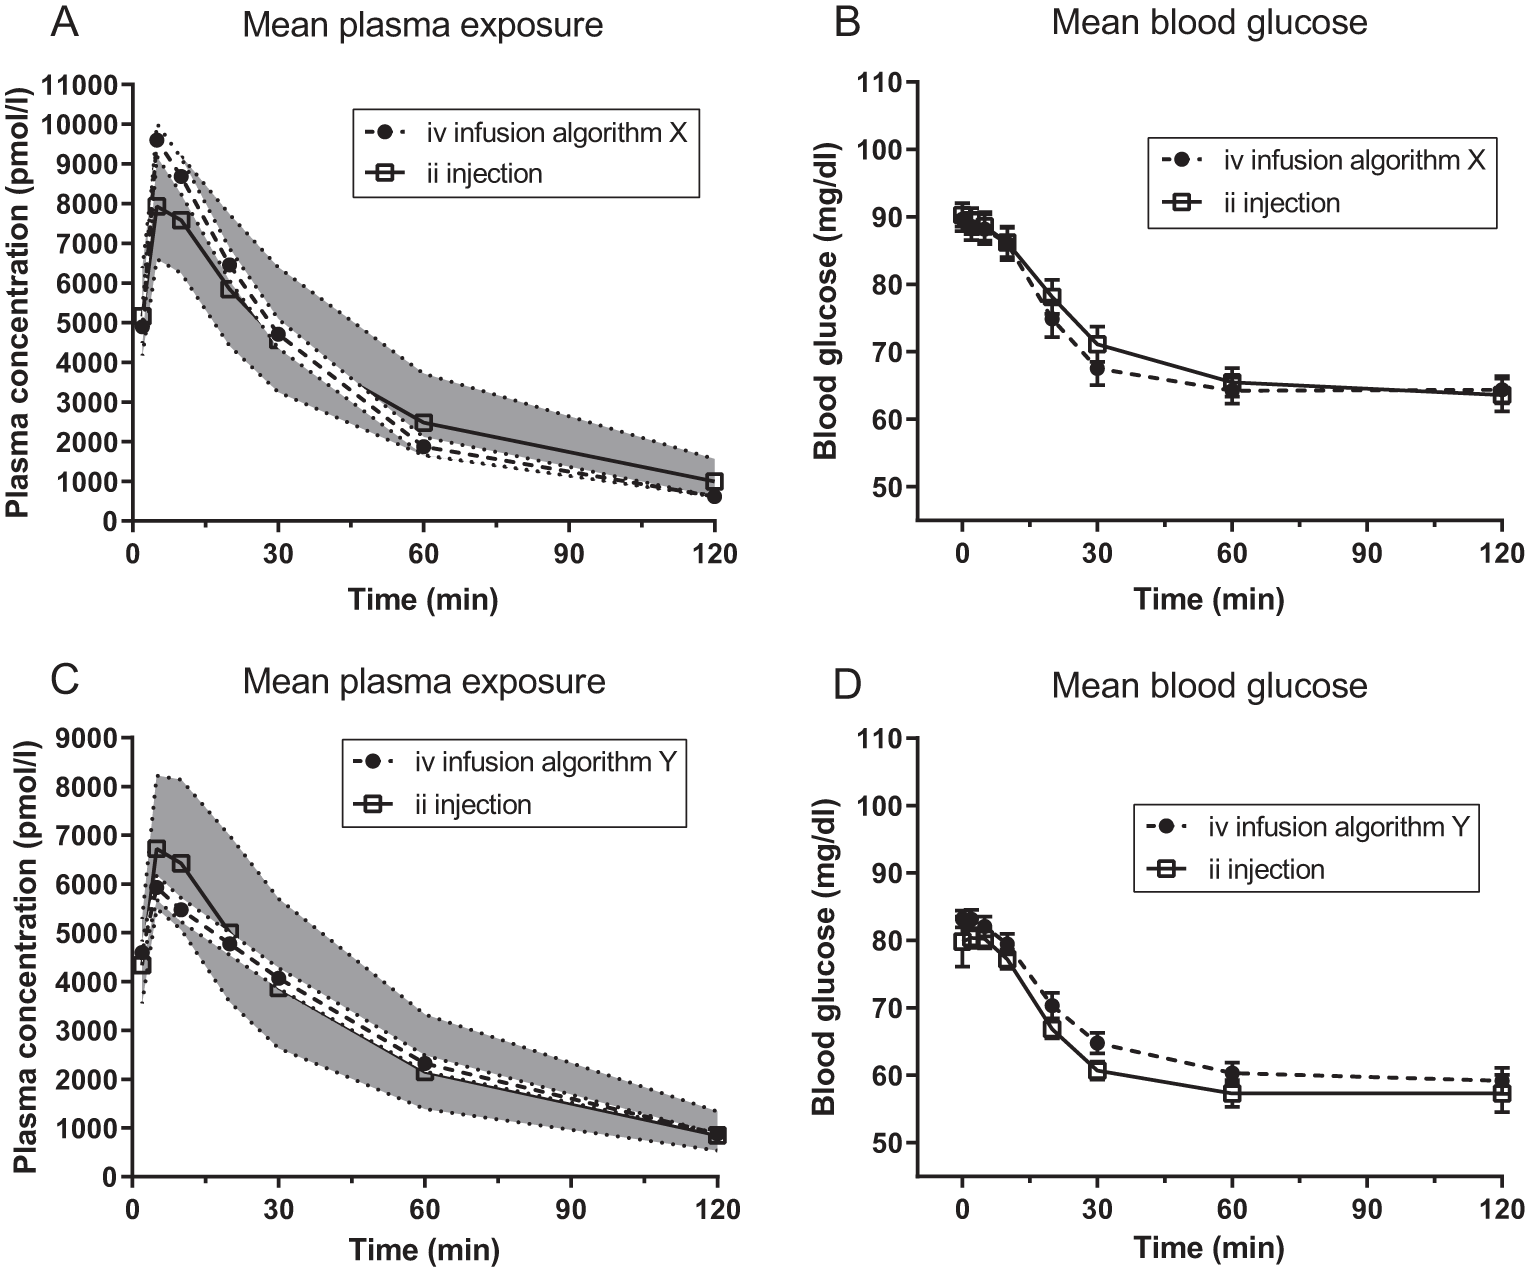
Characterization of infusion algorithm X (A and B) and Y (C and D). Symbols indicate the mean values. The shaded areas and dotted lines in A and C indicate the 95% CI. The error bars in B and D indicate the SEM.
Characterization of Infusion Algorithm X and Y Relative to ii Injection.
Treatment With I106 by Intraintestinal Injection or iv Infusion Resulted in Comparable Activation of Akt in the Intestine
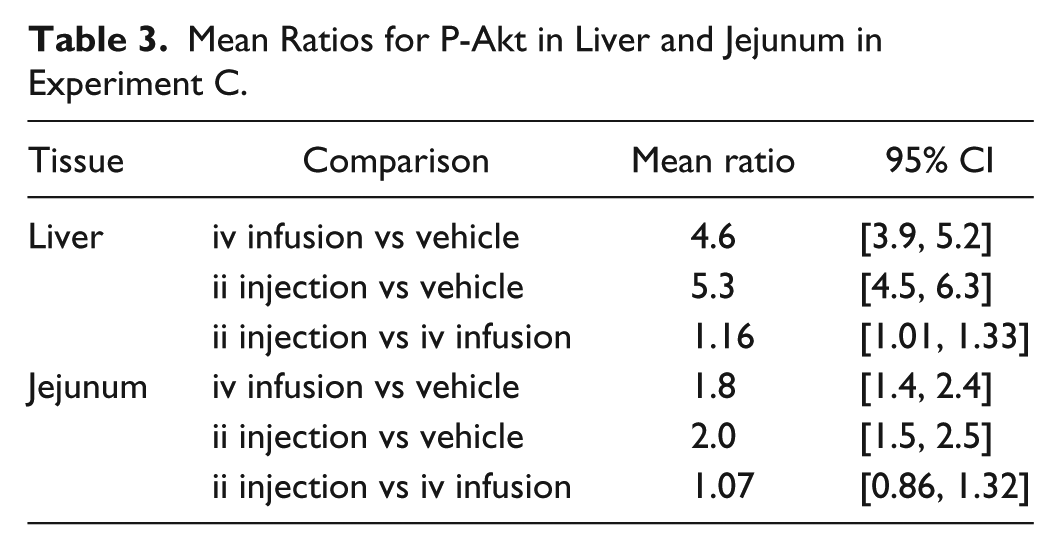
Both infusion algorithm X and Y were used in experiment C to better mimic the relatively greater PK variability seen after ii injection of I106. Treatment by ii injection or iv infusion resulted in comparable plasma concentration at the time of euthanasia and collection of tissue samples and comparable AUC 0-5 min after treatment (Figures 2A-2B), that is, combined use of the two infusion algorithms successfully mimicked ii injection. In the liver, treatment with I106 by iv infusion increased levels of P-Akt ≈4.6-fold relative to vehicle (P < .0001), and treatment by ii injection increased P-Akt levels ≈16% relative to treatment by iv infusion (P = .0341) (Figure 2C and Table 3). In the jejunum, treatment with I106 by iv infusion and by ii injection increased activation of Akt ≈2-fold relative to vehicle (P < .0001; Figure 2D). The levels of P-Akt at the injection place in jejunum were fully comparable between the two groups treated with I106, as the mean ratio of ii injection versus iv infusion equaled 1.07 and was not significantly different from 1.0 (Table 3).
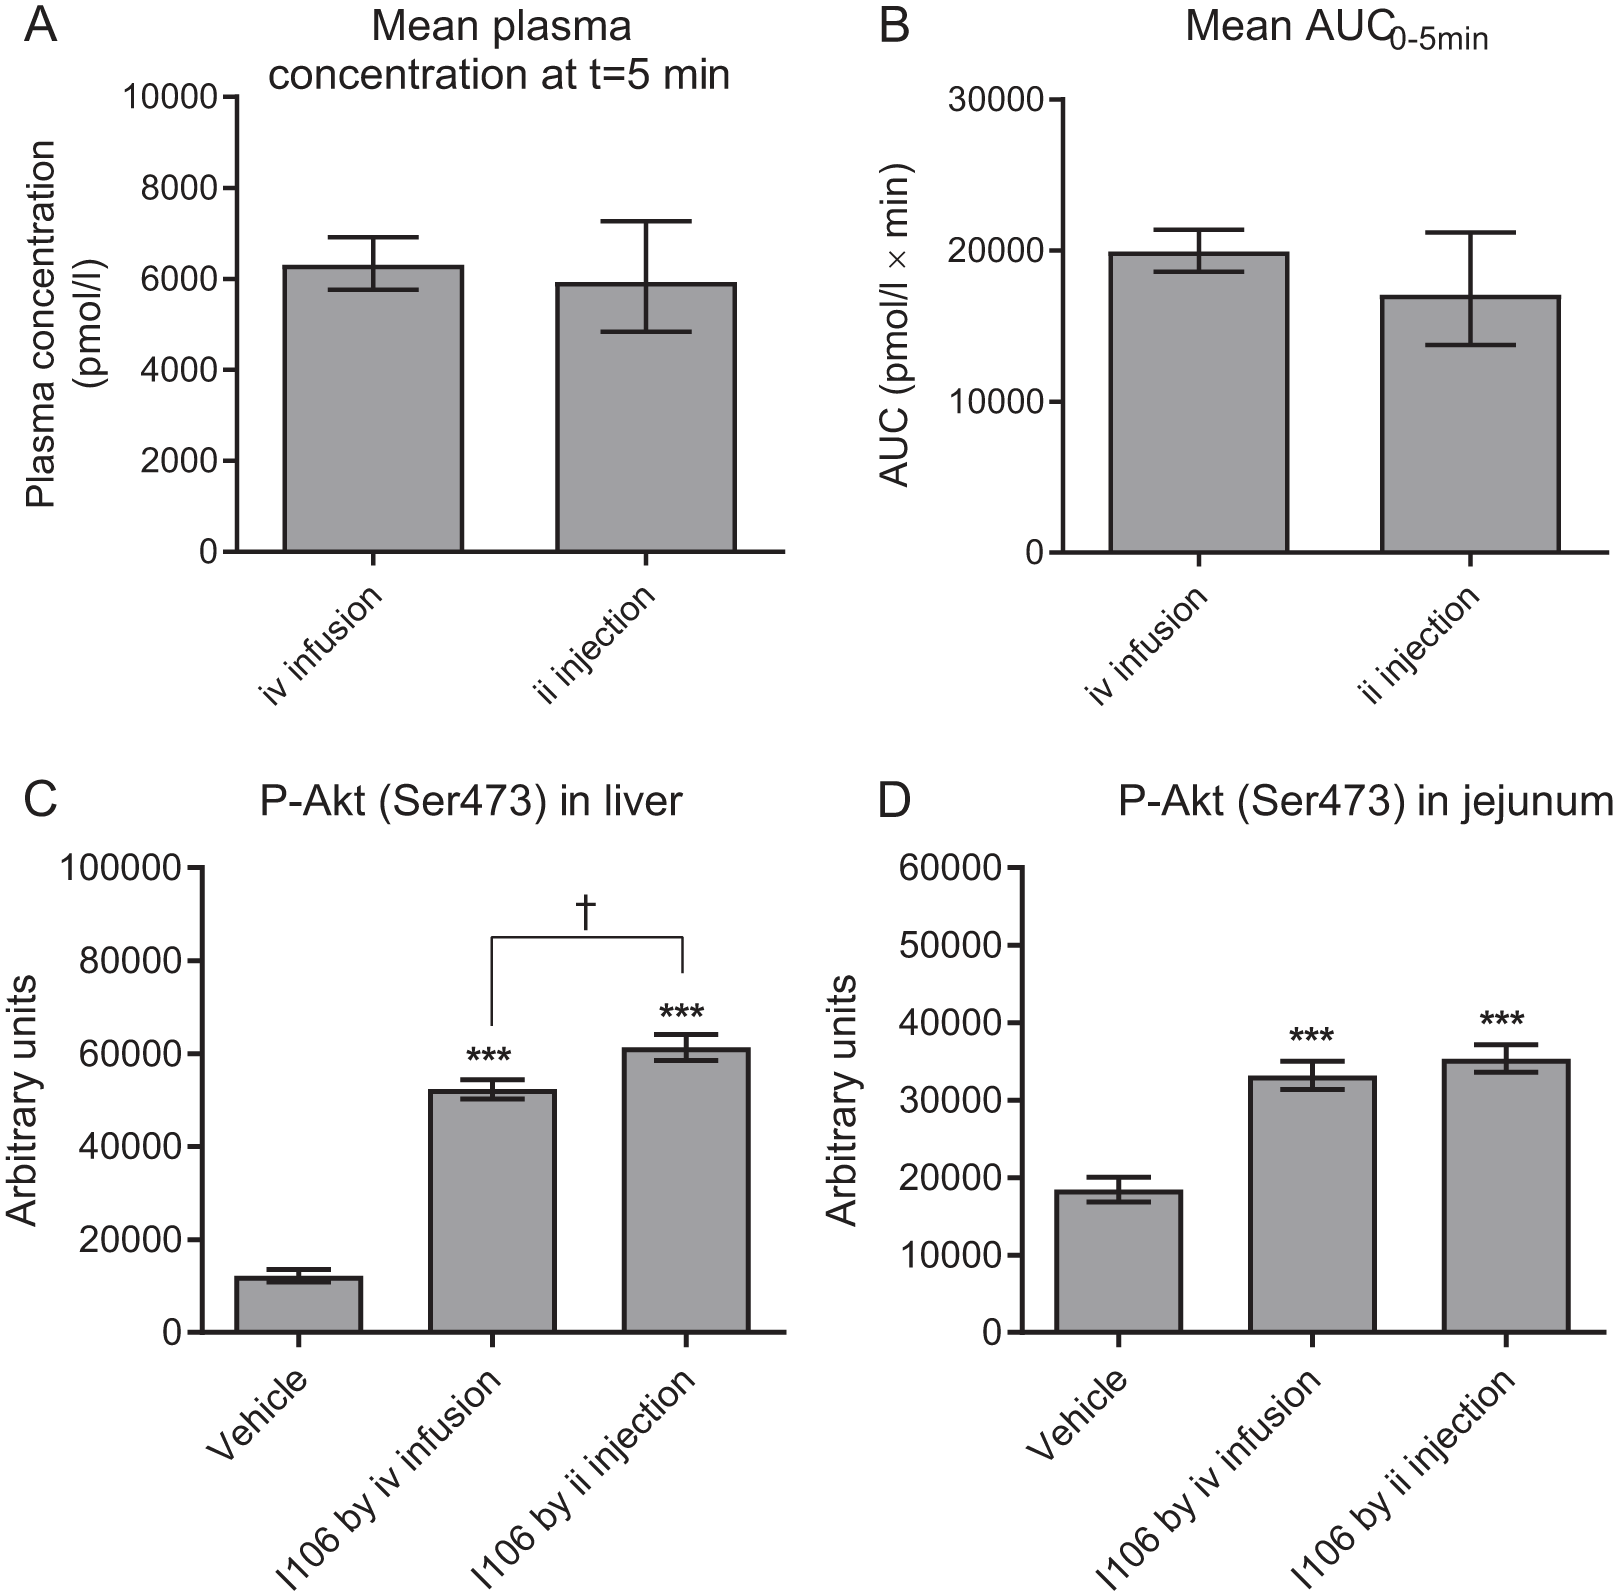
Plasma exposure of I106 and activation of Akt (Ser473) in liver and jejunum. (A) Plasma concentration of I106 immediately before euthanasia and collection of tissue samples. (B) AUC 0-5 min after treatment. (C) P-Akt (Ser473) levels in the liver. (D) P-Akt (Ser473) levels in jejunum at the injection place. In A and B bars indicate mean values and error bars the 95% CI. In C and D bars indicate the mean value and error bars the SEM. * and *** indicate P < .05 and .0001, respectively, relative to the vehicle-treated group. † indicate P < .05.
Mean Ratios for P-Akt in Liver and Jejunum in Experiment C.
Phosphorylated Akt Is Present in Intestinal Epithelial Cells
P-Akt was detected inside intestinal epithelial cells from vehicle- as well as I106-treated rats (Figure 3). The staining intensity was significantly increased in I106-treated rats compared to vehicle-treated rats, and no difference in staining distribution or intensity was observed between rats treated with I106 by ii injection or iv infusion (Figure 3).
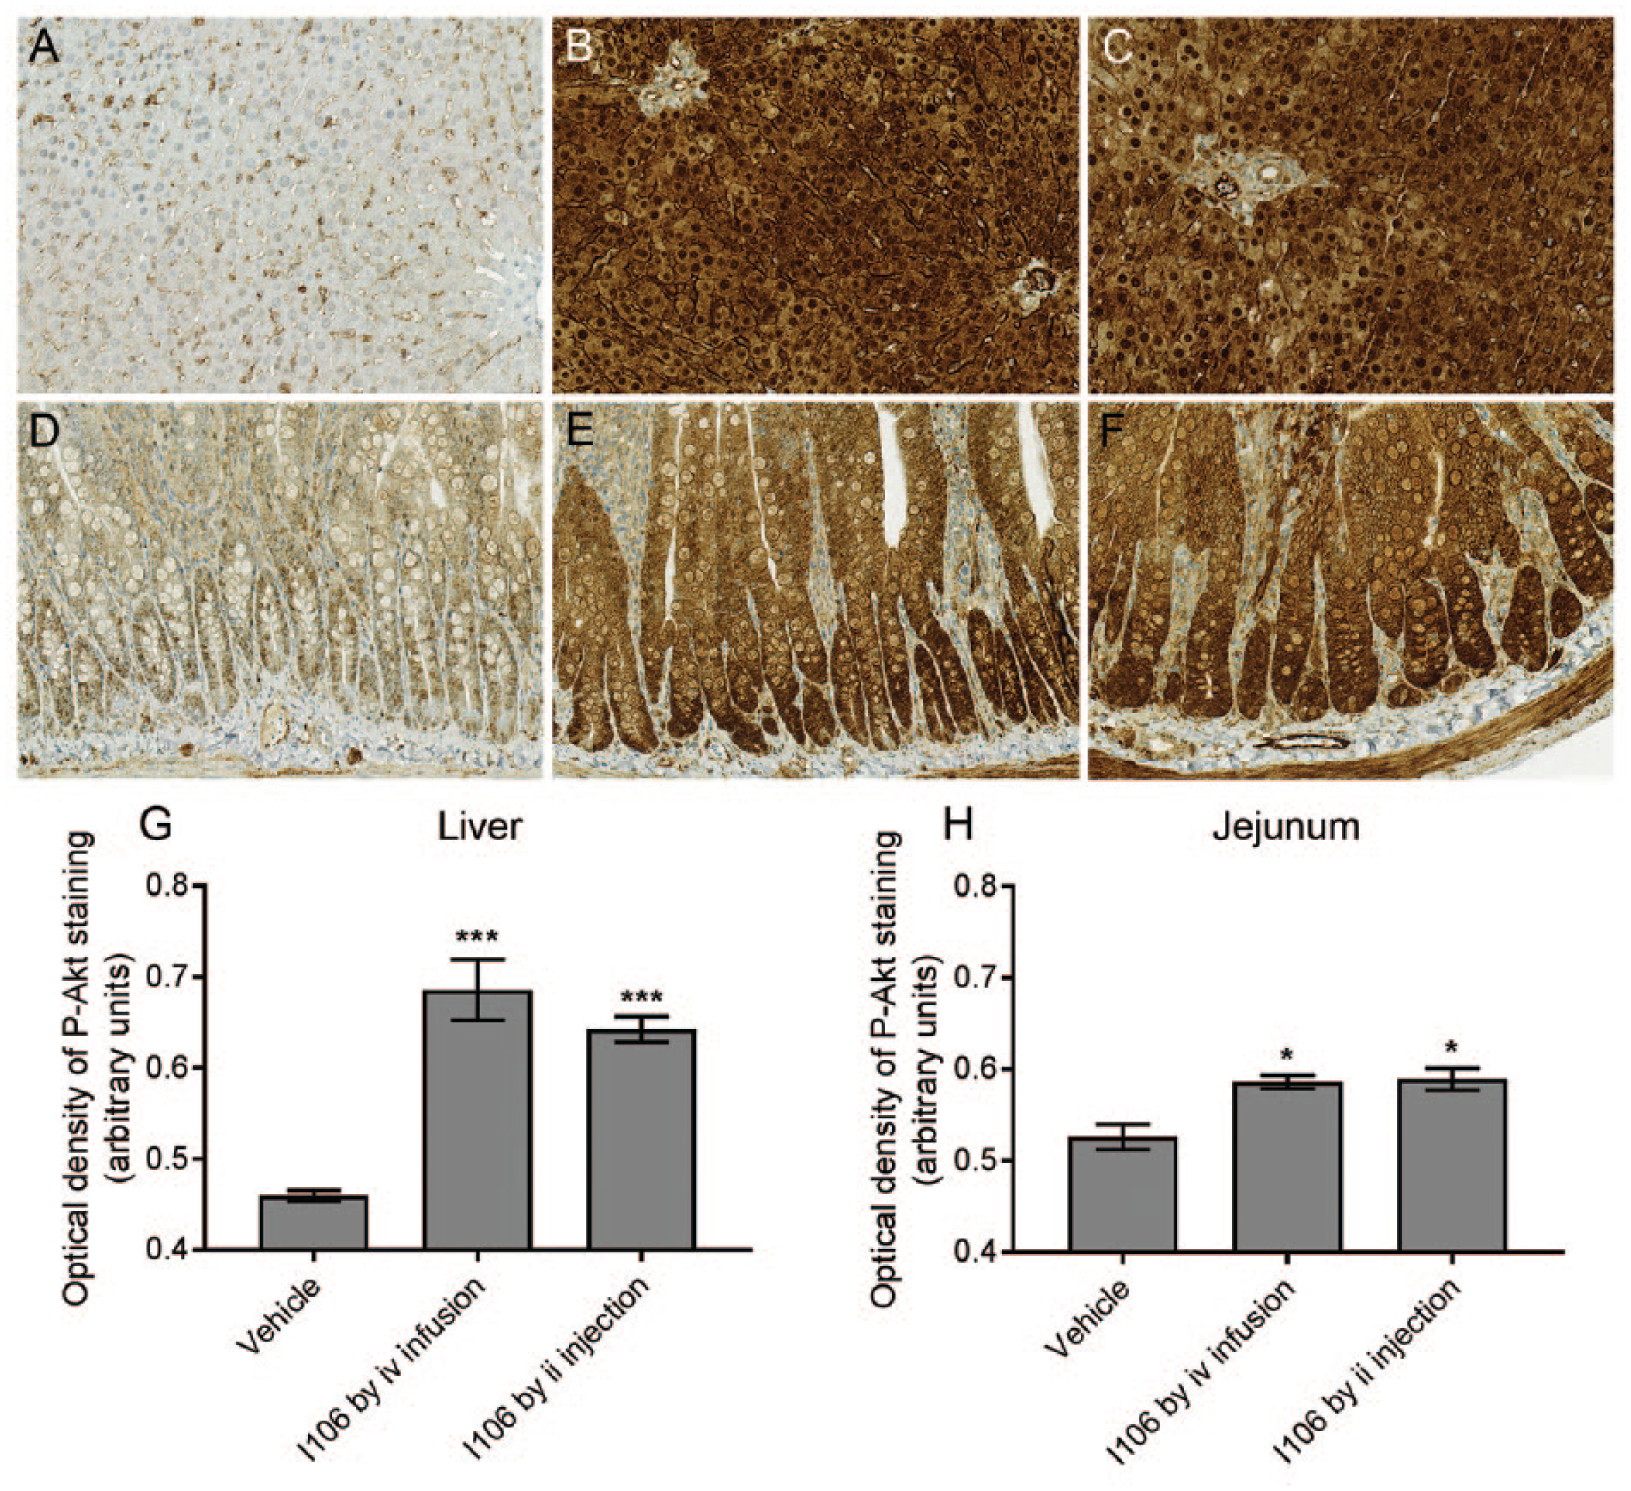
Representative pictures of P-Akt (Ser473) detected by IHC in sections from liver (A-C) and jejunum (D-E) and quantification of the optical density of P-Akt staining in liver (G) and jejunum (H). (A and D): A vehicle-treated rat. (B and E): A rat treated with I106 by iv infusion. (C and F): A rat treated with I106 by ii injection. In G and H bars indicate mean values and error bars the SEM. * and *** indicate P < .05 and .0001, respectively, relative to the vehicle-treated group.
Discussion
In this animal model of orally administered insulin, we found that treatment with I106 by ii injection resulted in similar activation of Akt at the injection site in the intestine as treatment with I106 by a parenteral route. We compared the effects of ii injection of I106 to iv infusion of the same insulin analogue, in doses which lowered blood glucose to the same extent. Normoglycemic rats have a limited window for lowering of blood glucose, but the chosen dose was on the linear part of the dose-response curve for blood glucose lowering. This experimental approach is therefore expected to resemble how oral and parenteral administration of insulin would have been compared in a clinical setting. Furthermore, it was ensured that plasma concentration of I106 was matched between the groups treated by ii injection or iv infusion. It can therefore be excluded that differences between the two administration routes were caused simply by differences in plasma concentration.
The bioavailability of I106 injected ii in doses of 40 nmol/kg was ≈5% when formulated with caprate (calculations are described in Supplementary Information), that is, the major part of the administered I106 was not absorbed from the intestinal lumen. It can appear surprising that the several fold higher dose of I106 administered ii does not result in more activation of Akt in the intestinal tissue. This finding indicates that only I106 circulating in the bloodstream can activate insulin- and IGF-1 receptors in the small intestine. One possible explanation for this could be that insulin- and IGF-1 receptors are not expressed on the apical side of the intestinal epithelial cells. Furthermore, unabsorbed I106 will likely undergo degradation by proteases secreted from pancreas and brush-border peptidases. 12 Detailed assessment of the fate of unabsorbed I106 was beyond the scope of this study, but will be relevant to explore in future studies, especially after repeated oral dosing.
Approximately 50-80% of the insulin secreted from the pancreas undergoes hepatic first-pass extraction before it reaches the system circulation.13,14 Some hepatic first-pass extraction of ii injected I106 must also be anticipated in this experimental setup, and during the very early absorption-phase portal plasma concentration of I106 was likely higher in the rats treated by ii injection. In agreement with this, more activation of Akt was observed in the liver from rats treated with I106 by ii injection. However, the portal vein does not supply the intestinal tissue with blood, so higher portal concentration of I106 after ii injection does not complicate interpretation of our results.
Besides the well-known effects on metabolism, insulin can also act as a growth factor in vitro. Previously concerns have been raised regarding the potential growth-promoting effects on existing neoplasms in the intestine by the large amounts of insulin in the intestinal lumen after oral administration.1,3 While cancer in the small intestine is very rare, 15 colorectal cancer is relatively common, and colon cancer occurs with higher incidence among people who also have diabetes.16-19 A potential concern could also be raised for growth-promotion of normal intestinal epithelial cells which express insulin and IGF-1 receptors. The turnover time for human intestinal epithelial cells is ≈3.5 days, 20 which means a given cell would only be exposed to unabsorbed insulin for a relatively short time, but in a previous rat study constant iv infusion of high amounts of insulin for 10 hours was enough to increase proliferation of colonic epithelial. 21 This study is a first step toward clarification of these concerns. While activation of Akt downstream of insulin- and IGF-1 receptors does not necessarily results in increased cellular proliferation, insulin must activate insulin- and/or IGF-1 receptors on a cell in order to have a direct mitogenic effect, and we demonstrate here that the acute effect of I106 injected in the jejunum does not differ from the effect of I106 circulating in the bloodstream. Possible effects of orally administered insulin on epithelial proliferation must be examined in future studies.
The physiological role of insulin in the intestine is not entirely clear.5,8,22-27 Interestingly, previous studies reported that food intake as well as mass and length of the intestine are increased in diabetic rats, and that treatment with insulin could normalize their food intake and intestinal size.28,29 This suggests that the mechanisms underlying an increase in food intake also result in stimulation of proliferation, and that an indirect effect of insulin-treatment in diabetic rats actually is less intestinal proliferation.
Conclusion
The acute effect of ii injection of an insulin analogue on activation of intracellular signaling in the intestine was fully comparable to the effect of PK/PD-matched parenteral administration of the same insulin analogue. Our finding in this rat model of orally administered insulin therefore indicates that orally administered insulin will not cause an enhanced acute effect in the intestine.
Supplemental Material
Supplementary_Information – Supplemental material for Intraintestinal and Parenteral Administration of an Insulin Analogue Leads to Comparable Activation of Signaling Downstream of the Insulin Receptor in the Small Intestine
Supplemental material, Supplementary_Information for Intraintestinal and Parenteral Administration of an Insulin Analogue Leads to Comparable Activation of Signaling Downstream of the Insulin Receptor in the Small Intestine by Henning Hvid, Jonas Kildegaard, Kim Kristensen, Trine Porsgaard, Mikkel S. Jørgensen, Borja Ballarín-González, Jonas Ahnfelt-Rønne, Bo F. Hansen and Erica Nishimura in Journal of Diabetes Science and Technology
Supplemental Material
Supplementary_Table_2 – Supplemental material for Intraintestinal and Parenteral Administration of an Insulin Analogue Leads to Comparable Activation of Signaling Downstream of the Insulin Receptor in the Small Intestine
Supplemental material, Supplementary_Table_2 for Intraintestinal and Parenteral Administration of an Insulin Analogue Leads to Comparable Activation of Signaling Downstream of the Insulin Receptor in the Small Intestine by Henning Hvid, Jonas Kildegaard, Kim Kristensen, Trine Porsgaard, Mikkel S. Jørgensen, Borja Ballarín-González, Jonas Ahnfelt-Rønne, Bo F. Hansen and Erica Nishimura in Journal of Diabetes Science and Technology
Footnotes
Acknowledgements
We wish to thank Anne Bowmann and Kristina Tornqvist for excellent technical assistance with the animal experiments. We furthermore wish to thank Susanne Dam Høiberg for preparation of tissue sections and IHC staining for P-Akt. Finally, we wish to thank Betina Bonnichsen and Anette Kirstine Lauridsen for analysis of tissue samples by Western blotting or AlphaScreen SureFire Akt Assay.
Abbreviations
AU-BG, band intensity with background subtracted; AUC, area under the curve; AUC0-inf, area under the curve extrapolated from time 0 until infinity; Cmax, maximum plasma concentration; EDTA, ethylene-diamine-tetraacetic acid; ELISA, enzyme-linked immunosorbent assay; GIPET, Gastrointestinal Permeation Enhancement Technology; I106, insulin analogue 106; IGF-1, insulin-like growth factor 1; IHC, immunohistochemistry; ii, intraintestinal; iv, intravenous; P-Akt, phosphorylated Akt; PD, pharmacodynamics; PK, pharmacokinetic; sc, subcutaneous; Ser, serine; tmax, time for maximum plasma concentration.
Declaration of Conflicting Interests
The author(s) declared the following potential conflicts of interest with respect to the research, authorship, and/or publication of this article: All authors have been or are at present employed by Novo Nordisk A/S and hold shares in the company. HH, TP, and BBG are presently employed by Gubra Aps.
Funding
The author(s) disclosed receipt of the following financial support for the research, authorship, and/or publication of this article: This work was funded entirely by Novo Nordisk A/S.
Supplemental Material
Supplemental material for this article is available online.
References
Supplementary Material
Please find the following supplemental material available below.
For Open Access articles published under a Creative Commons License, all supplemental material carries the same license as the article it is associated with.
For non-Open Access articles published, all supplemental material carries a non-exclusive license, and permission requests for re-use of supplemental material or any part of supplemental material shall be sent directly to the copyright owner as specified in the copyright notice associated with the article.