
Abstract
Glucose meter evaluations are common in publications and inform whether the meter meets the ISO 15197 specification. The ISO 15197 specifications, which are universally cited, leave 1% of results unspecified, which can be thought of as typical performance of results (99%) versus rare performance (1%). Suggestions are provided to extract more information from these evaluations, including rare performance, since highly discrepant results or failure to obtain a result can be observed in a glucose meter that has met the ISO 15197 specification. It is also recommended that when manufacturers perform evaluations, they analyze adverse events contained in the FDA MAUDE database. Finally, we point out an important problem with the ISO 15197 specifications.
A typical glucose meter evaluation is an experiment to determine whether the ISO 15197 specification 1 has been met. This specification provides limits for 99% of the results, leaving 1% of the results unspecified. This split can be viewed as typical performance (specified for 99% of the data) and rare performance (for the unspecified 1%). Note that in typical glucose meter evaluations, the ISO 15197 specification usually evaluated is system accuracy (6.3.3), which is performed by health care professionals. In the ISO standard protocol, although outlier results are required to be identified in plots, as long as their frequency is less than 1%, outliers would not cause a meter to fail the specification. A separate user accuracy evaluation (8.2) is rarely mentioned in published evaluations and has less stringent requirements.
To determine typical performance for a glucose meter is valuable. If a glucose meter meets the ISO 15197 specification, then one has confidence that most of the time results will be acceptable.
But clearly, one would also like to understand the performance from potential rare error sources. For self-monitoring of blood glucose (SMBG), a user will typically test him or herself around 1000 times a year so 1% of these results equates to about one result each month. For this unspecified 1%, there are several possible outcomes. Typical performance (corresponding to the other 99% of results) is one possible outcome. Potentially harmful results could also be observed such as a) values that are in the C and especially D and E zones of a glucose meter error grid, or b) failure to obtain a result. Events a and b are called adverse events by the FDA and do occur for glucose meters. The purpose of this article is to try to extract more information from glucose meter evaluations including information about adverse events. Note that other means of assessing the possibility of rare events such as interference studies are described in the ISO standard. This article focuses on evaluations that sample and test patients.
Results
In a typical glucose meter evaluation, samples are run on both a glucose meter and comparison method, and the results are compared to the ISO 15197 specification. Often, one sees a table 2 to show what percentage of results meets the 15 mg/dL or 15% limit as well as showing the percentages that are within 10 mg/dL or 10% and 5 mg/dL or 5%. An improvement would be to also provide this information in a graph. To illustrate this using simulated data, a mountain plot 3 is shown for three glucose meters for the percentage differences from the comparison method (glucose range 100-500 mg/dL). (A separate graph would be plotted for absolute differences.) In Figure 1, all glucose meters meet the ISO 15197 specification but differences among meters are more readily visualized in a graph than in a table. Thus, the meter with square markers has 95% of its values between −5% and 6%, whereas the meter with diamond markers has 95% of its values between −12% and 12%. Note also that it is easy to see when the percentages are not symmetrical about zero, as the meter with circle markers shows, which has a positive bias and 95% of its values between −3% and 8%.
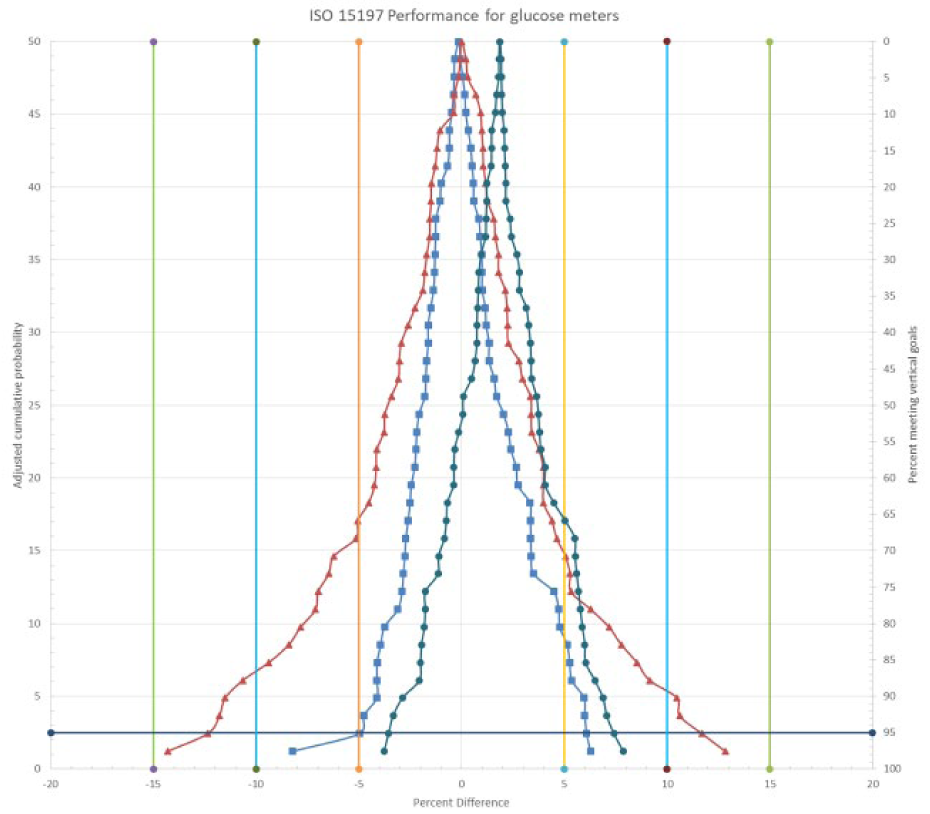
Mountain plot of three glucose assays. The left vertical axis is the cumulative probability for the percentage differences (x axis). The right vertical axis allows one to read the percentage of values containing differences. For example, for the meter with square points, 80% of the differences are contained within −4% to 5%.
A mountain plot can be prepared as follows (example is for differences; percentage differences can also be used):
Sort the differences from the comparison method from low to high.
Rank the differences: lowest difference = rank 1, next lowest difference = rank 2, and so on.
Compute the percentile for each difference = rank × 100 / (N + 1), where N = the number of differences
If the percentile is >50, then the percentile = 100 – percentile
Plot percentile (y) vs difference (x).
Often, in glucose meter evaluations, no tests are replicated. Assume a single result was 100 mg/dL on the glucose meter but 135 mg/dL on the comparison instrument. If the meter met the ISO goals, then it would be easy to ignore this discrepant result. Yet it is important to determine if this result is due to a random error, or due to an interference and likely reproducible. If the difference is reproducible, then this is a dangerous finding since diabetes complications are possible for persistent elevated results. 4 This question could be addressed by analyzing the data as soon as it is available and repeating any results beyond predesignated limits. If one is following the system accuracy protocol (6.3.4), duplicates are determined for each patient. Hence, it would be easier to determine if differences from the comparison method occurred randomly or were reproducible.
As for evaluating rare events (eg, the 1% not specified in the ISO guidelines), weak evidence can be found in a typical glucose meter evaluation, if for instance a) no results are in higher zones of a glucose meter error grid (C, D or E) and b) no meters fail to generate a result. The evidence is weak because the percentage of possible adverse events, even when none have been found, is still relatively high for a sample size of 100 as shown in Table 1. 5
Confidence Interval Versus Sample Size When No Adverse Events Have Been Found.
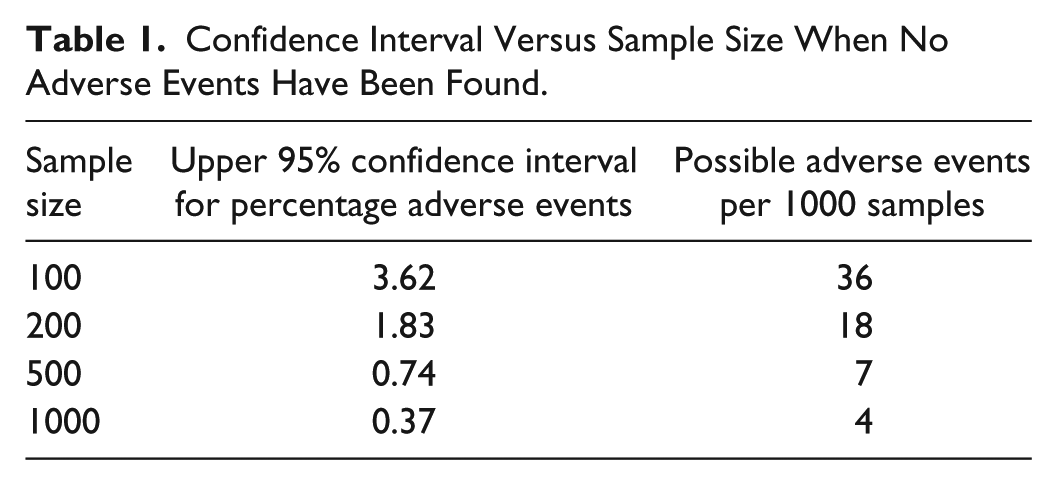
As an example, if 100 samples were run and no adverse events were found, the 95% confidence interval suggests that in the entire population, there could be no more than 3.62% adverse events. Thus, in 1000 samples (a typical annual usage), there would be no more than 36 adverse events.
Unfortunately, meters that fail to provide a result are often discarded and mentioned only in passing if at all. 6 Although meter failures cannot contribute to difference statistics, there is reason to record this information, as failure to obtain a result is an adverse event. In the ISO standard, the system accuracy protocol is carried out by trained health care professionals. A separate protocol is performed with lay users. But as Table 2 shows the acceptance criteria differ for the two protocols. A recent article showed that the failure to obtain a valid result due to user error occurred almost 1% of the time with the intended user population. 7
Different Acceptance Criteria for Accuracy Protocols.
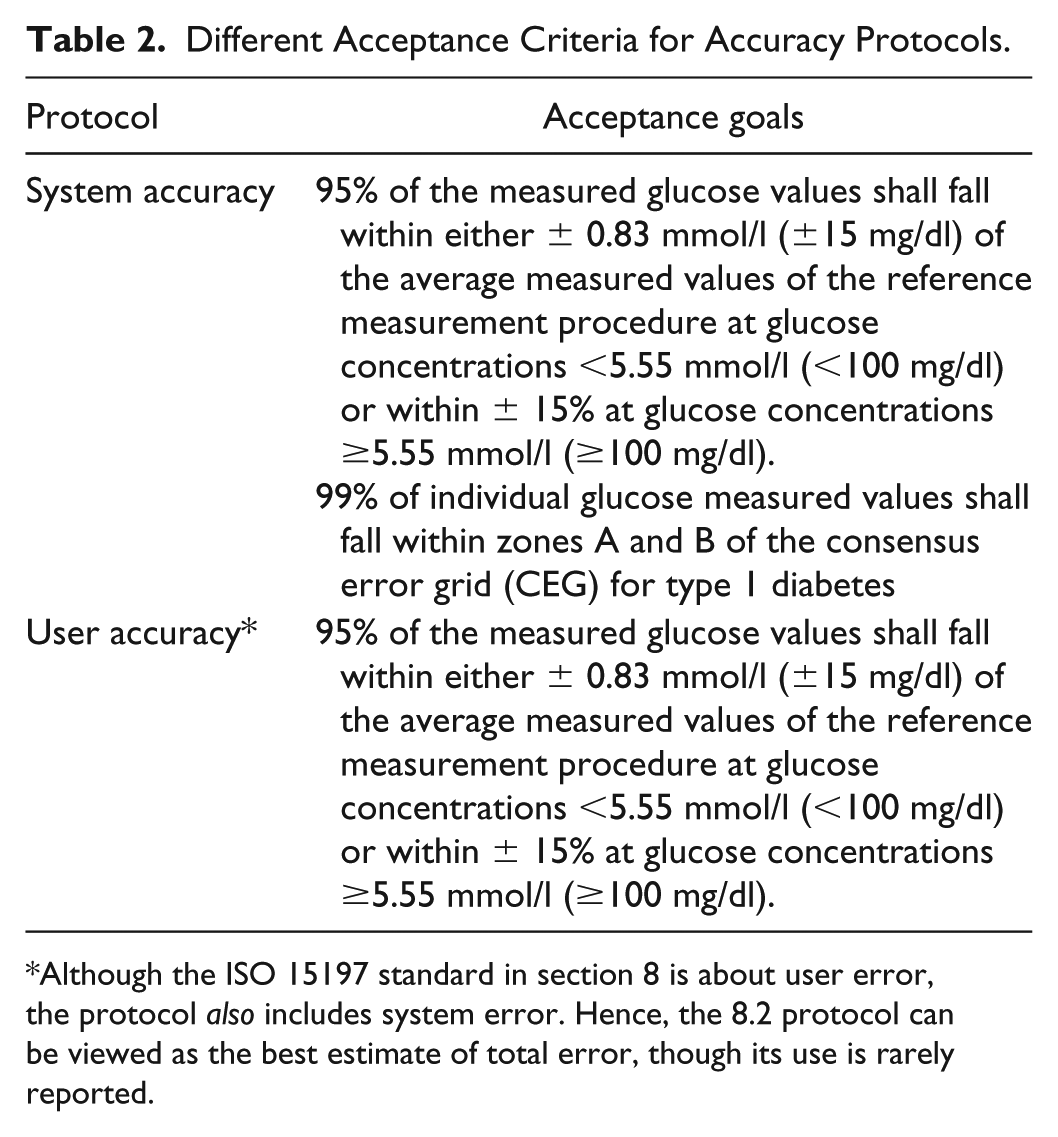
Although the ISO 15197 standard in section 8 is about user error, the protocol also includes system error. Hence, the 8.2 protocol can be viewed as the best estimate of total error, though its use is rarely reported.
After release for sale of a glucose meter, one can view routine testing by SMBG users as an evaluation with a huge sample size, albeit without a protocol. If an adverse event occurs, a portion of the users submit reports which eventually wind up in the FDA adverse event database called MAUDE. 8 Although this database is publicly available, there are two problems in analyzing the data as an evaluator: (1) the events are most meaningful to the meter manufacturer; and (2) to obtain adverse event rates, one must know the number of tests performed. Manufacturers are in a position to provide rates of adverse events by analyzing the MAUDE database.
Discussion
It makes little sense for the ISO 15197 specification to leave 1% of results unspecified. A possible reason that has been given is that one can never prove that no adverse events will occur and it is likely that most meters would fail a specification of no adverse events. Also, it would be problematic to specify an “acceptable” rate of adverse events. But glucose meters even with adverse events are more useful to patients than no glucose meters at all. A perhaps subtle but important consequence of the ISO specification ignoring 1% of the results is that evaluators (and manufacturers) may pay less attention to looking for adverse events, since these rare events, while potentially harmful, are not likely to cause the meter to fail the ISO standard. One would like to know how different glucose meters compare not just for typical performance but also for the rate of adverse events. Hence consideration of all evaluation results, including meter failures, would improve evaluations, better inform consumers, and potentially lead eventually to improved meter performance.
Conclusion
A simple graphical method is proposed to illustrate method comparison data, especially useful for comparing different meters. Adding mountain plots to these evaluations can enhance their value to the reader.
By analyzing data as soon as they are available, one could repeat discrepant samples to determine whether the discrepancy is random or repeatable. Random discrepancies reflect the precision of the method and widen the mountain plot. Repeatable discrepancies demonstrate bias and can lead to diabetes complications.
Reporting the adverse event rate, which includes the failure to produce a result and values in the C or higher zones of an error grid, provides information about the unspecified 1%.
It makes no sense to have separate protocols for system accuracy and user accuracy. The system accuracy limits, which are widely cited as the ISO 15197 limits, are actually a subset of the total error since user error is excluded. On the other hand, the user protocol, by virtue of the fact that the system is being run with actual users, is the best estimate of total error since it includes system error and user error. Also noteworthy is that the acceptance goals for the user evaluation do not include the requirement for 99% of the results to be in the A or B zones of an error grid.
Finally, manufacturers have information to provide rates of adverse events by analyzing the MAUDE database.
Footnotes
Abbreviations
CEG, consensus error grid; MAUDE, Manufacturer and User Facility Device Experience; SMBG, self-monitoring of blood glucose.
Declaration of Conflicting Interests
The author(s) declared no potential conflicts of interest with respect to the research, authorship, and/or publication of this article.
Funding
The author(s) received no financial support for the research, authorship, and/or publication of this article.