
Abstract
Background:
Described is a manufacturer’s systematic post-market evaluation of the long-term clinical accuracy of a commercially available blood glucose monitoring (BGM) test strip product.
Methods:
Production batches of test strips were routinely and regularly sampled and evaluated in a clinical setting to assess product accuracy. Evaluations were performed on capillary blood samples from a minimum of 100 subjects with diabetes, by clinical staff according to instructions for use. Readings were compared against capillary blood samples collected at the same time and measured by a standard laboratory reference method. Clinical accuracy was calculated according to EN ISO 15197:2015.
Results:
A total of 21 115 paired results were obtained, equating to 209 production batches over the >3-year period since test strip launch. Of the results, 97.6% met the accuracy criterion (range: 97.1-98.1% by year), with 98.1% of values presenting zero risk as defined by the surveillance error grid. At the <5th (21.0-33.8%) and >95th (48.3-59.4%) percentile extremes of hematocrit distribution, 97.9% and 96.4% of values were clinically accurate. The product also demonstrated clinical accuracy across all seven glucose ranges (“bins”) as defined by the standard. Under conditions of combined hematocrit and glucose (<80 mg/dL and ≥300 mg/dL) extremes, 97.7% of values were clinically accurate.
Conclusions:
Methodologies and results from a manufacturer’s self-imposed clinical accuracy surveillance program of a BGM product is presented. Given the publication of sometimes-conflicting data presented within ad hoc BGM clinical accuracy evaluations, usually of limited size, it is advocated that BGM manufacturers adopt similarly robust and systematic surveillance programs to safeguard patients.
Many systems have been developed by different manufacturers for self-monitoring of blood glucose (SMBG). Strict performance guidelines have been developed by regulatory bodies to ensure that commercially available SMBG systems are both safe and clinically accurate as well as defining appropriate product specifications, such as hematocrit (Hct) and glucose operating ranges.1,2 However, as observed by the Diabetes Technology Society (DTS), certain cleared blood glucose monitoring (BGM) systems, when tested post-market, did not continue to meet their regulatory performance requirements. 3 However, the DTS study was itself a snapshot of each product’s performance within a narrowly defined period (average of 310 values) and therefore does not provide a robust picture of product performance over time in terms of systematic post-market surveillance. To our knowledge, the systematic post-market performance of only one other strip product has been reported in the peer-reviewed scientific literature (671 individual strip batches; >80 000 values; >7-year timeframe; assessment based on EN ISO 15197: 2015 clinical accuracy requirements).4,5
Reported here is a further substantial clinic dataset (21 115 values from 209 different strip batches) gathered over 3 years as part of a major SMBG manufacturer’s systematic post-market surveillance program to monitor the clinical performance of a widely commercially available SMBG product. This ongoing surveillance program identifies trends in clinical accuracy thus allowing corrective measures to be taken, to ensure that released product continues to meet clinical accuracy claims. In addition, the scale of the dataset facilitates a more in-depth analysis of product clinical performance, beyond the average 310 readings analyzed in the landmark DTS study, allowing additional product performance claims to be assessed within the clinic setting. Also, data are presented showing product clinical accuracy at extremes of the product claimed ranges for glucose and Hct.
Methods
Test Strips
Select Plus test strips are manufactured by LifeScan Inc (Wayne, PA, USA). An exploded view of the test strip is shown in Figure 1. A thick-film conductive carbon paste is screen-printed onto an inert polymer substrate in a 5-electrode pattern. Electrode dimensions are defined by an insulation screen-print that also serves to prevent solution contact with the underlying carbon tracks, with the distal end of the tracks exposed to facilitate electrical connection to a hand-held meter. An active chemistry, incorporating glucose-specific enzyme and mediator and other formulation/assay components is screen printed over the counter and 2 working electrodes. The walls and upper surface of the sample chamber are formed by lamination of a preassembled multilayered top-tape over the exposed electrode assembly. A 1 µl blood sample is drawn into the chamber by capillary action, interacting with the active chemistry allowing the electrochemical determination of glucose within an average 5 s test time. The 2 electrodes closest to the chamber entrance are bare (ie, non-chemistry coated) and measure sample impedance, providing a measure of Hct within the sample. All manufacturer’s BGMSs using this test strip product meet the ISO standard.
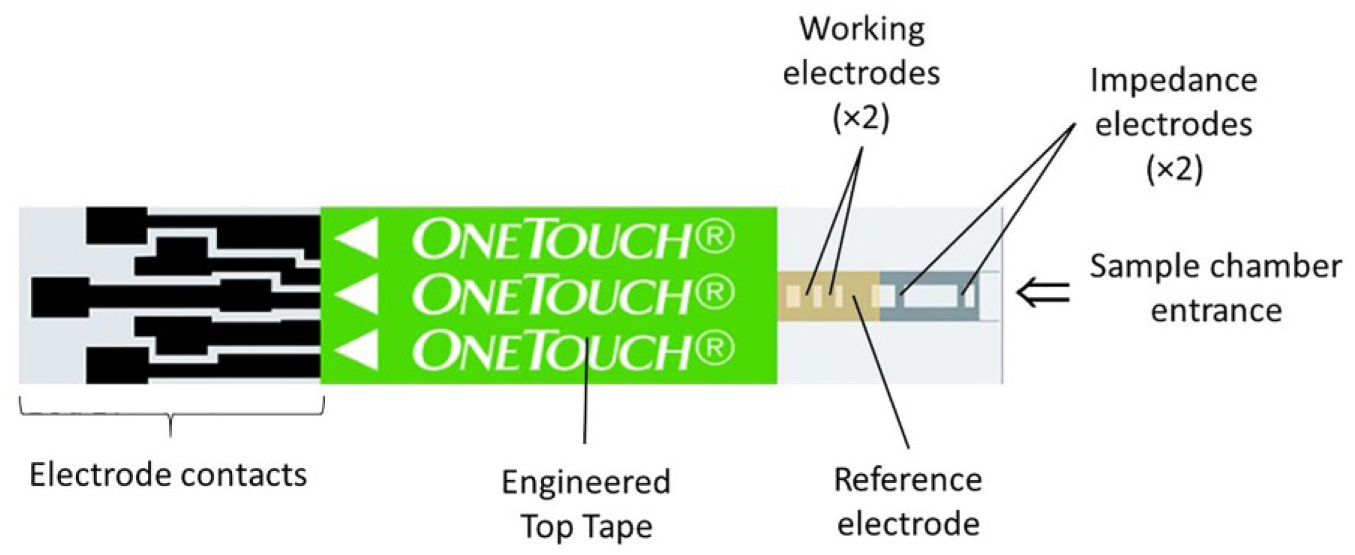
Screen-printed test strip design.
Clinic Testing
A minimum of one representative production batch was randomly selected per week and presented for clinical evaluation at one of 3 clinic sites over the 3-year post-launch period (March 2015-June 2018; average of 5 batches tested per month at clinic). Each batch (n = 209) was tested on a minimum of 100 subjects with diabetes, typically with several batches (average 5-6) assessed per study. Each clinic included the assessment of a test strip control batch, providing an ongoing assessment of a single batch over a greater number of subjects and extended test period. Data from the control batch of June 2016-November 2017 is reported (2628 paired-values; 25 clinics). Tests were performed on fresh capillary blood samples by clinic staff (employees of the UK National Health Service) according to product instructions for use, the same blood drop being used to fill a strip from each batch under assessment. The test strip claims a glucose range of 20-600 mg/dL. A small number of BG values exceeded 600 mg/dL but were included to assess product performance above the upper claim limit.
An additional capillary blood sample was collected within a heparinized capillary tube to allow Hct determination of each subject using a Hettich Hematocrit 210 capillary centrifuge. Values were reported as the proportion of total sample volume occupied by the packed cellular material. While the test strip product has a claimed 30-55% Hct range, subject inclusion criteria was wider, at 20-60%. Strip product age at time of testing ranged from 1 week to 18 months (mean 6 months; median 4 months) for representative production batches and 2-20 months for the control batch (mean 13 months; median 14 months). Because subjects could visit the clinical sites on multiple occasions during the study period and could test with multiple strip batches on each visit, the dataset is not entirely composed of unique donors.
Reference Instrument
Reference BG values were obtained from the plasma fraction of a separate 200 µl capillary blood sample, collected in a lithium heparin Microvette and centrifuged. Duplicate measurements were obtained from 2 separate YSI STAT PLUS™ blood glucose analyzers (2300 or 2900 models, Yellow Springs Instrument Co Inc, Yellow Springs, OH), with the mean of the values being used for clinical assessment. Instruments were calibrated on each day of use. A subject’s data were excluded if Hct was outside of the range 20-60% (test strip claimed Hct range is 30-55%); time limits were exceeded during testing (the blood sample for the reference measurement was not centrifuged within a given time, or was not tested within the given post-collection time limit); reference QC sample results were out of specification (verification that the reference instrument was operating correctly throughout the day). Data were excluded if reference probe to probe differences or machine to machine differences exceeded 4 (mg/dL or %).
Analysis
EN ISO 15197:2015 (ISO 15197) defines clinical accuracy in terms of bias: a minimum of 95% of all BGMS values must be within ±15 mg/dL of reference at blood glucose (BG) <100 mg/dL or ±15% at BG ≥100 mg/dL. Each test strip batch was assessed against the standard with individual test strip BG values compared against the mean of the duplicate YSI readings. Analyses were performed using SPSS Statistics v21 software (IBM Corp, Armonk, NY) with independent statistician verification.
Results
Overall Clinical Accuracy Performance
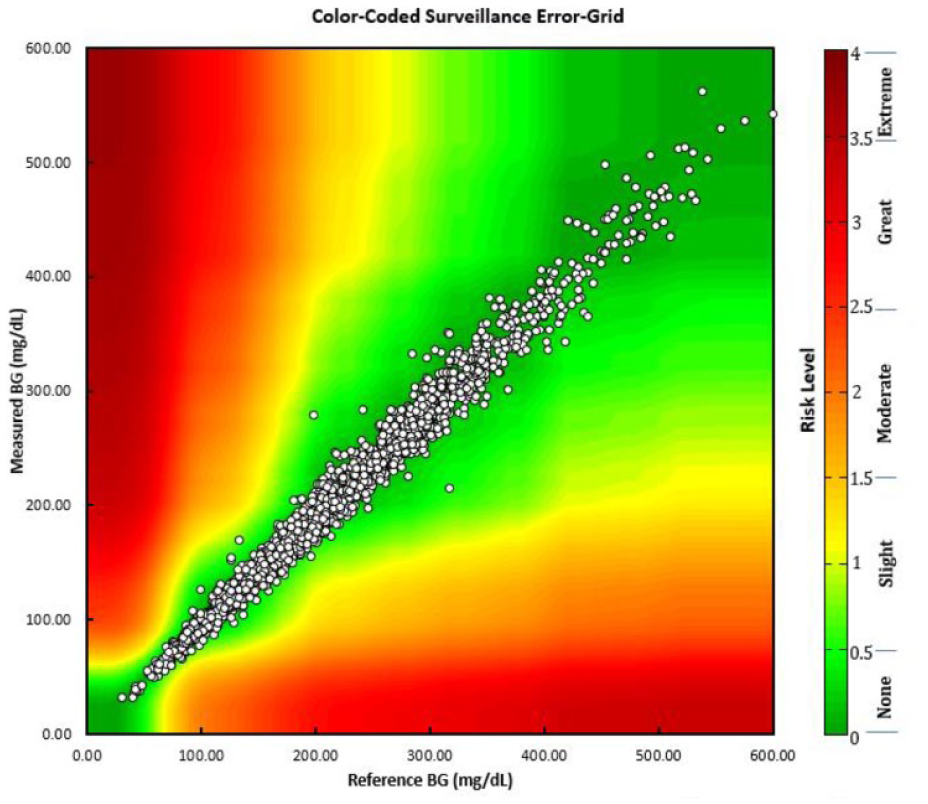
ISO 15197 clinical accuracy, overall and by year, is shown in Table 1. The BGM system consistently met the standard, with an average of 97.6% of results within specification, demonstrating both product accuracy and consistency over the 3-year surveillance period. Percentage within ISO specification, by year, ranged from 97.1% to 98.1%. A measure of clinical impact of blood glucose measurement accuracy may be visualized by comparing individual test strip values with corresponding reference values as per the surveillance error grid (SEG), shown in Table 1 and Figure 2a. The SEG has been developed to allow greater precision in quantifying risk and is useful in allowing regulators and manufacturers to monitor and evaluate glucose monitor performance in their surveillance programs.6,7 For the dataset reported here, 20 673 values (98.1%), 405 (1.9%), and 2 (0.009%) of values presented a risk level of <0.5 (none), 0.5-1.0 (slight [lower]), and 1.0-1.5 (slight [higher]), respectively.
Test Strip Clinical Accuracy by Year, Against the EN ISO 15197:2015 Specification and Percentage and Number of Values Within Risk Levels of the Surveillance Error Grid.
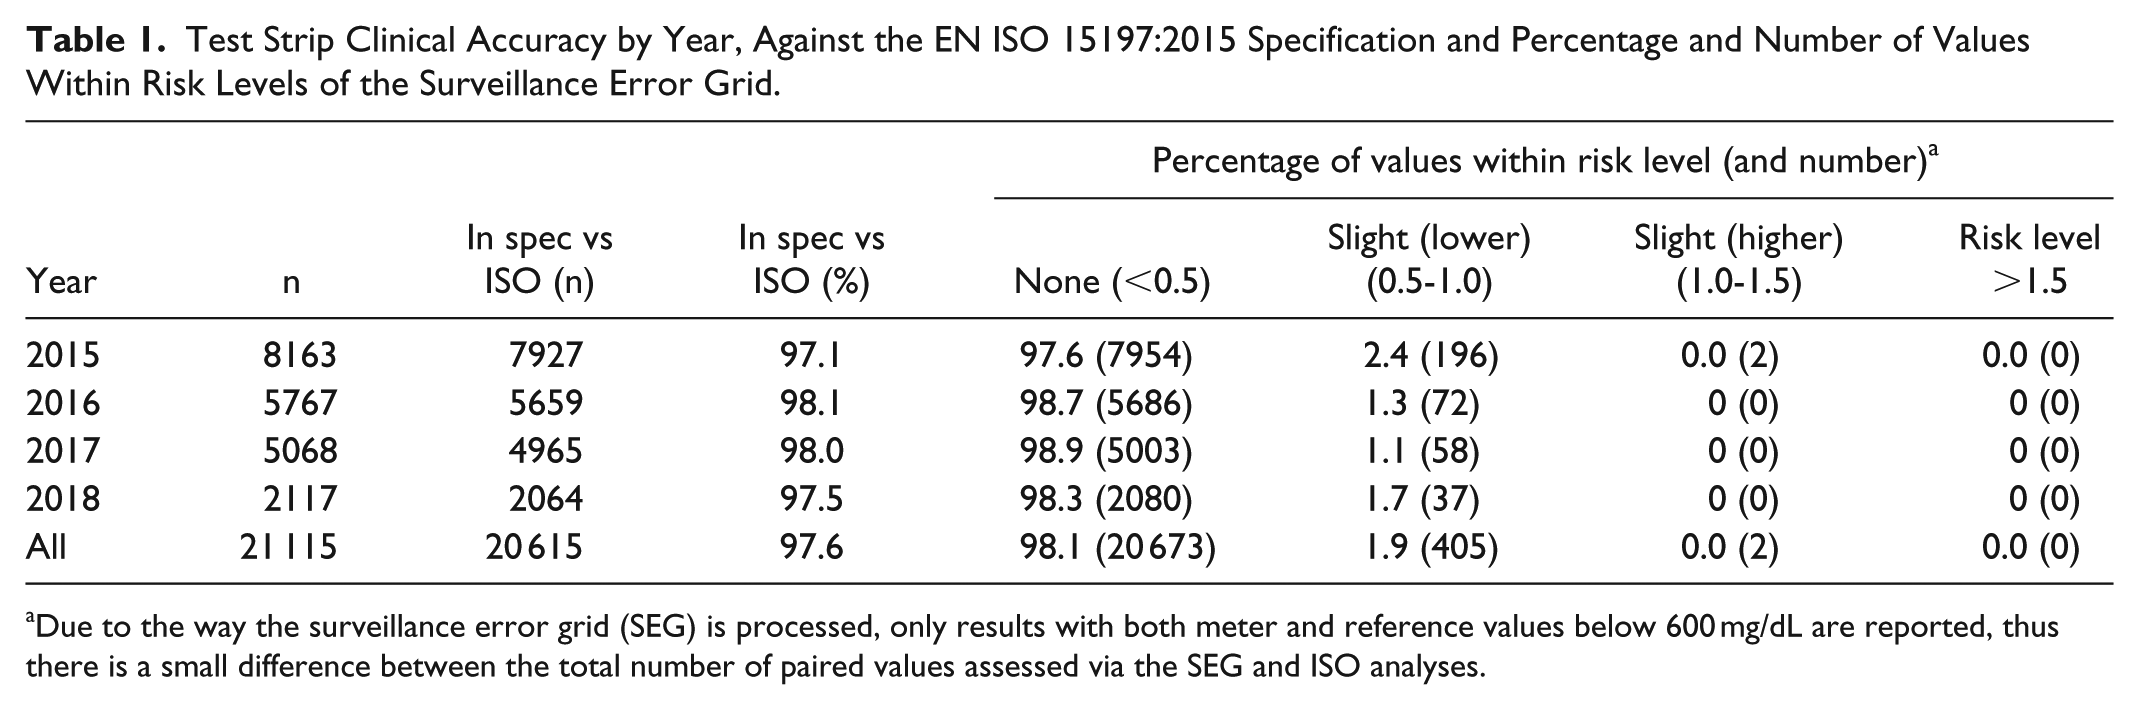
Due to the way the surveillance error grid (SEG) is processed, only results with both meter and reference values below 600 mg/dL are reported, thus there is a small difference between the total number of paired values assessed via the SEG and ISO analyses.
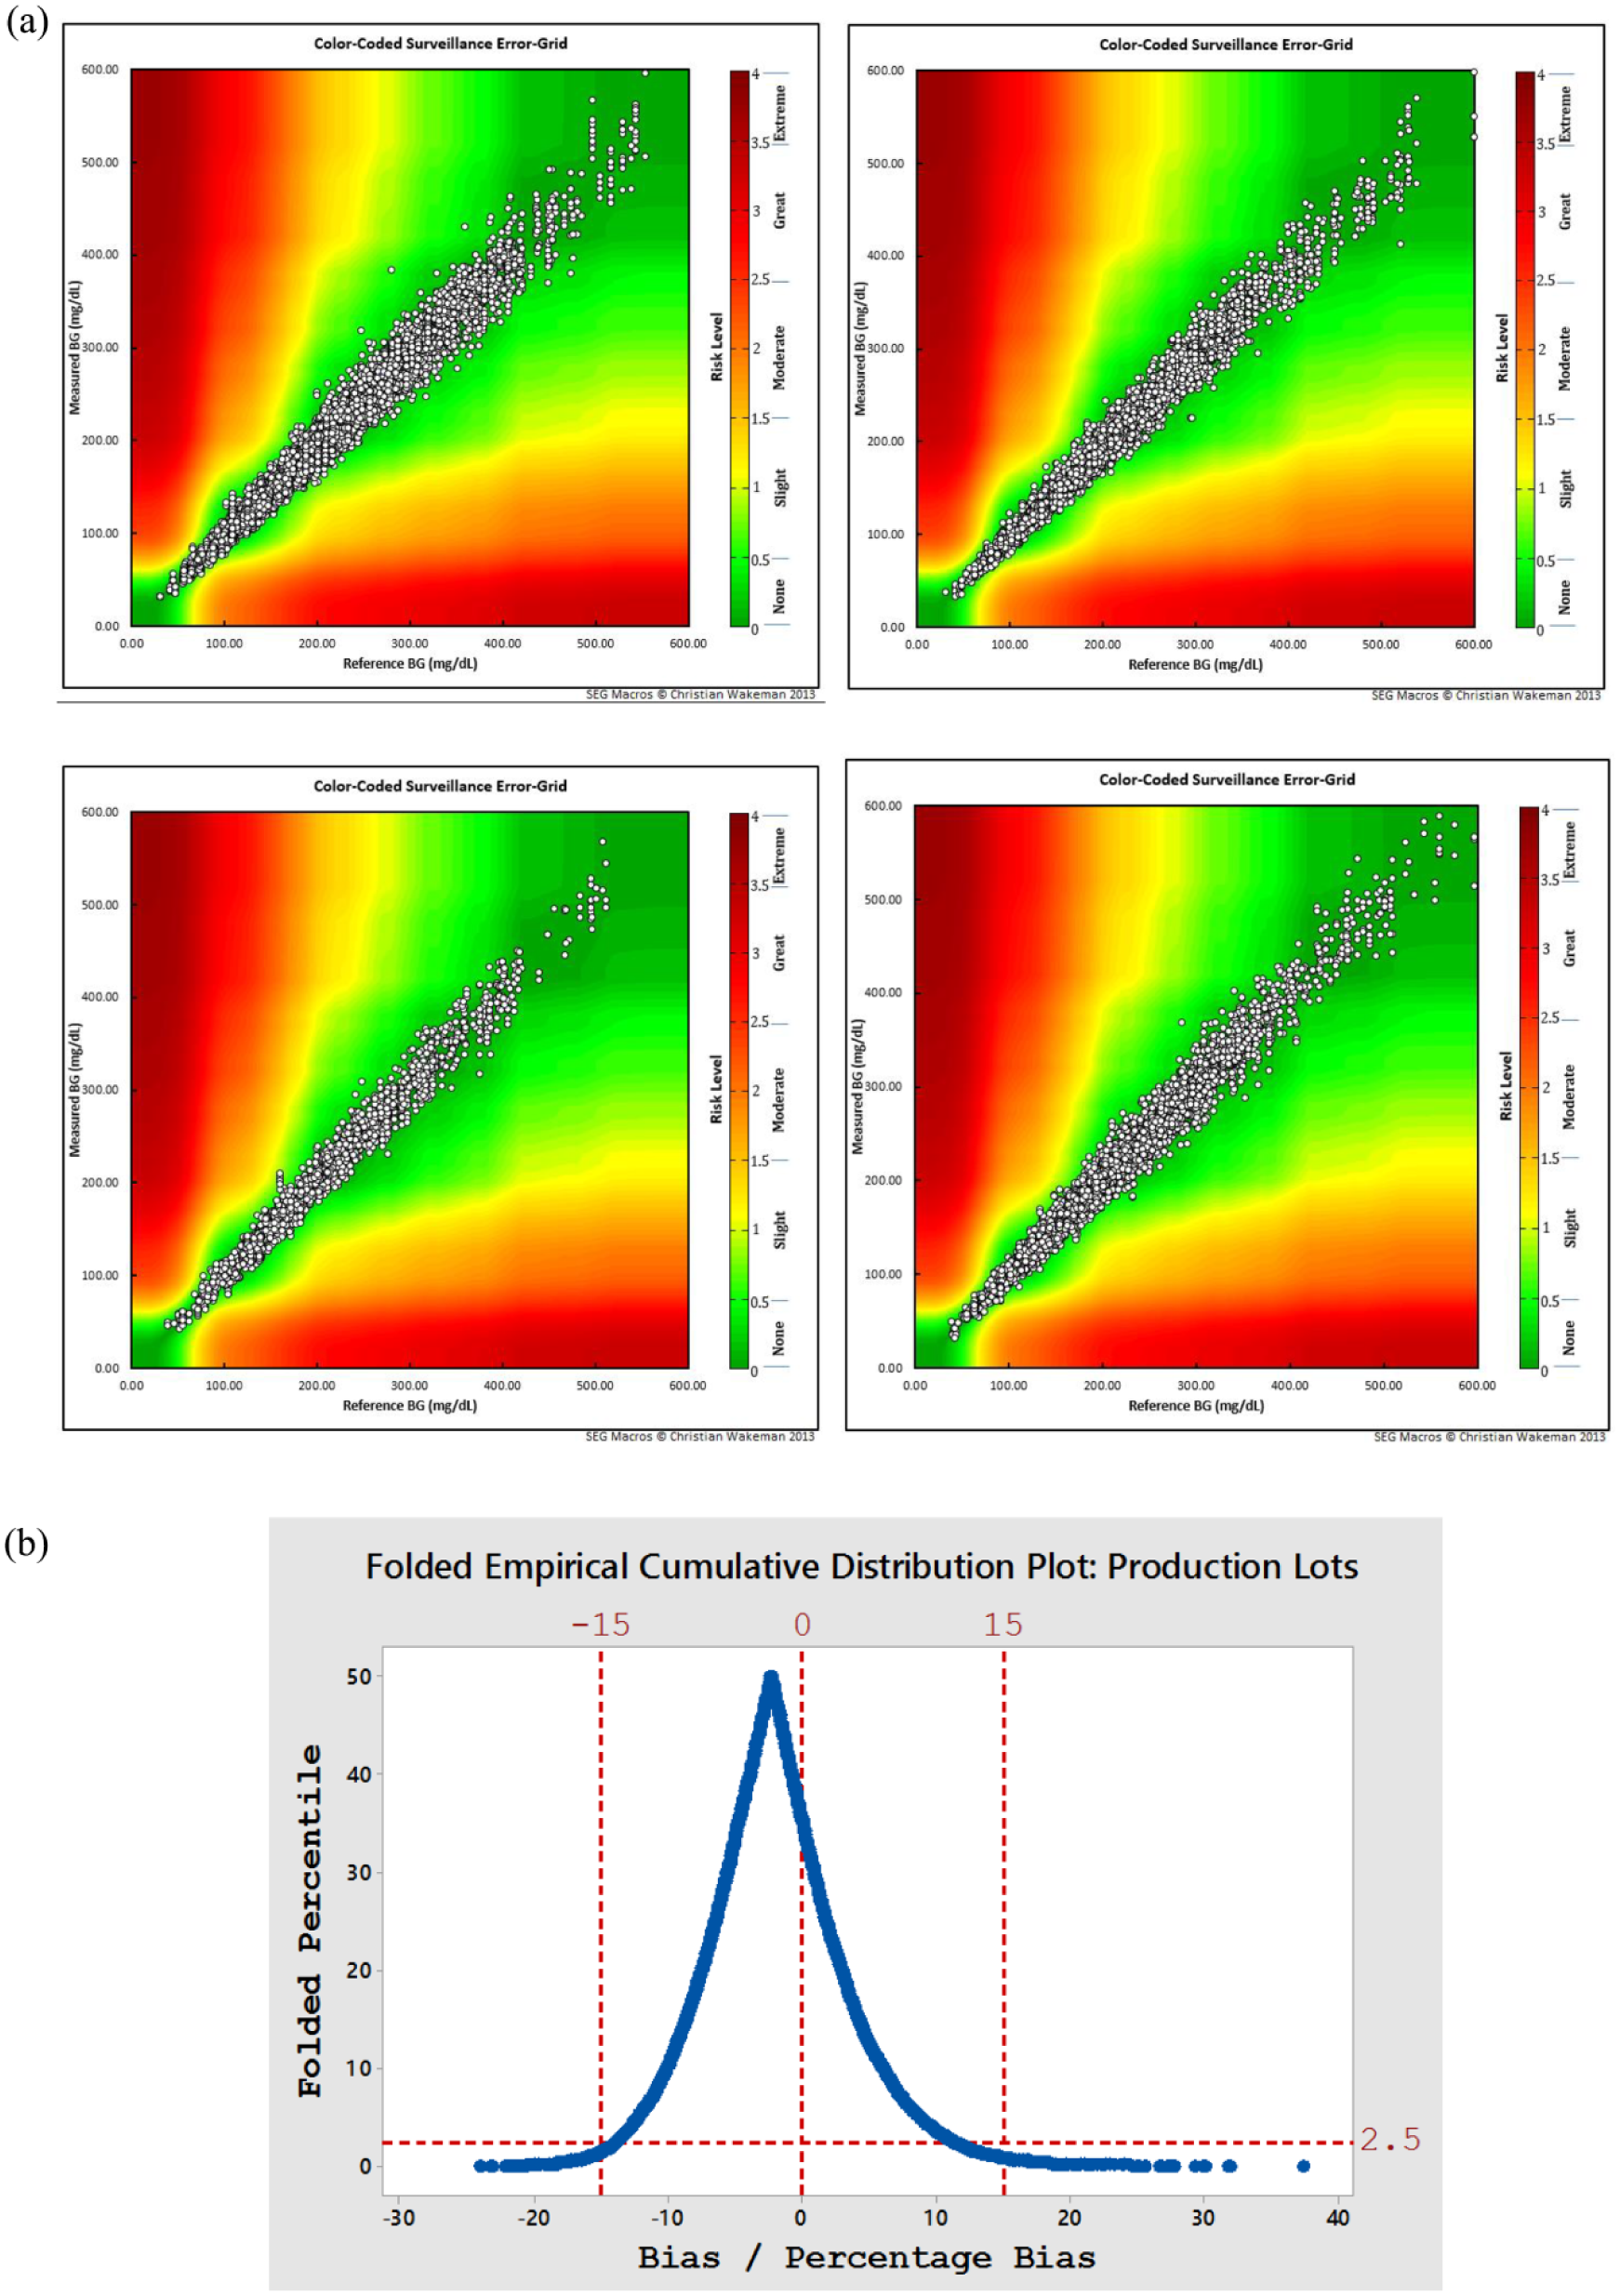
(a) Surveillance error grid plot split by year, clockwise from top left, 2015, 2016, 2017, 2018: Overall, all values represented either no risk (98.1%, risk level <0.5) or slight risk (1.9%; risk level 0.5-1.5). (b) Mountain plot showing cumulative distribution of values, with 95% of all values falling within −13.9 and 11.2 (mg/dL or %).
An overall visualization of data distribution relative to reference is shown as a folded empirical cumulative distribution plot (Figure 2b). The lower and upper 2.5th percentile of values equated to −13.88 (mg/dL or %) and 11.21 (mg/dL or %), respectively, comparing favorably with the ISO clinical accuracy guidelines of ±15 (mg/dL or %). The 50% point of inflection is biased slightly negatively to reference, indicating the complexity of targeting product performance to clinical target values.
Overall Clinical Accuracy at Extremes of Hct
A primary purpose of the evaluation was to clinically assess test strip performance at extremes of Hct. As a single subject’s blood was paired with multiple batches within a clinic visit, there were a total 4748 different study/donor combinations (ie, each subject had a single Hct value per visit). Given the variable number of batches within a subject visit, each study/subject was given equal weighting to produce an estimate of Hct distribution (Figure 3a).
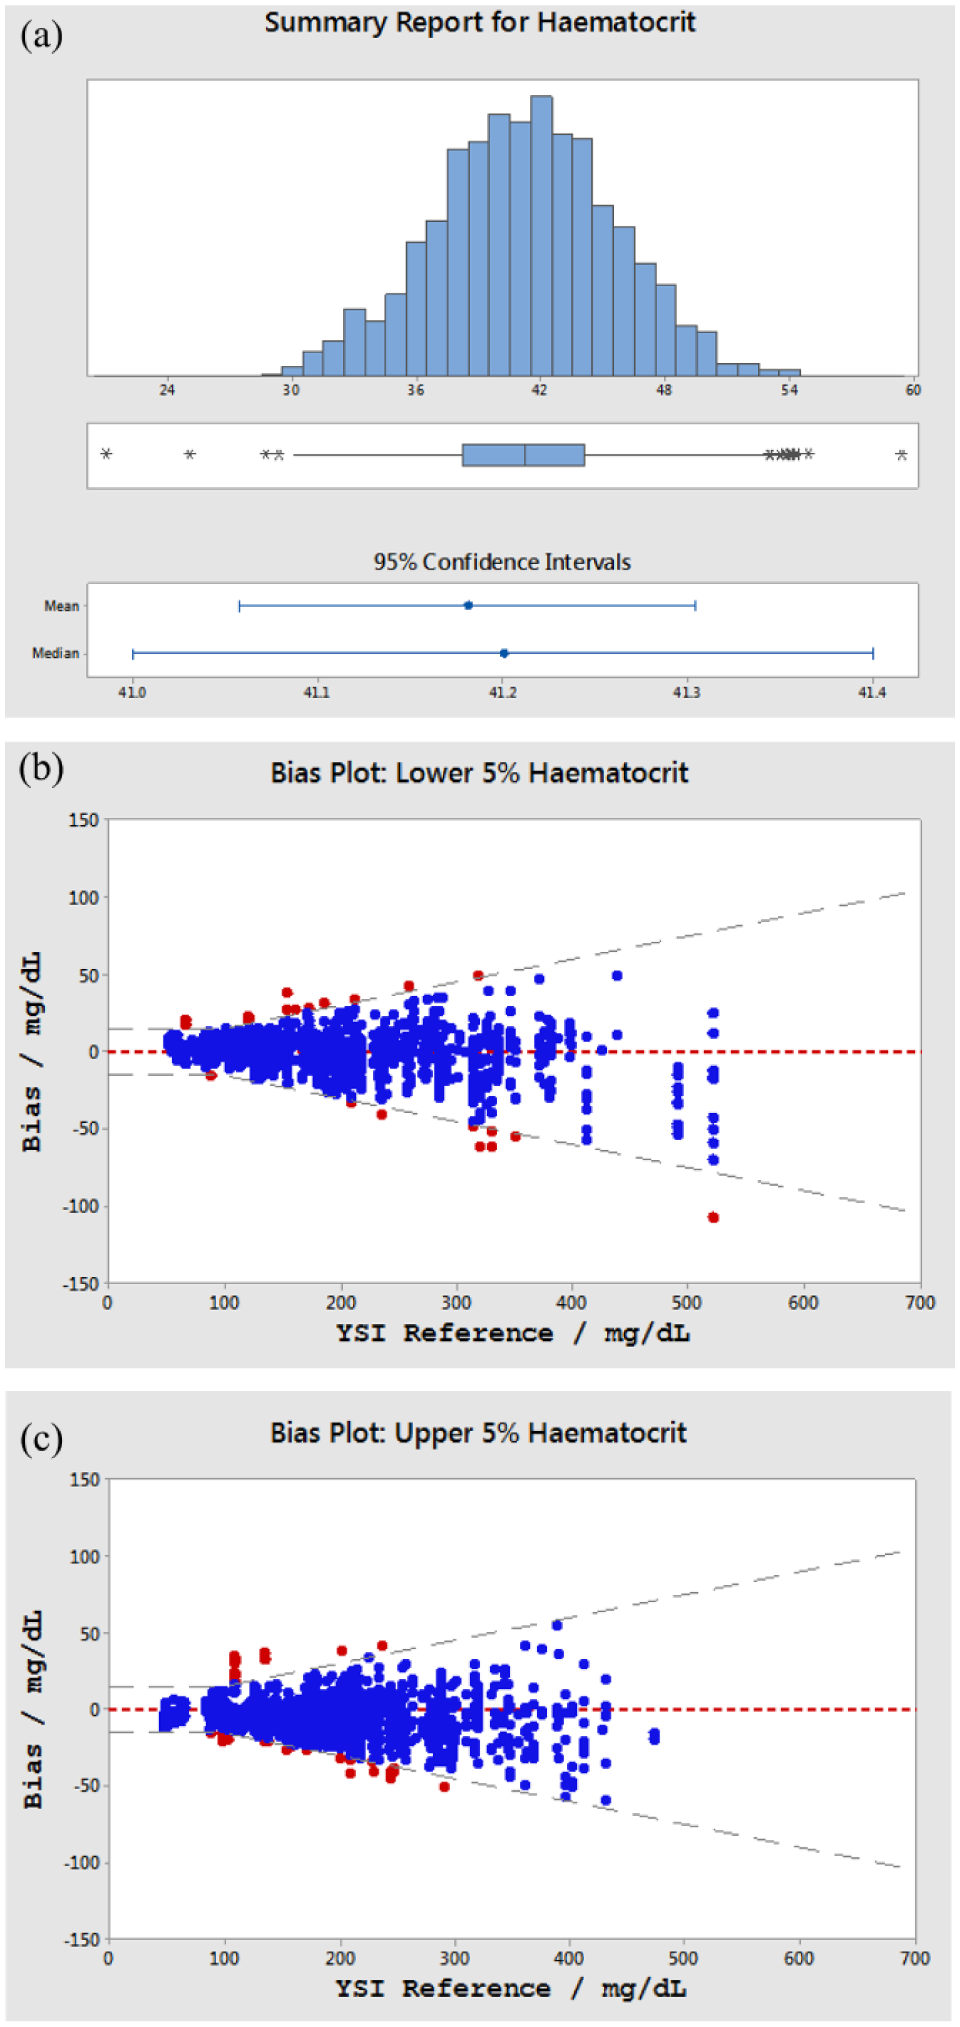
(a) Histogram of hematocrit distribution. Mean hematocrit: 41.2%; median hematocrit: 41.2%; range 21.0-59.4% (n = 4748). (b) Difference plot of SMBG values within the lowest 5% of hematocrit distribution (21.0-33.8%). (c) Difference plot of SMBG values within the highest 5% of hematocrit distribution (48.3-59.4%).
An extreme Hct was defined as a value below the 5th or above the 95th percentile by distribution, equating to a <5th percentile Hct range of 21.0-33.8% and >95th percentile range of 48.3-59.4%. Thus, certain values were outside the claimed Hct range of the product (30-55%) but were included. The clinical accuracy of these 2 populations were assessed with 97.9% and 96.4% of values <5th and >95th percentile by Hct distribution respectively, thus meeting the ISO requirement within these extremes of distribution. Clinical accuracy data may also be presented in the form of a difference plot in which the difference between each individual BGMS value from the average of the reference values is plotted. Data are shown in Figures 3b and 3c for the population of values obtained within the lowest and highest 5% Hct distributions, respectively, the dashed lines representing the ISO requirement.
Overall Clinical Accuracy by Glucose Concentration
Figure 4 shows a histogram of glucose distribution for all subject reference glucose measurements recorded in this assessment: Median and mean clinic glucose were 196 mg/dL and 209 mg/dL respectively (SD, 90 mg/dL; glucose range: 30-695 mg/dL). The clinical glucose distribution was nonnormal due to lower limit of distribution bounded by zero glucose.
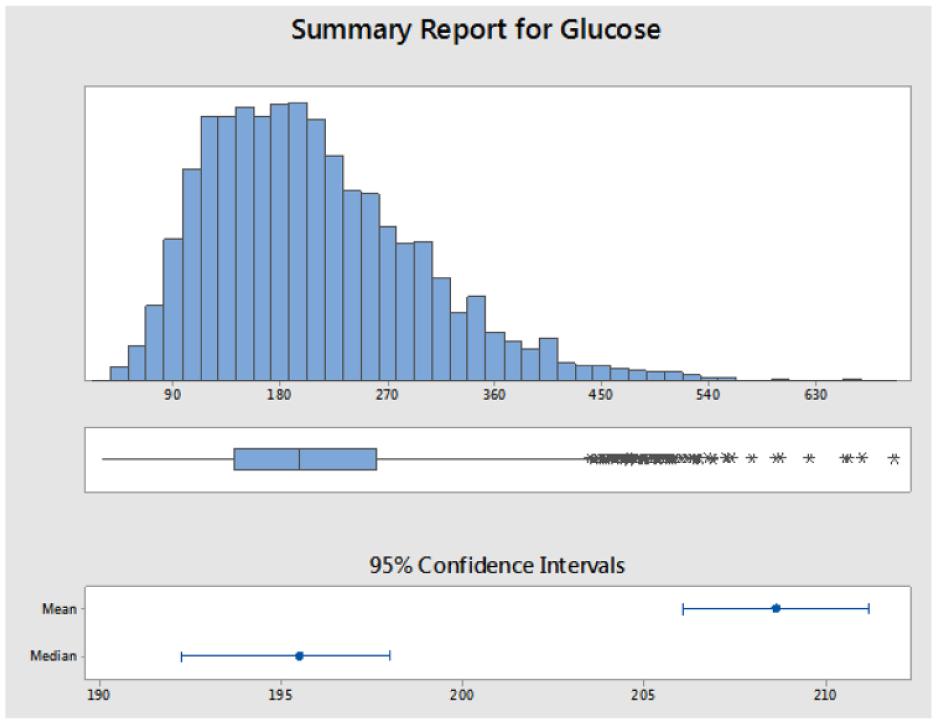
Histogram of patient reference glucose concentrations. Mean glucose 209 mg/dL; median glucose 196 mg/dL; range 30-695 mg/dL (n = 4748).
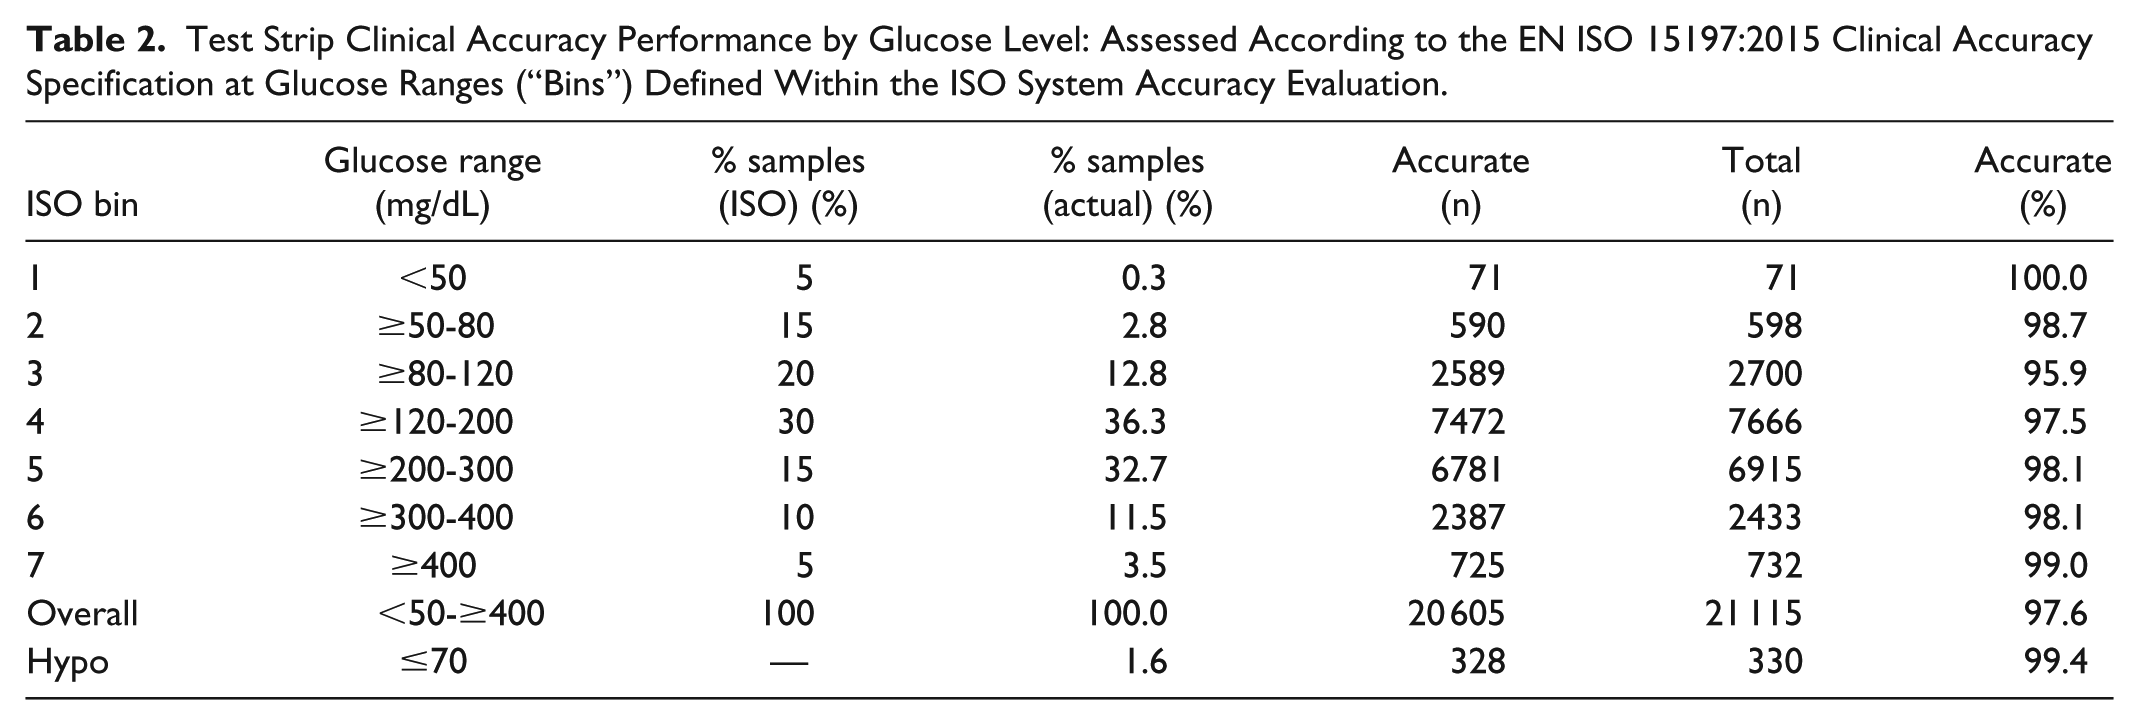
ISO requires that BGM systems be evaluated for system accuracy using fresh capillary blood in a clinic or hospital setting. The standard also requires assessment across the claimed glucose range, defining glucose “bins” and the percentage of samples required within each bin. Recognizing difficulties in obtaining samples from subjects at high or low glucose, the standard allows a certain number of samples within the lower (1, 2) and higher (6, 7) bins to be manipulated to meet the prescribed BG distribution. The reference glucose distribution may be summarized according to the ISO-defined bins, as shown in Table 2 and compared against the proscribed ISO distribution. This approach highlights differences between the “real-world” reference glucose distribution and ISO. Notably, ISO requires 5% and 15% of samples to be within glucose ranges <50 mg/dL and ≥50-80 mg/dL (bins 1, 2) compared to 0.3% and 2.8%, respectively, recorded within this substantial patient population. Clinical accuracy by glucose concentration is also shown in Table 2. The product meets the ISO clinical accuracy requirements of within each glucose bin, whereas the standard mandates a minimum 95% requirement across the full glucose range claimed for a test system. Under conditions of hypoglycemia, 8 99.4% of results (328/330) met the standard, corresponding to 1.6% of the total number of results.
Test Strip Clinical Accuracy Performance by Glucose Level: Assessed According to the EN ISO 15197:2015 Clinical Accuracy Specification at Glucose Ranges (“Bins”) Defined Within the ISO System Accuracy Evaluation.
Clinical Accuracy at Extremes of Hematocrit and Glucose
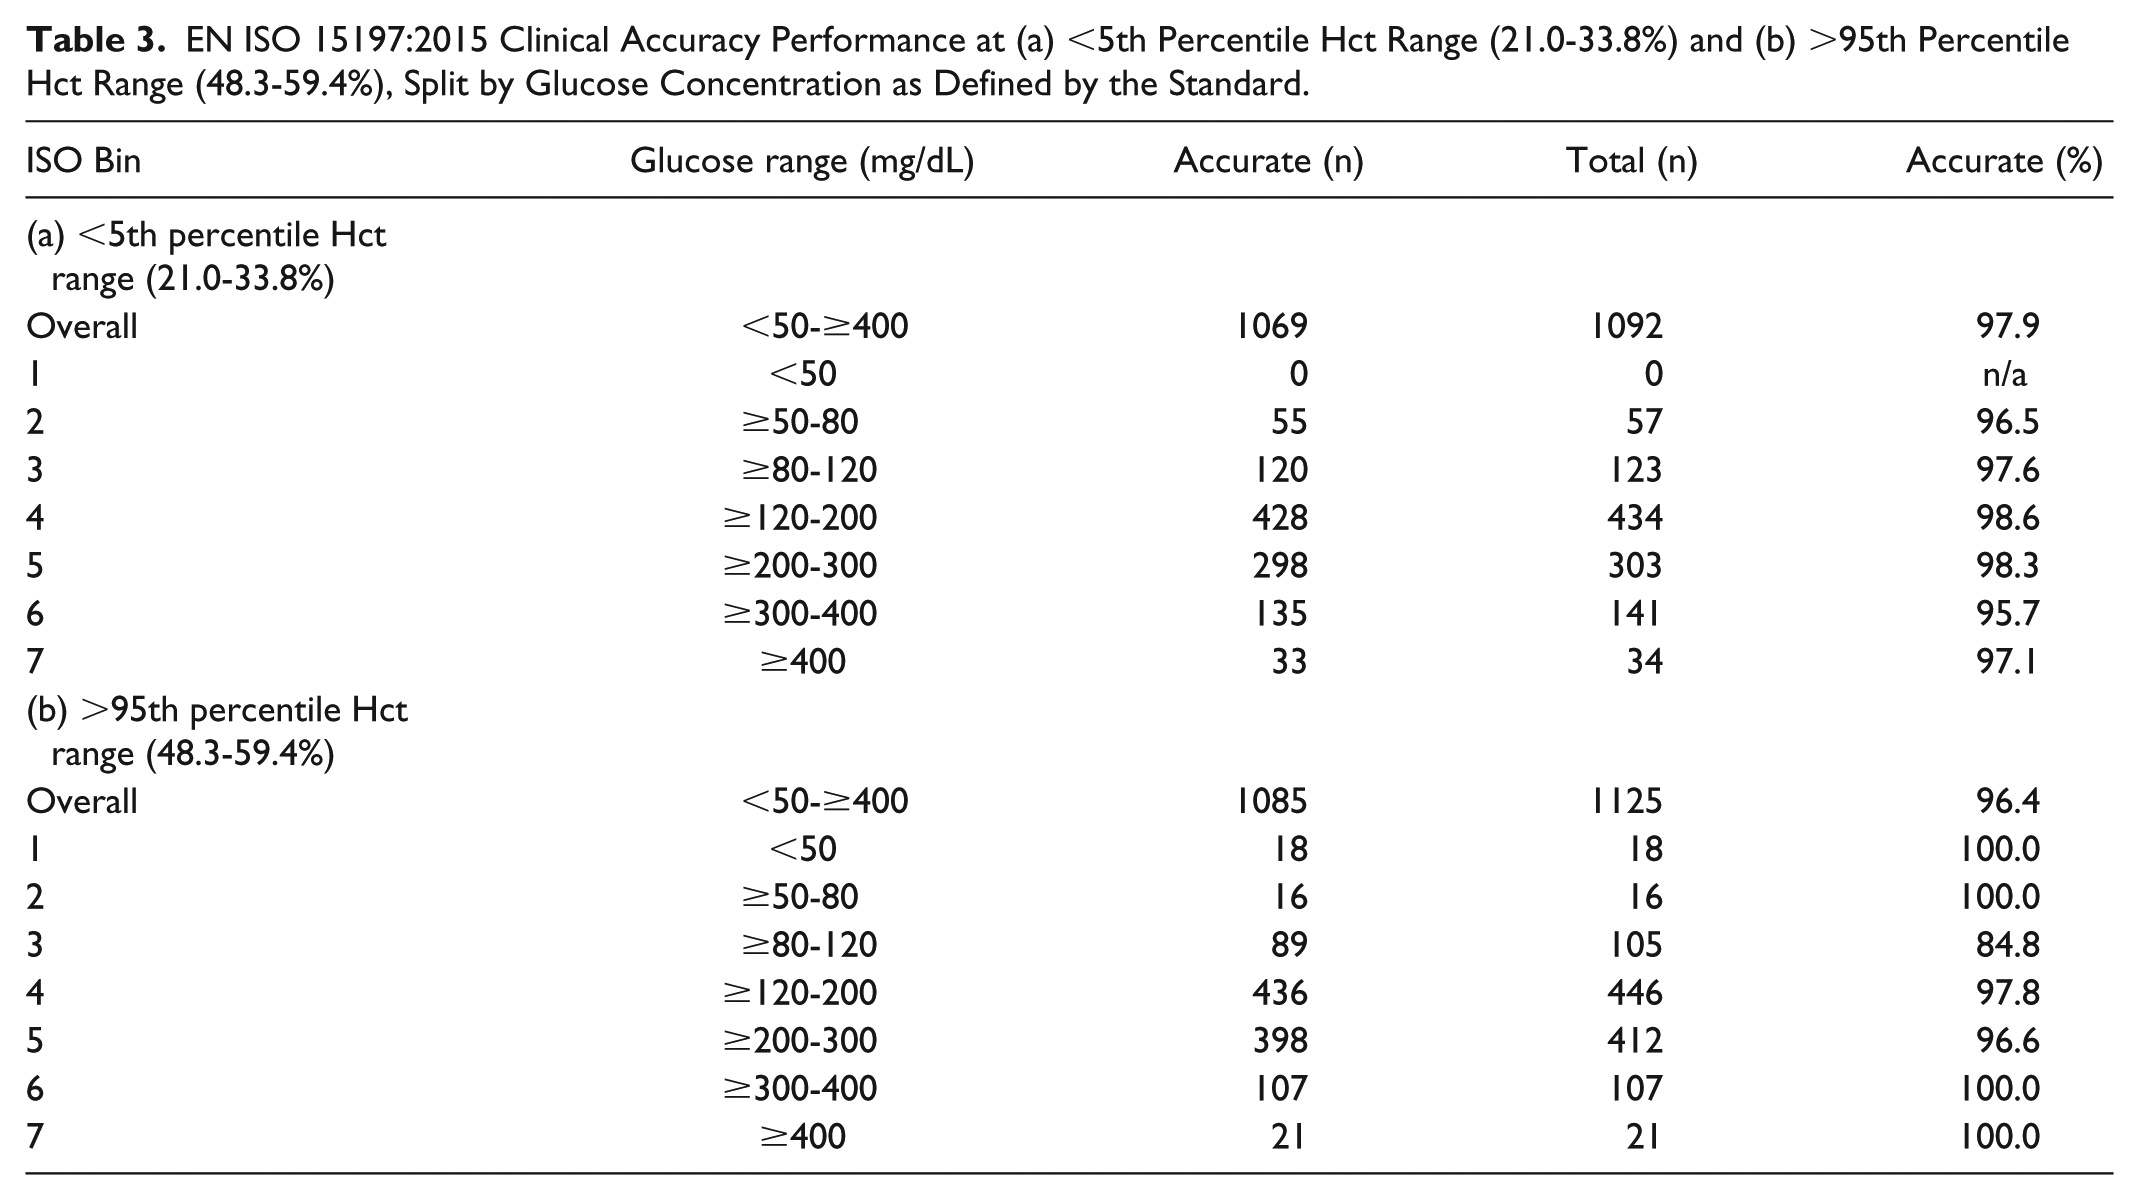
The clinical accuracy of the product at these extremes of Hct were then further assessed across the 7 glucose ISO bin ranges (Table 3). As previously stated, 97.9% (1069/1092) and 96.4% (1085/1125) of values met the ISO clinical accuracy criterion for the <5th and >95th Hct percentile populations respectively. This “stacked” type of assessment in which the performance of the product is tested across narrowly defined glucose ranges at the extremes of Hct distribution indicates that clinical accuracy, as defined by ISO, is met for all conditions, excepting the range ≥80-120 mg/dL where 84.8% (89/105 values) were within ±15 mg/dL or ±15% of reference. However, examination of the Surveillance EG (Figure 2a) shows that there is no obvious deterioration in product performance across this glucose range and that there is no clinical risk posed to those 10% of subjects at these Hct extremes. Indeed, in those glucose ranges where diabetes therapy decisions may more frequently considered, 97.7% of values met the ISO clinical accuracy requirement (385/394) within this Hct extreme population.
EN ISO 15197:2015 Clinical Accuracy Performance at (a) <5th Percentile Hct Range (21.0-33.8%) and (b) >95th Percentile Hct Range (48.3-59.4%), Split by Glucose Concentration as Defined by the Standard.
Control Batch Performance
Of the 2628 values recorded, 2558 (97.3%) were within the ISO clinical accuracy requirement over the test period of June 2016-November 2017, compared to 97.6% for the production dataset. Surveillance EG assessment classified 97.8% (2568/2628) and 2.2% (57/2628) within risk levels “‘none” and “slight (lower),” respectively with no values representing a risk level >1 (Figure 5). Evaluating clinical accuracy across each of the discrete glucose bins defined, as per ISO, indicated >95% accuracy within each bin. At Hct levels <5th percentile and >95th percentile, 97.6% (123/126) and 91.9% (114/124) of values were within ±15 mg/dL or ±15% of reference, respectively.
Surveillance error grid plot of control batch data with 97.8% and 2.2% of values being within risk levels “none” and “slight” (lower), respectively. No values with risk level >1 recorded.
Discussion
BGM Systematic Post-Market Surveillance
Manufacturers are required to submit evidence demonstrating that their products meet their claims and adhere to local registration requirements, such as the widely recognized EN ISO 15197:2015 accuracy standard. While this is a prerequisite to market entry, there is no requirement on manufacturers to ensure products continue to meet accuracy claims post-launch.9-12 In response, the Diabetes Technology Society (DTS) launched the DTS-BGMS surveillance program in 2014, an independent activity that assesses post-launch BGM performance. Predating the DTS initiative by many years, the manufacturer has implemented systematic post-launch surveillance programs for its test strip products since launch,4,5 with testing being performed by trained clinical personnel. This data represents the first formal reporting of the long-term clinical performance of the Select Plus test strip since its 2015 launch.
The clinical assessment approach adopted by the manufacturer may be considered similar but more robust than the DTS program. Both target a minimum of 100 individual subjects per investigation, with testing performed by professionals located on 3 clinical sites and both compare values to reference instruments. The approaches differ in that DTS requires product to be purchased within market (eg, pharmacy) and assessed at 3 separate sites, whereas this surveillance program routinely tests randomly sampled production batches.
A strength of the manufacturer’s approach is that the surveillance is systematic and longitudinal, thus variations in raw materials (batch-to-batch differences, new suppliers, materials changes), maintenance or replacement of production equipment and mechanical components, and differences in manufacturing personnel over time are all captured within the ongoing surveillance. The DTS approach assesses a limited number of strip batches (although no requirement as to how many batches tested) within a limited time-frame (this factor is recognized by DTS and industry awaits to see if proposals are to be made for more regular evaluations). In contrast, this ongoing data-set provides a routine assessment of clinical performance against ISO and is currently based on 209 batches tested over 3-years. In addition, the manufacturer’s approach draws on a large subject base and thus captures system performance at glucose and Hct extremes and without the need for in vitro sample manipulation to verify accuracy within certain BG ranges. The OneTouch Select Plus BGM system has not yet been assessed within the DTS program given that it is not commercially available in the US.
Purpose of the Surveillance Program
This surveillance activity serves 2 purposes: (1) early identification of trends in clinical performance, hence potentially identifying and mitigating causal factors such as changes in raw materials or process components and (2) feedback of clinical data to periodically adjust parameters governing release of batches from the factory. In effect, both the manufacturer and DTS programs have the same outcome—assurance that there is no degradation in clinical performance versus product claims. In addition, the duration and extent of the study presented here has resulted in an appreciable subset of subjects presenting at extremes of glucose (bins 1, 2, 6, 7) where the sample was capillary blood which, unlike many reported ISO clinical accuracy evaluations,13,14 required neither subject nor sample manipulation to meet the prescribed ISO glucose bin distribution.
Clinical Accuracy Versus Published Clinical Evaluations
Many system accuracy-like studies are either performed directly by manufacturers; 15 within independent laboratories funded by manufacturers;16,17 or by independent researchers and may focus on a single or several products.3,18 A more questioning approach may be taken toward those studies sponsored by a manufacturer in which the same manufacturer’s product is assessed, either by itself or alongside competitor products, in that findings are often more favorable to the sponsor’s test system.19,20 However, a counterpoint to this “sponsorship bias” would be that manufacturers are, for example, more aware of potential off-sets that exist between different reference instruments, which may contradict product labelling and therefore mitigate for factors impacting performance.21,22
The nature of the applied blood sample also has a significant impact upon accuracy with a recent study demonstrating the impact of applying either capillary or venous blood samples to the same strip product under identical conditions. 23 Furthermore, even when design or reference methodology is common, interpretation of results between studies is not always straightforward. Many system accuracy-like studies, such as DTS, are performed on a single or limited number of strip batches and tested on a minimum number of subjects (eg, 100). While a valid approach, the mean bias of individual strip batches to reference varies, as would be expected of any manufacturing process and therefore assessing performance on a single, or limited number of batches risks painting an incomplete picture of device performance. For example, randomly sampling a minimum number of batches that, by chance, exhibit a mean bias to reference of ~0%, compared to batches of the same product exhibiting a mean bias of ~5%, may both meet the ISO standard and the manufacturer’s product release criteria, but provide two different (but equally valid) “snapshots” of product performance.
Furthermore, many study designs assess the performance of different manufacturer’s systems within the same study and thus draw on the same patient population and, where possible, the same patient blood sample. While these studies are broadly designed according to ISO methodology, study differences may exist, such as exactly filling the glucose distribution bins or, as is more common, including all subject bloods in the evaluation, irrespective of glucose distribution. Therefore, in many cases, studies cannot be considered true system accuracy evaluations as per ISO, but nonetheless provide a measure of system clinical performance.
Certain of the study limitations discussed above may be leveled at the surveillance initiative reported here, not least the fact that it is funded by the manufacturer. However, many other limitations do not apply: multiple batches have been assessed routinely and frequently across all years since launch, thus the dataset may reasonably be considered representative of the full distribution of product manufactured and released to market. Furthermore, product was assessed at 3 different clinic sites by separate teams of clinical staff and without capillary blood manipulation to fill distribution bins.
Conclusions
People with diabetes require clinically accurate and reliable systems capable of safely and effectively measuring glucose levels. Currently, it is not required for manufacturers of cleared systems to demonstrate continued adherence to clinical accuracy claims, leading to concerns regarding patient safety. This issue has been of sufficient concern for the DTS to advocate, then initiate a post-market surveillance program for 18 BGMS systems available in the United States, albeit with limitations ( limited number of strip batches; single point-in-time assessment). Data presented here report on a manufacturer’s self-imposed surveillance program, aimed at ensuring the delivery of clinically accurate test strip product to market, based on a large dataset (209 production batches gathered over the 3-years since strip product launch). The scale of the dataset has allowed demonstration of the clinical utility and relevance of the strip product at extremes of glucose (<50 to ≥400 mg/dL) and Hct (21-59%) in naturally obtained (unmanipulated) blood samples. The manufacturer will continue its systematic surveillance program and advocates that other BGM, also CGM, manufacturers adopt similarly robust and systematic surveillance programs.
Footnotes
Acknowledgements
The authors would like to thank Jeff Rodger for data analysis, Hilary Cameron for data analysis verification, staff at each clinic site responsible for data generation, and Brian Levy, MD for manuscript review.
Abbreviations
ADA, American Diabetes Association; BG, blood glucose; BGMS, blood glucose measurement system; DTS, Diabetes Technology Society; EG, error grid; Hct, hematocrit; ISO, International Organization for Standardization; NHS, National Health Service; RBC, red blood cell; s, second; SEG, surveillance error grid; SMBG, self-monitoring of blood glucose; YSI, Yellow Springs Instruments.
Declaration of Conflicting Interests
The author(s) declared the following potential conflicts of interest with respect to the research, authorship, and/or publication of this article: SS, SP, and MG are full-time employees of LifeScan Scotland.
Funding
The author(s) disclosed receipt of the following financial support for the research, authorship, and/or publication of this article: This work was funded by LifeScan Scotland.