
Abstract
Background:
The decisive factor in successful intensive insulin therapy is the ability to deliver need-based-adjusted nutrition-independent insulin dosages at the closest possible approximation to the physiological insulin level. Because this basal insulin requirement is strongly influenced by the patient’s lifestyle, its subtlety is of great importance. This challenge is very different between patients with type 1 diabetes and those with insulin-dependent type 2 diabetes. Furthermore, it is more difficult to finetune a basal insulin dosage with intensified conventional insulin therapy (ICT), due to delayed insulin delivery, compared to insulin pump therapy, which provides continuous delivery of small doses of exclusively short-acting insulin. In all cases, the goal is to achieve an optimal basal delivery rate.
Method:
We hypothesized that this goal could be achieved with a modeling tool that determined the optimal basal insulin supply based on the patient’s anamnestic data and monitored glucose values. This type of modeling tool has been used in health insurance programs in Germany to improve insulin control in patients that receive ICT.
Results:
Our retrospective data analysis showed that this modeling tool provided a significant improvement in metabolic control, significant reductions in HbA1c and Q scores, and improved time-in-range values, with reduced daily insulin levels.
Conclusion:
The model-based basal rate test could provide additional data of the actual effect of the basal insulin adjustment in intensified insulin treated diabetes to the physician or treatment team.
Keywords
In everyday practice, individual adjustments in the basal, food-independent insulin requirement poses an enormous challenge in treating patients with diabetes. This challenge varies depending on whether patients have type 1 or type 2 diabetes and whether they are receiving intensified conventional insulin therapy (ICT) or insulin pump therapy (continuous subcutaneous insulin infusion [CSII]). In type 1 diabetes, insulin is completely absent and must be replaced, according to demand. In type 2 diabetes, the remaining insulin in the body can compensate for deficits in insulin dosage.
Both ICT and CSII aim to maintain basal physiological insulin levels. With ICT, the basal insulin concentration is maintained with delayed insulin delivery; in contrast, with CSII, it is maintained with a quasi-continuous infusion of exclusively short-acting insulin. The basal insulin dosage is a proportion of the daily insulin requirement, and this proportion depends on the age of the patient: in adults the proportion is approximately 50%;1-3 in children, it is approximately 30-35%4,5 of the daily insulin requirement.
To determine an optimal dosage for maintaining basal insulin, it is currently necessary to perform meal outlet tests. 6 The aim of that test is to achieve the strictest possible separation between the food-independent, basal insulin level and the meal-dependent insulin bolus. During fasting between meals, this distinction should ideally lead to a stable glucose course. However, it makes little sense to omit several meals in one day, because ketone bodies that form during the hunger phase can influence the insulin effect.7-9
In practice, there are few methods for adjusting the basal insulin effect with ICT. Various delayed-action insulin products can be used, such as the long-acting insulin analogue, insulin glargine, in concentrations of 100 units/ml (U100) and 300 units/ml (U300); insulin detemir, insulin deglutec, or human neutral protamine Hagedorn insulin. These products differ in the duration of action, which in turn, depends on the dose level. Theoretically, it is possible to optimize the basal insulin supply by injecting at different times or by combining different delayed-action insulins and their doses. However, it should be noted that the insulin effect varies in each individual, both from day to day and in the daily rhythm. Depending on the type of insulin, the effect can vary from 15% to 35%. 10 This variability often makes it difficult to design subtly coordinated deliveries of different insulins. In addition, none of the delayed-action insulins succeed in achieving physiological insulin levels. As a rule, pharmacological insulins consistently maintain flat serum levels. In contrast, the physiological insulin requirement depends on the time of day. In adults, the insulin requirement is highest in the morning and lowest at night and at noon. This circadian rhythm leads to deviations between the insulin required and the insulin level maintained, due to the flat effect profiles; accordingly, blood glucose levels are elevated (when the insulin level is too low) or low (when the insulin level is too high). When this situation becomes difficult for an individual patient to manage, they are typically switched to an insulin pump, which delivers a continuous infusion of small amounts of short-acting insulin. 2 In addition, the basal insulin requirement changes every day, depending on the patient’s activity, general health, and hormonal cycles (e.g., menstruation). Thus, the basal insulin dosage should be based, as far as possible, on the average or typical daily routine of the patient. These aspects of individual basal insulin levels demonstrate the complexity and current limitations of intensive insulin therapy, particularly when dosages are determined based on measurements acquired under routine clinical conditions.
In the present study, we hypothesized that a modeling tool that determined the optimal basal insulin supply based on the patient’s anamnestic data and monitored glucose values could contribute to finding an individual dosage that meets the basal insulin requirement for patients with diabetes.
Methods
The KADIS Model
We implemented the patented Karlsburg Diabetes Management System, KADIS®,11-13 developed at the Institute of Diabetes “Gerhardt Katsch” Karlsburg (Germany). This modeling system solved the dilemma of addressing metabolic behavior in individuals with diabetes, in a practical way, for the first time worldwide. Since 2006, this modeling system has been used successfully by health insurance companies in Germany as part of various diabetes care programs.
To model individual metabolic behavior, the modeling system required data that could be collected readily under everyday conditions. These data included sequential blood glucose measurements, either measured periodically by the patient (self-monitored blood glucose [SMBG]) or continuously monitored with a continuous glucose monitoring (CGM) device; type of therapy (insulin injections and/or tablets and/or GLP1 analogs); food intake (grams of carbohydrate); and physical activity (sports). In addition, it required a few basic characteristics of the patient (eg, age, diabetes type, duration of disease, body weight, and height). These data were collected and documented by the patient during a 3-day monitoring period (3-day test), according to a structured protocol for measurements under everyday conditions. This test could optionally be extended up to 7 days (7-day test). The KADIS modeling system then used these parameters to construct a model of the patient’s metabolic profile. The model parameters were adjusted until the daily glucose profile calculated by the model showed minimal deviation from the glucose profiles measured with CGM or SMBG. In the field of type 2 diabetes, the model-supported determination of the patient’s remaining insulin levels represented a unique functionality that could be useful worldwide. Model iterations produced an in-silico map of the patient’s individual metabolic behavior, also referred to as a personalized “metabolic fingerprint” (Figure 1).
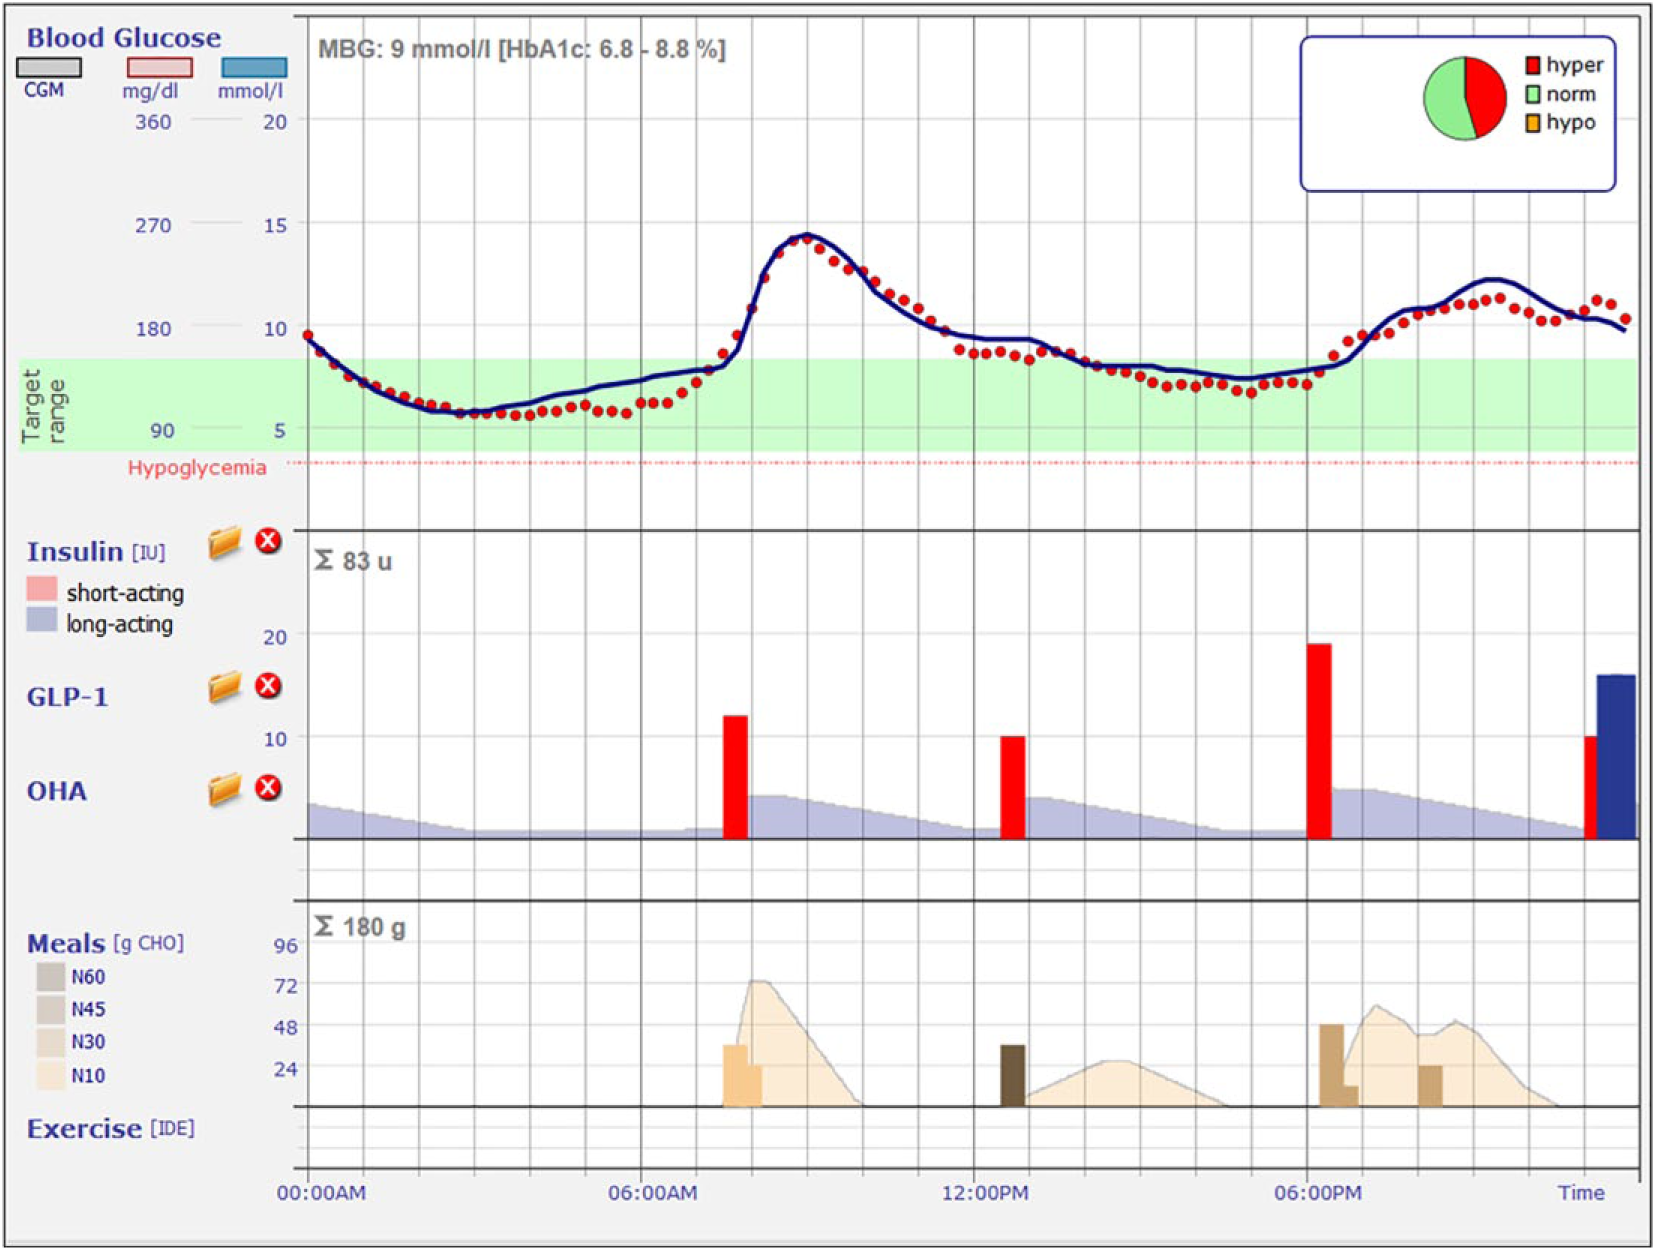
Example of a patient’s metabolic profile, known as the “metabolic fingerprint.” Red dots are the glucose values from continuous glucose monitoring; blue line is the 24-hour glucose profile calculated with the KADIS system. Red bars are the bolus insulin injections; blue bar is the basal insulin level. Yellow and brown bars indicate the amount (g) of carbohydrate (CHO) intake during meals.
Based on the personalized metabolic fingerprint, the basal insulin status could be determined quickly and easily, and the basal insulin dosage could be adjusted for optimal effects. With this method, it was not necessary to conduct complex and stressful (for the patient) meal outlet tests. The KADIS modeling tool was used for making recommendations of changes in insulin delivery for patients with diabetes (types 1 and 2) treated with insulin infusions. In the present retrospective study, we evaluated data collected after the recommendations were made to investigate the basal insulin effect on the state of diabetes. We evaluated the HbA1c value, as a long-term parameter, and we used the Q score 14 (developed at the Institute of Diabetes “Gerhardt Katsch” Karlsburg) to assess and evaluate the glucose profiles from the 3-day tests.
The Q-Score
The Q score is a dimensionless parameter that measures the mean blood glucose concentration, the times during the day that blood glucose is low (<3.9 mmol/l or 70 mg/dl) or high (>10 mmol/l or 180 mg/dl), the maximum difference between glucose values over one day (RANGE), and the mean difference in glucose concentrations between the three days (MODD). Q-score values <4.0 indicate very good metabolic control without significant risk; values of 4.0-5.9 indicate good metabolic control, with low risk; values of 6.0-8.4 indicate adequate metabolic control, with some risk; and values of 8.5-11.9 indicate problematic metabolic control, with high risk. Q-score values ≥12.0 indicate inadequate metabolism, with very high risk. The individual risk categories refer to the risk of developing late complications of diabetes (eg, amputation, blindness, diabetic nephropathy).
Patients
The statutory health insurance companies in Germany initiated care programs based on KADIS-supported recommendations for individuals with diabetes. Patients were selected by their health insurance companies and enrolled in the care programs based on available HbA1c values from the disease management programs (DMP; diabetes type 1 or type 2). After providing informed consent, the health insurance companies established contact between the insured/patients and the Diabetes Service Center (DCC) in Karlsburg. The DCC then established a cooperation agreement with the treating physician of the respective patient. The inclusion criteria for participation in the care programs were: unsatisfactory metabolic control (HbA1c >8.0 %) and enrollment in the respective DMP of the insurer.
The DCC then sent the patients instructions for conducting the 3-day test under everyday conditions. The instructions included a form for collecting anamnestic data (type of diabetes, type of therapy and dosage, body weight, height) and a structured measurement plan. During the test, patients documented all meals, therapy (insulin and/or tablets and/or GLP1 analogs and/or SGLT2 inhibitors), and SMBG values (measured before meals; 1 h and 2 h after the main meals; and 1-2 times during the night between 23:00 and 05:00). A smartphone app (Android and iPhone versions) was available for carrying out the 3-day test. Alternatively, the test could also be documented on paper, with a form provided by the DCC. From the data received, a metabolic fingerprint was determined for each patient with the KADIS program. For all patients treated with ICT that had a Q-Score >8.5, an initial test of the basal insulin effect was performed with the KADIS program (basal rate test). The program was used to calculate the 24-h glucose profile during basal insulin administration on the basis of the individual’s metabolic fingerprint. In this mathematical analysis, all meals and insulin bolus doses were excluded; thus, only the basal insulin supply was taken into account. The result was used to determine the subsequent basal insulin delivery rate recommendation. When the 24-h glucose profile was within the target range, this recommendation could be dispensed with. Otherwise, the basal insulin administration (basal delivery rate) was optimized with multiple iterations of KADIS-supported simulations, until the calculated glucose values were within the target range. Subsequently, insulin bolus administrations and meals were again included in the calculation of the KADIS program to obtain a complete picture of glycemic regulation. When the addition of insulin boluses led to a shift in the 24-h glucose profile outside the desired range, the insulin boluses were adjusted accordingly and the basal delivery rate was readjusted. Therefore, the resulting basal rate recommendation was based on the bolus delivery and basal delivery rate calculations. All adjustments were performed by an experienced diabetes specialist (DCC physician) in an interactive dialogue with the KADIS system. The results of the 3-day test and the recommendations developed with the program were made available to the treatment teams in a report. 13 This procedure was repeated quarterly for a period of one year. For each participant in the care program, 4 evaluations with the KADIS program (metabolic fingerprint) and the associated 3-day tests were carried out and saved anonymously.
For the present study, we retrospectively evaluated data for all patients that received ICT with an initial unsatisfactory metabolic setting (based on the first 3-day test). We compared insulin therapy data from the first 3-day test with data from a subsequent test performed 3 months later, to evaluate whether the recommendations for the basal rate setting had been implemented. This resulted in the following classifications: → →
Statistical Analyses
The mean values and dispersions were calculated for the examined parameters in groups A and B and separately for each type of diabetes. Comparisons between the two groups, with respect to the individual parameters and the test results were performed with the T-test (two-sided).
The primary parameter was the ratio between the bolus and the basal rate (bolus:basal insulin) or the percentage of the daily insulin quantity that was delivered as an insulin bolus. Secondary parameters were the Q score, the HbA1c value, the time-in-range value (TIR: 3.9-10 mmol/L or 70-180 mg/dl), and the total daily insulin dose. The evaluations were performed separately for patients with type 1 and patients with type 2 diabetes.
Results
A total of 337 patients were included in this retrospective evaluation. Of these, 36 patients had type 1 diabetes (Table 1) and 301 had type 2 diabetes (Table 2). For the first 3-day test, all patients underwent intensified insulin therapy and were not optimally adjusted in terms of HbA1c or the calculated Q score. After the first 3-day test, in each case, a basal rate recommendation was prepared by the DCC diabetes specialist. The recommendation was reported to each patient’s attending physician or treatment team. At 3 months, a second 3-day test was performed to determine which patients had implemented the recommendations. Patients were assigned to group A, when the basal rate recommendation was implemented into the insulin therapy treatment and to Group B when the recommendation was not implemented.
Comparison Between Relevant Parameters Measured at Baseline and After 3-6 Months in Patients With Type 1 Diabetes That Implemented (Group A) or Did Not Implement (Group B) a Basal Rate Recommendation.
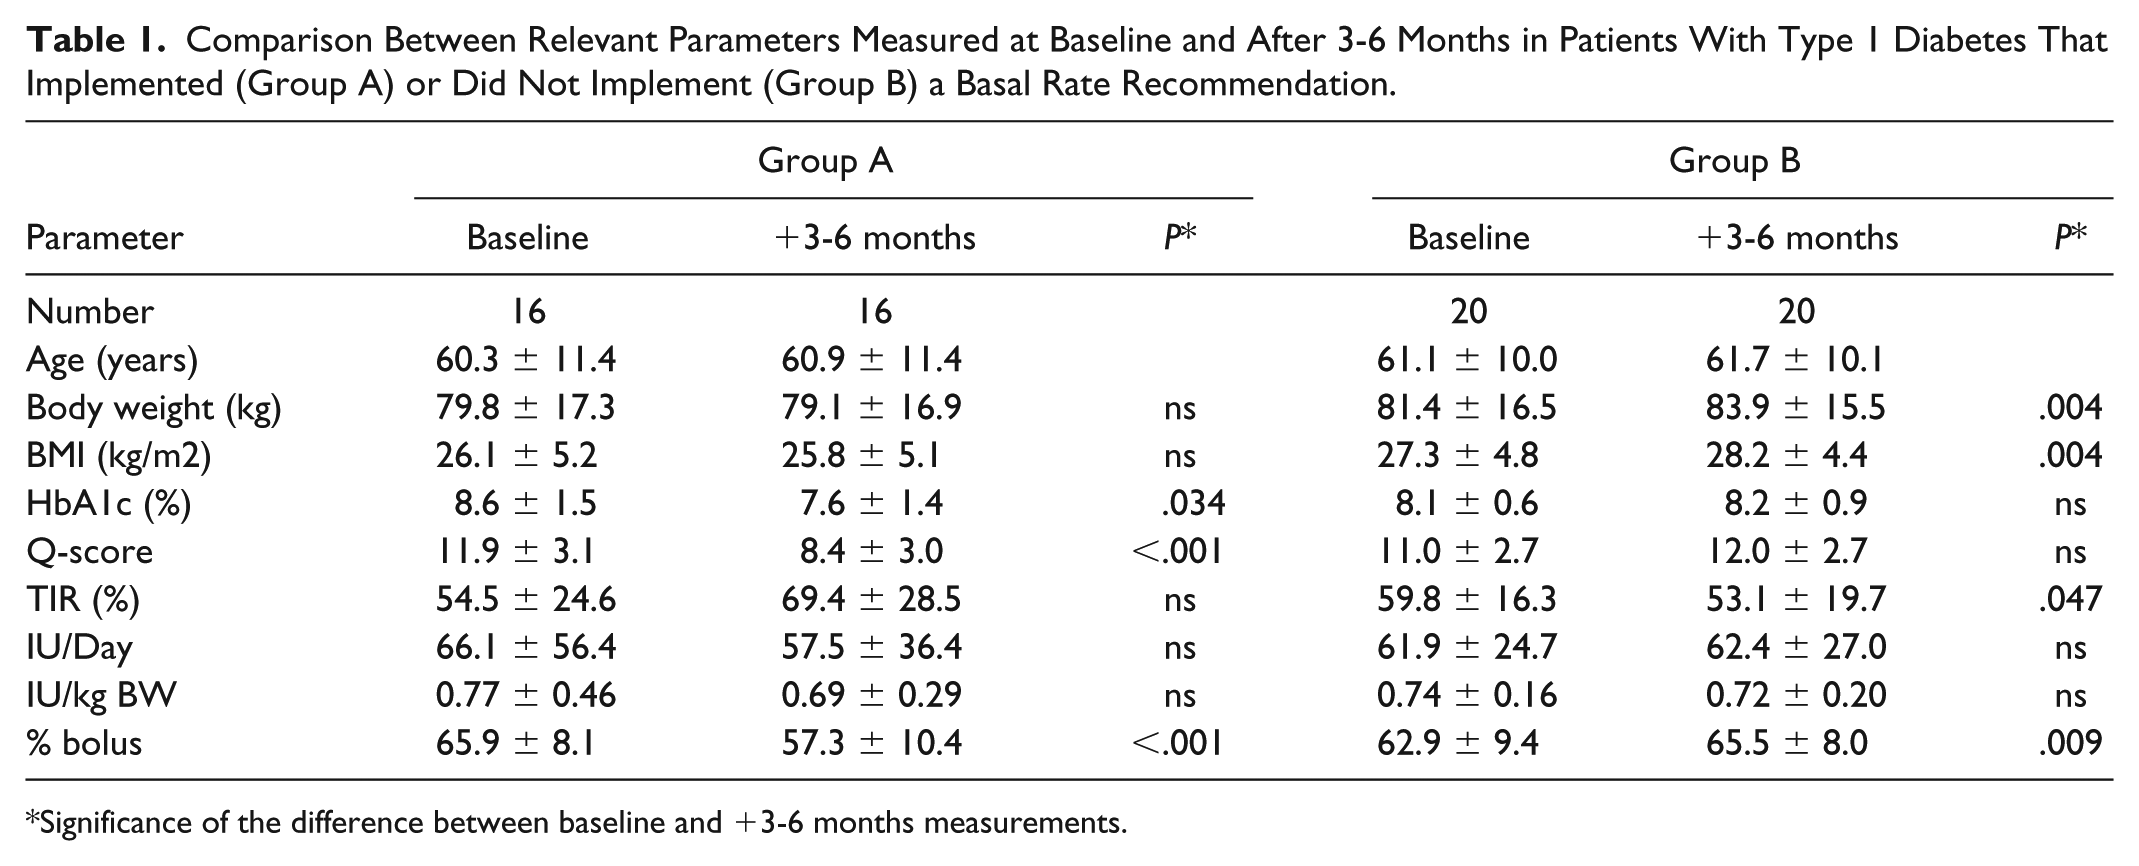
Significance of the difference between baseline and +3-6 months measurements.
Comparison Between Relevant Parameters Measured at Baseline and After 3-6 Months in Patients With Type 2 Diabetes That Implemented (Group A) or Did Not Implement (Group B) a Basal Rate Recommendation.
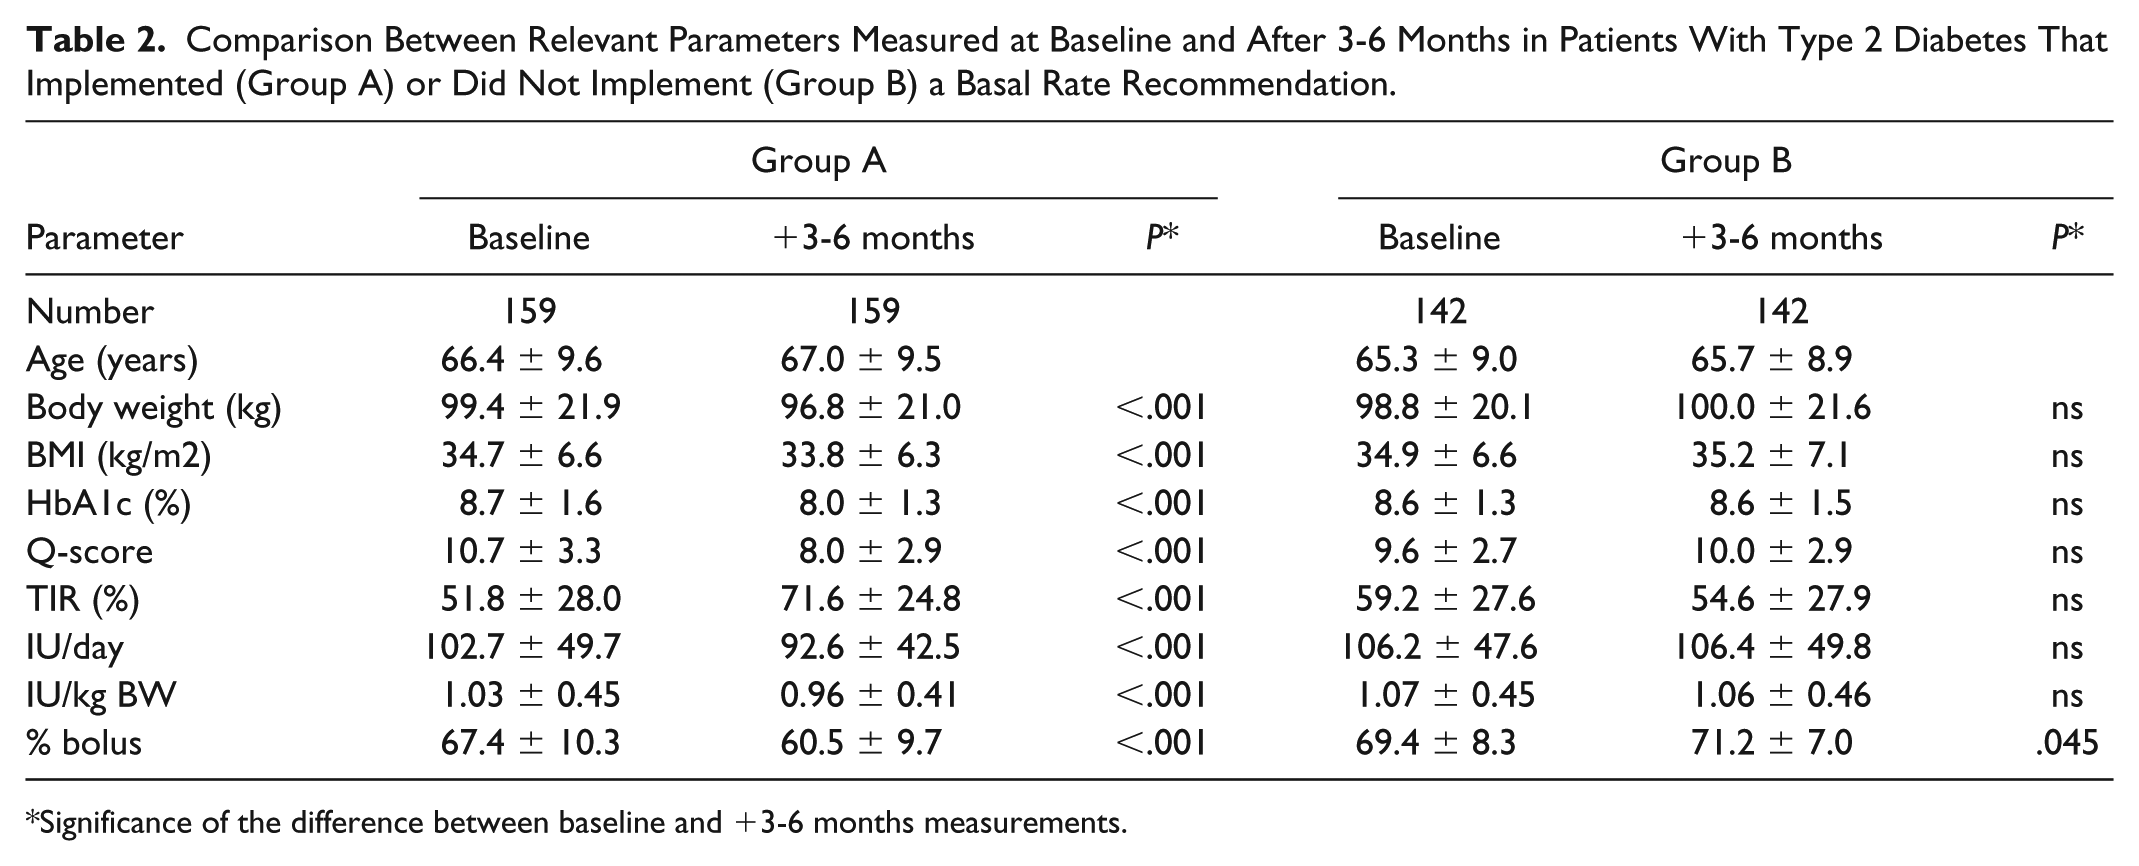
Significance of the difference between baseline and +3-6 months measurements.
The relatively low variance in the anamnestic parameters acquired in the first 3-day test (baseline) data showed no significant differences in age, weight, BMI, HbA1c, TIR, or insulin requirement between groups A and B, for both patients with diabetes type 1 and those with diabetes type 2.
After 3 months of implementing the basal rate recommendation (group A), significant reductions were observed in the HbA1c values and the Q scores for both types of diabetes. This was confirmed by an increase in the TIR values in both diabetes types, although this increase was only significant in type 2 diabetes. The basal rate optimization appeared to correlate with a change toward a greater balance in the ratio between the insulin bolus and the basal insulin. Among patients with type 1 diabetes (Table 1), in group A, the insulin bolus was 65.9% in the first 3-day test and 57.3% in the 3-day test performed at 3 months. In group B, neither the HbA1c values nor the Q scores changed significantly after 3 months without implementing the recommendation. Moreover, the TIR value increased in Group A and deteriorated significantly in Group B, from 59.8% to 53.1%. Finally, the daily insulin quantity was reduced in group A (type 1 diabetes: 66.1 vs 57.5 IU/Day; type 2 diabetes: 102.7 vs 92.6 IU/Day). In contrast, Group B showed a slight increase in daily insulin levels for both diabetes types (Tables 1, 2).
Among patients with type 2 diabetes (Table 2), group A showed significant reductions in both the HbA1c values and the Q scores (HbA1c: 8.7 % to 8.0 %; Q score: 10.7 % to 8.0 %). The TIR value improved significantly from 51.8% to 71.6%. The insulin bolus given in the ICT was also significantly reduced after 3 months from 67.4% to 60.5%. In contrast, Group B showed an increase in the Q score (9.2 to 10.7); the HbA1c value remained unchanged (8.6%); and the TIR value deteriorated (59.2% to 54.5%). However, the only significant change was the increase in the percentage of the insulin bolus. The daily amount of insulin delivered remained nearly unchanged (slight increase).
Discussion
Our findings indicated that the basal insulin action testing program (3-day test) and the personalized basal rate recommendation supported optimal metabolic management in both type 1 and type 2 diabetes. A comparison of groups A and B demonstrated that there was a significant correlation between the bolus:basal ratio and an improvement in metabolic control. Group A showed reductions in HbA1c and in the Q score and an increase in the TIR. As expected, these improvements were not observed in Group B. In particular, among patients with type 2 diabetes treated with ICT, the recommendations led to highly significant improvements compared to group B, which showed stable or worsened metabolic parameters and an unchanged or increased insulin bolus percentage in ICT. In addition, this study showed that adjusting the bolus insulin administration and the basal rate, based on the calculated metabolic fingerprint, led to a reduction of the daily insulin requirement in diabetes type 1, from 66.1 to 57.5 IU/Day, and to a highly significant reduction in diabetes type 2, from 102.7 to 92.6 IU/Day. On the other hand, in Group B, slight increases in daily insulin requirements were observed for both diabetes types. This finding was also supported by the changes in body weight (reduced in group A, increased in group B, both not significantly). 15 Therefore, our findings indicated that implementing a basal rate recommendation based on the metabolic fingerprint contributed significantly to the improvements in the metabolic parameters under consideration.
The starting point for the basal rate recommendation was to test the basal insulin effect. When the resulting calculated glucose profile was above the target range, a gradual increase in basal insulin led to reductions in glucose, which approached the target range. For these cases, the basal insulin was first increased. Next, the meals and bolus insulin doses were included in the calculations; then, the individual insulin bolus dose needed to be reduced or redistributed to bring the calculated glucose profile back to the target range. This procedure inevitably changed the bolus:basal insulin ratio to a more balanced ratio (close to 1:1). Our retrospective evaluation showed that this basal rate optimization was accompanied by a reduction in the daily insulin requirement and improved metabolic parameters (HbA1c, Q score, TIR).
This study had some limitations that should be considered. First, the study design was a retrospective evaluation (both groups). Thus, a diabetes specialist tested the basal insulin effect, prepared a basal rate recommendation, based on the model-generated metabolic fingerprint, and provided a report to the treatment teams. We retrospectively assigned patients to groups A and B; thus, unfortunately, no data were available to explain why the basal rate recommendation was or was not implemented. Moreover, we could not rule out the possibility that other parameters, unrelated to the basal rate recommendation, might have contributed to the improvements observed in Group A. Furthermore, the implementation of a therapy recommendation by the treating physician is always subject to the patient’s individuality and environment. These factors also influence the complexity of the therapy and the training status of the patient, because these factors contribute to how successfully the patient implements the therapy recommendation under everyday conditions. On the other hand, for the patients studied in this retrospective evaluation, we could assume that the two groups were highly unlikely to differ in the latter influencing factors (eg, therapy complexity, training status, and environment).
In adult patients with type 1 diabetes, an almost balanced ratio should be sought between dietary (bolus) and nonnutritional insulin (basal). Ratios of 60%:40% and 40%:60% are considered ideal. 16 These ratios are not readily achieved with ICT, due to the limits set by the pharmacodynamics of delayed insulin and the intraindividual day-to-day variability of insulin action. Changes in the insulin dose require an increase in the injection frequency and a shift in the time of injection. These changes are only feasible to a limited extent, and they require adjustments adapted to each individual. 17
Despite those limitations, the metabolic fingerprint model provided an appropriate means for determining an optimized insulin dosage, based on the individual’s metabolic parameters. The basal rate test could be carried out quickly and safely through telemedical support with smartphone apps, without great effort to the patient (a 3-day test, under everyday conditions, and common measurements). The results of this study confirmed the feasibility of this approach.
The metabolic fingerprinting model provided even greater benefits to patients with type 2 diabetes that required ICT in combination with GLP-1 and/or various oral antidiabetics. The metabolic effects of the various drugs were included in the model calculations, which provided a comprehensive picture of glycemic regulation in an individual patient.
Conclusion
We described an efficient modeling program for determining the optimal dosage of basal insulin. This program utilized a realistic basal rate test, performed under everyday conditions, which did not require stressful meal outlet attempts.
This retrospective evaluation compared patients with diabetes whose treatments did (group A) or did not (group B) incorporate a basal rate recommendation. We found that the basal insulin dosage used with ICT was often not optimal. In particular, the bolus:basal ratio was often incorrect under routine treatment conditions, which resulted in inadequate metabolic control. Patients attempted to compensate for the inadequate control, mainly by increasing the bolus insulin administration. However, that strategy resulted in an increased daily insulin dose, increased Q score values, and increased HbA1c, the main risk parameters for metabolic control and diabetes prognosis. In addition, the TIR deteriorated. This study showed that a telemedicine-supported test for determining the basal insulin effect and a basal rate recommendation, based on a metabolic fingerprint model, revealed an apparently underestimated potential for improving metabolic control, regardless of the diabetes type and other antidiabetic medications.
Footnotes
Abbreviations
BMI, body mass index; CGM, continuous glucose monitoring; CSII, continuous subcutaneous insulin infusion; DCC, Diabetes Service Center; DMP, disease management program; ICT, intensified conventional insulin therapy; KADIS, Karlsburger Diabetes Management System; MFP, metabolic fingerprint; SMBG, self-monitored blood glucose; TIR, time in range.
Declaration of Conflicting Interests
The author(s) declared no potential conflicts of interest with respect to the research, authorship, and/or publication of this article.
Funding
The author(s) received no financial support for the research, authorship, and/or publication of this article.