
Abstract
Background:
MARD (mean absolute relative difference) is increasingly used to describe performance of glucose monitoring systems, providing a single-value quantitative measure of accuracy and allowing comparisons between different monitoring systems. This study reports MARDs for the OneTouch Verio® glucose meter clinical data set of 80 258 data points (671 individual batches) gathered as part of a 7.5-year self-surveillance program
Methods:
Test strips were routinely sampled from randomly selected manufacturer’s production batches and sent to one of 3 clinic sites for clinical accuracy assessment using fresh capillary blood from patients with diabetes, using both the meter system and standard laboratory reference instrument.
Results:
Evaluation of the distribution of strip batch MARD yielded a mean value of 5.05% (range: 3.68-6.43% at ±1.96 standard deviations from mean). The overall MARD for all clinic data points (N = 80 258) was also 5.05%, while a mean bias of 1.28 was recorded. MARD by glucose level was found to be consistent, yielding a maximum value of 4.81% at higher glucose (≥100 mg/dL) and a mean absolute difference (MAD) of 5.60 mg/dL at low glucose (<100 mg/dL). MARD by year of manufacture varied from 4.67-5.42% indicating consistent accuracy performance over the surveillance period.
Conclusions:
This 7.5-year surveillance program showed that this meter system exhibits consistently low MARD by batch, glucose level and year, indicating close agreement with established reference methods whilste exhibiting lower MARD values than continuous glucose monitoring (CGM) systems and providing users with confidence in the performance when transitioning to each new strip batch.
Keywords
The ISO 15197:2015 standard 1 defines the clinical accuracy requirements for batches of test strips for self-monitoring of blood glucose (SMBG). The relative or absolute difference between individual blood glucose (BG) values and corresponding reference values (termed bias) is determined with the percentage of results within a predefined limit reported. While meeting this standard is a prerequisite for regulatory acceptance and release of product, SMBG strip manufacturers should also strive to minimize batch-to-batch variability, with product consistency aiding patients in judging treatment decisions and supporting effective management of their diabetes. 2 The mean bias of a batch is a widely used measure in this respect. 3
Recent years have seen significant growth in the use of continuous glucose monitoring (CGM) systems, with an alternative metric, MARD (mean absolute relative difference) used to assess clinical accuracy of these systems. 4 MARD is a specific measure of bias in which, unlike mean bias, the directional difference between paired values are not considered, that is, a relative difference of −5% is considered a 5% deviation. MARD may be used to define accuracy of individual or multiple sensors.
This study reports on an SMBG strip manufacturer’s extensive clinic data set, gathered routinely as part of an on-going self-surveillance program, for the OneTouch Verio® BG test strip. The data set comprises 80 258 clinical values gathered over a 7.5-year period from 3 clinic sites and reports metrics associated with the clinical accuracy, mean bias and mean MARD of this SMBG system. An assessment was also performed on the clinic performance of populations of strip batches drawn from different points within the batch MARD distribution. The evaluation of this clinical data set in terms of ISO performance is reported elsewhere. 5 This MARD assessment allows comparison of the clinical accuracy of the SMBG data set with the MARD of current CGM systems. A comparison of the MARD of this BGM system versus certain commercially available CGM systems is also discussed.
Methods
Test Strip Design and Routine Clinic Surveillance Testing
Details of strip design and clinic testing are reported elsewhere. 5 Test strips were manufactured by LifeScan Inc (Wayne, PA 19087), with all associated blood glucose measurement systems (BGMSs) meeting ISO 15197:2015 across the claimed glucose and hematocrit ranges of 20-600 mg/dL and 20-60% respectively. Sample volume is 0.4 µl, with a 5 second test time and the system reports plasma equivalent glucose values. Strip performance is routinely assessed at 3 UK clinic sites (ethics approved) with randomly selected representative production batches. Each strip batch was assessed on a minimum of 100 subjects within the claimed hematocrit range, all tests being performed by trained staff. Subjects may have visited a clinic site on more than 1 occasion over the 7.5-year evaluation and may be tested with >1 strip batch/visit, thus the clinical data set is not entirely composed of unique donors.
In all, 794 strip batches were tested at clinic, representing 671 individual batches, with 3.7% of batches routinely retested for ongoing surveillance of test variability. A total of 80 258 paired values were recorded, representing the entirety of the data obtained within this clinical surveillance assessment, with no qualifying measurements excluded. The software package R was used, providing full data traceability. 6
Reference Method
Reference glucose values were determined from a 200 µl capillary blood sample plasma fraction collected in a lithium-heparin Microvette. Samples were analyzed within 30 min. on two separate YSI 2300 STAT PLUS™ blood glucose analyzers (YSI; Yellow Springs Instrument Co Inc, Yellow Springs, OH). If meeting acceptance criteria, the mean of the duplicate YSI values were used.
Bias Calculation
Bias for a given pair of meter (test i) and corresponding reference value (YSI reference i) was calculated as:

or
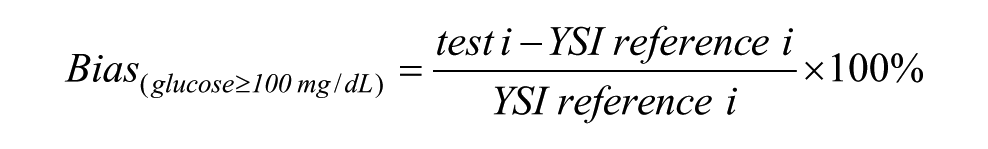
with overall individual batch mean bias calculated as the mean of the individual values. The mean bias of all batches was determined by averaging the individual batch mean bias values.
MARD and MAD Calculations
Absolute relative deviation (ARD) for a meter (test i) and corresponding reference value (YSI reference i) was calculated as:
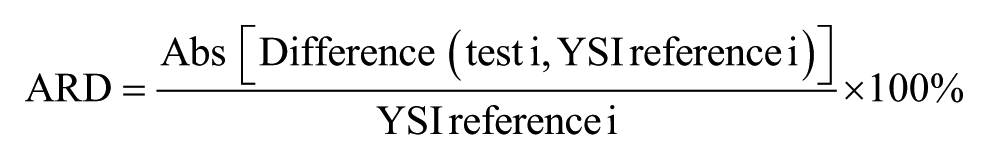
Mean absolute relative difference (MARD) from N paired test and reference values was then calculated as:

Absolute difference instead of ARD may be used at low glucose:
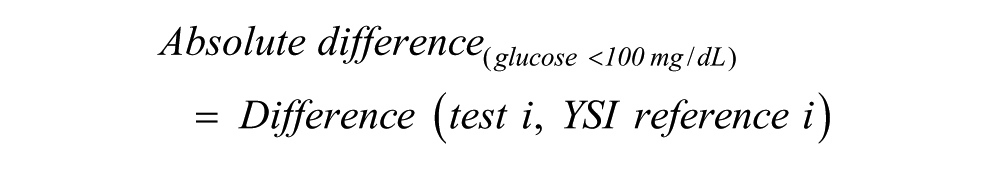
This allows derivation of mean absolute deviation (MAD). Thus, depending on the glucose levels present in a data set, values may be recorded as MAD (<100 mg/dL glucose), MARD (either ≥100 mg/dL glucose or all levels) or combined “MARD(MAD)” (all values).
MAD often replaces MARD at low glucose since lower glucose concentrations result in the relative differences in response between the test and reference method appearing more pronounced (recognized within ISO 15197:2015 which stipulates the use of mg/dL rather than percentage for assessing accuracy at low glucose (<100 mg/dL). Unless otherwise stated, reported MARDs are based on ARD values. The terms “overall” and “batch” in terms of MARD and MARD(MAD) refer to all data points within the clinical data set and a given strip batch respectively.
Results
Bias Distribution by Strip Batch
Figure 1 shows a density plot of the mean bias distribution of all batches. Mean batch bias was +1.28 with values of +4.85 and −2.28 recorded at ±1.96 SDs from the mean bias (dashed lines, Figure 1). This consistency of mean bias, is especially important from the perspective of a patient transitioning from one strip batch to another (eg, a new vial of strips). As described earlier, bias provides an alternative assessment of accuracy compared to the ISO 15197:2015 standard in which a minimum of 95% of individual values within a batch must be within ±15 mg/dL or 15% of reference at glucose levels of <100 mg/dL or ≥100 mg/dL respectively.
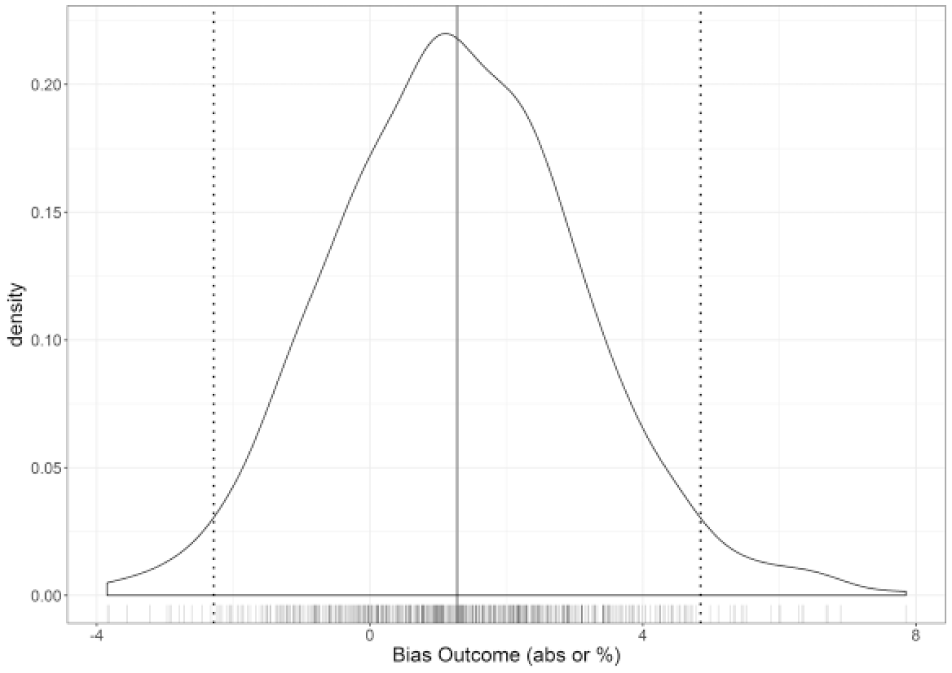
Bias density plot by sensor batch (absolute at G < 100 mg/dL; percentage at G ≥100 mg/dL). A mean batch bias of +1.28 (solid line) was recorded for all batches over the 7.5-year manufacturing period, with dashed lines indicating points ±1.96 standard deviations from mean.
MARD for Clinic Data Set
An overall MARD of 5.05% and an overall MARD(MAD) of 4.89 was recorded (Table 1). This difference, albeit small, highlights a complication in interpreting published MARD data, since different sources apply different criteria (MARD vs MARD(MAD)) and cutoff levels. The overall MARD of 5.05% provides end-users with quantitative evidence of the agreement between meter and reference values. Glucose values in the hypoglycemic range (≤70 mg/dL) 7 and <100 mg/dL yielded MAD values of 5.49 and 5.60 mg/dL, respectively, indicating that system performance at low glucose is in good agreement with the reference.
Clinic Data Set MARD and MAD Metrics Split by Glucose Concentration.
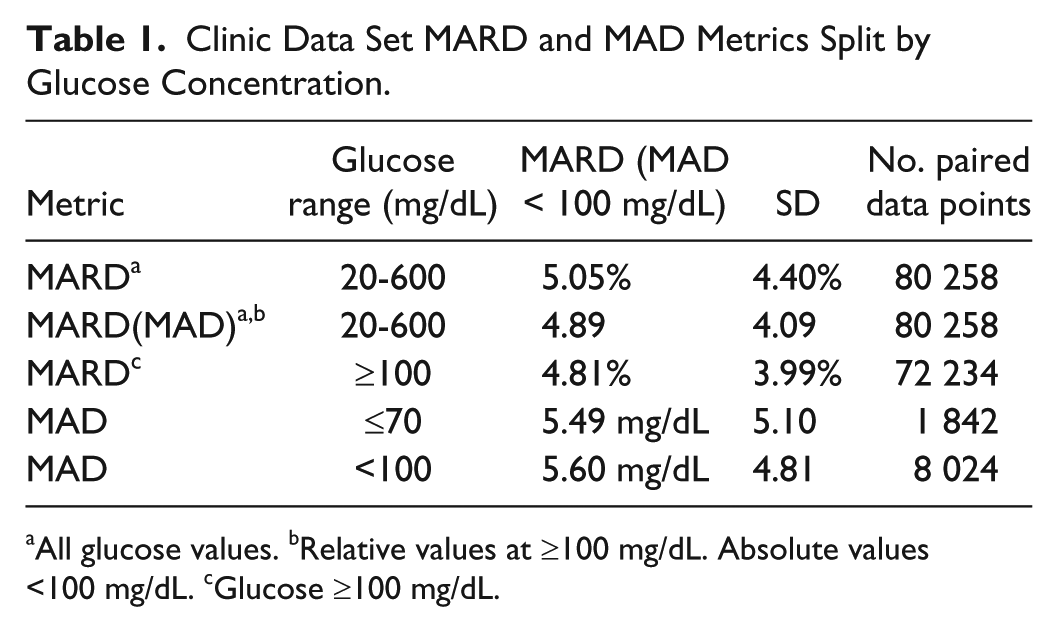
All glucose values. bRelative values at ≥100 mg/dL. Absolute values <100 mg/dL. cGlucose ≥100 mg/dL.
While many SMBG studies have previously been reported in terms of MARD,8-11 care must be given to interpretation. For example, Eklaspour et al 8 evaluated the MARD of 17 commercially available SMBG systems, reporting values of 5.6-20.8%. However, tests were based on manipulated venous whole blood samples, not fresh capillary blood. Systems were evaluated against a single reference instrument (YSI), whereas manufacturer’s products may be developed and calibrated against different reference instruments.
Overall MARD by Glucose Concentration
ISO 15197:2015 stipulates that the clinical accuracy of a system be assessed across 7 glucose concentration “bins”. While ISO 15197:2015 does not recognize MARD, it was of interest to determine the MARD and MARD(MAD) across these 7 bins (Table 2). For the higher glucose bins, MARD and MARD(MAD) were similar, at ~5% (~5mg/dL at <100 mg/dL). In the lower bins (#1, #2), MADs of 5.15 and 5.69 mg/dL were recorded. These data indicate that users should have confidence in the system for accurate determination of BG levels across a wide and physiologically relevant glucose range. This agrees with published data, for example Freckmann et al who evaluated 4 commercially available SMBG systems, including OneTouch Verio. They compared meter values to the manufacturer’s stated reference instrument, with capillary BG concentrations distributed in accordance with ISO 15197:2015, yielding overall MARDs of 4.8-8.9%. 12
Overall MARDs for the Full Clinic Data Set Split by ISO 15197:2015 Glucose “Bin” Levels.
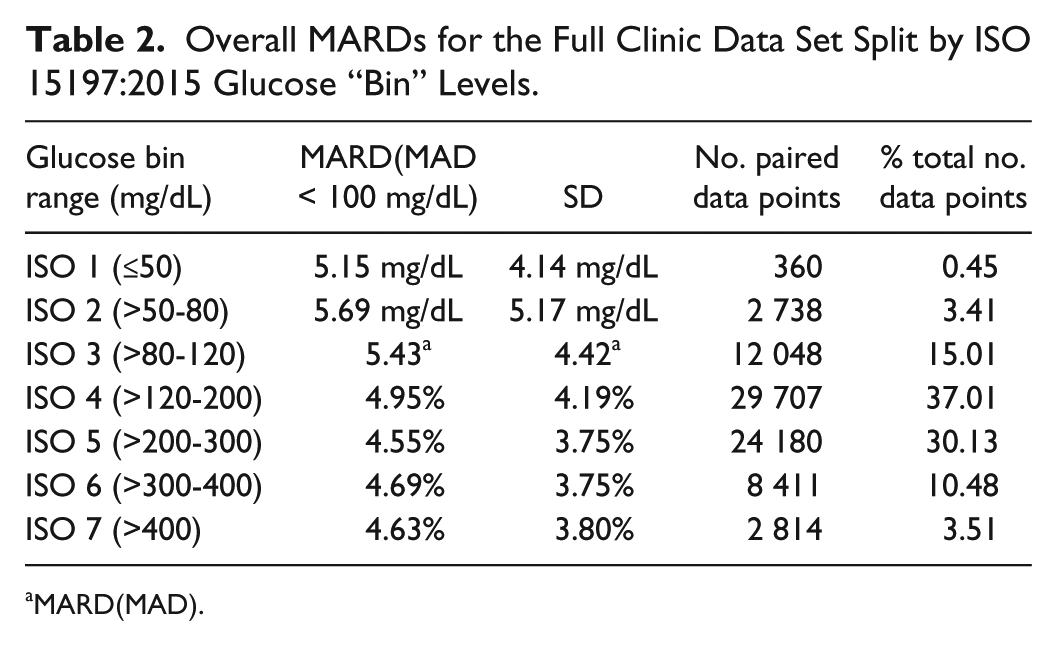
MARD(MAD).
MARD by Year of Manufacture
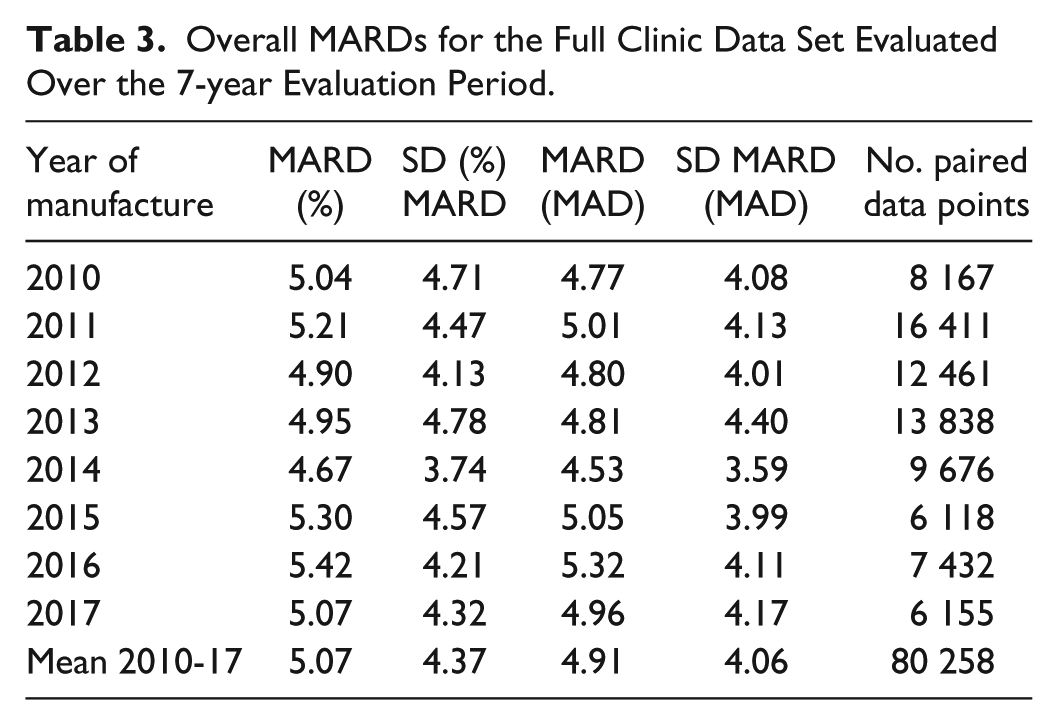
Over the 7-year surveillance period, overall MARDs varied from 4.67-5.42% with no apparent trend over time (Table 3). These data provide all stakeholders (users, manufacturers, regulatory bodies) with assurance that product clinical performance remains consistent over time.
Overall MARDs for the Full Clinic Data Set Evaluated Over the 7-year Evaluation Period.
MARD Distribution by Strip Batch
Distribution of MARD on a batch-by-batch basis may be considered a measure of the extent of product variation experienced by a user when transitioning between manufacturer’s strip batches. A histogram of strip batch MARD distribution indicates a mean batch MARD of 5.05% (Figure 2; coincident with the overall MARD) with batches distributed +1.96 and −1.96 SD from the mean having values of 6.43 and 3.68 respectively.
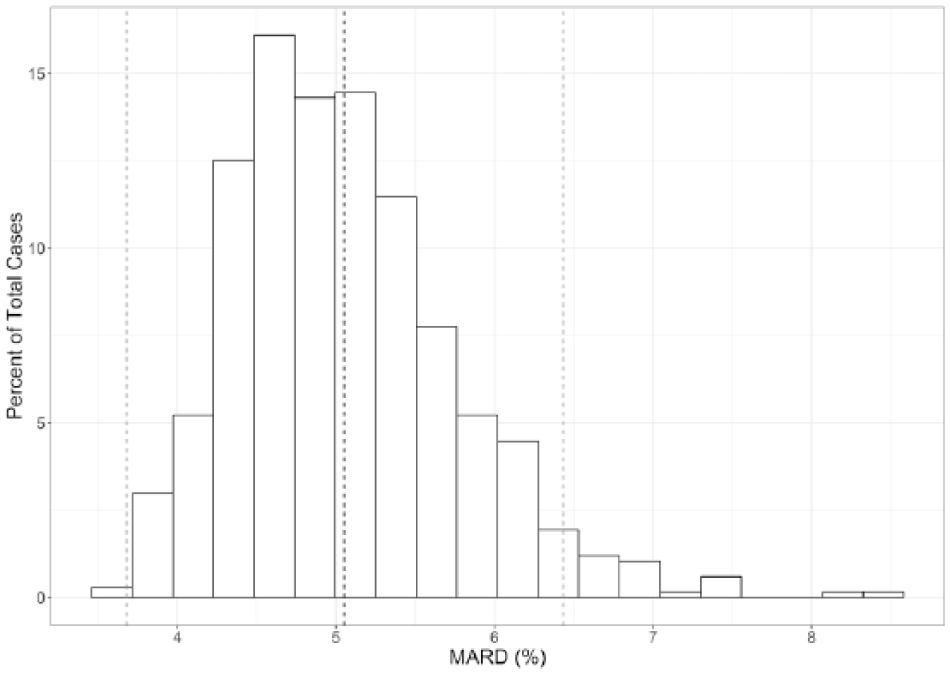
Histogram of MARD distribution by strip batch. Mean MARDs of 6.43% and 3.68% were recorded at points positioned +1.96 and −1.96 SD from mean MARD. Dashed lines represent the mean MARDs of these 3 populations.
Mean Bias Versus Mean MARD
A plot of mean bias versus MARD by batch is shown in Figure 3. A general trend of increasing MARD with increasing mean bias may be seen, but there are a substantial proportion of batches exhibiting low mean biases in relation to their respective MARDs. Furthermore, batches having a similar mean bias may exhibit a relatively wide range of MARDs, as exemplified by batches with a mean bias of ~0% exhibiting mean MARDs of ~3.5-6.0%. Similarly, for a given mean MARD, a wide range of mean biases are evident (batches with a mean MARD of ~5% exhibit mean biases of −3 to +3%) illustrating that these terms, while both being used widely as measures of accuracy, are not interchangeable and should not be confused. As a further example, Figure 3 shows 3 populations of OneTouch Verio strip batches, randomly selected from around the mean MARD (5.05%) and ±1.96 SD from mean MARD (square data points), with differences in batch mean biases between the 3 populations evident.
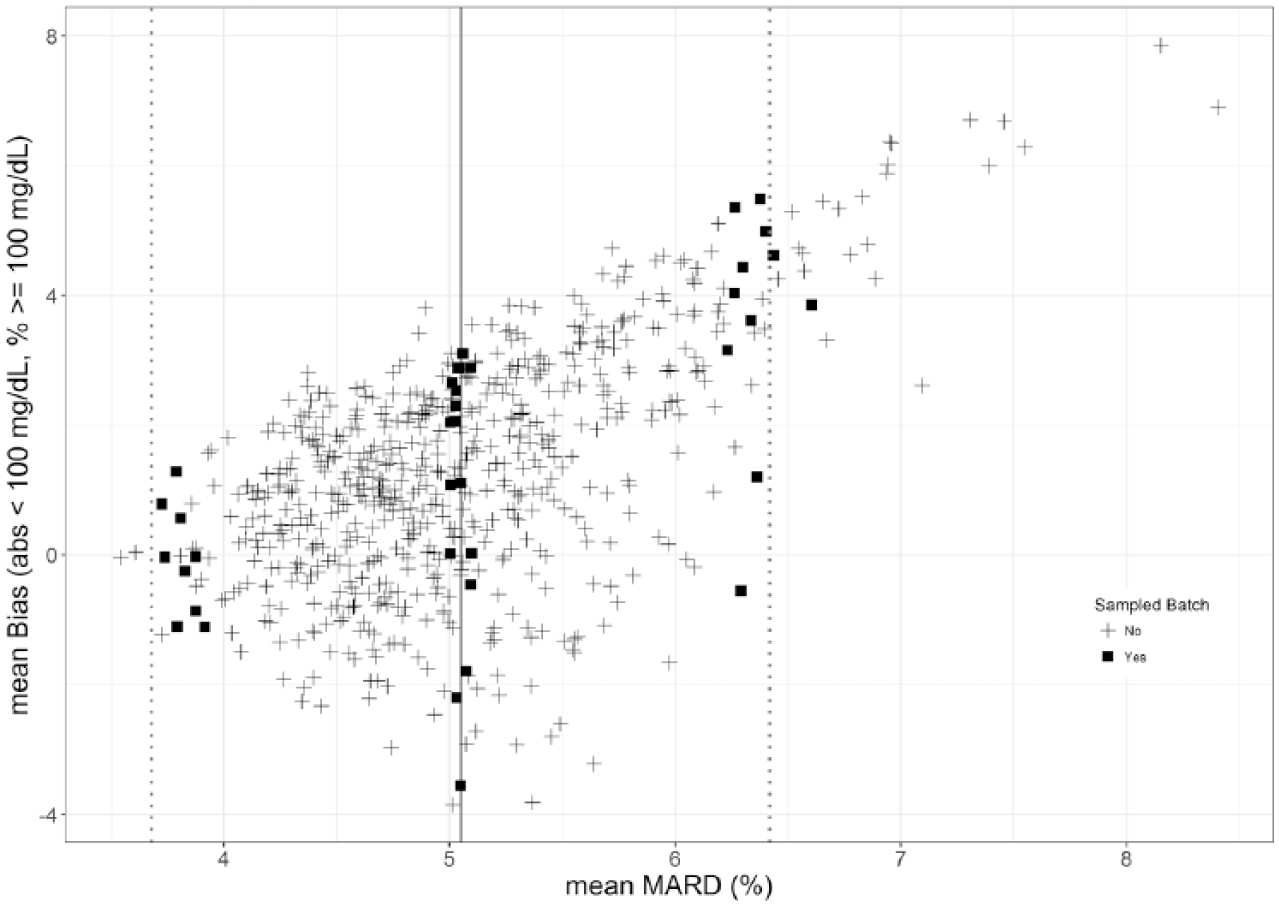
Mean bias versus MARD of all batches tested, superimposed with lines to denote mean MARD and points ±1.96 SDs from mean MARD. The square data points indicate batch populations, with representation from each year of manufacture, randomly selected from the 3 MARD regions and which were subject to further evaluation as described in the text.
Difference Plots
While the clinical testing of the randomly selected production batches reported here (n = 100 readings/batch) is different to the mandated ISO 15197:2015 system accuracy design (n = 600, 3 batches, testing in duplicate, filling of 7 glucose bins), it is nevertheless of interest to evaluate the performance of the 3 strip batch populations (mean MARD and ±1.96 SD from mean MARD) against the standard. Difference plots showing the agreement of individual values against corresponding reference values within the 3 populations are shown in Figure 4. Dashed lines denote accuracy limits as per ISO 15197:2015. Mean differences of these populations to reference is denoted by the solid horizontal lines, with ISO 15197:2015 clinical accuracy values of 99.64%, 97.55% and 95.04% for lower, mid and upper MARD respectively.
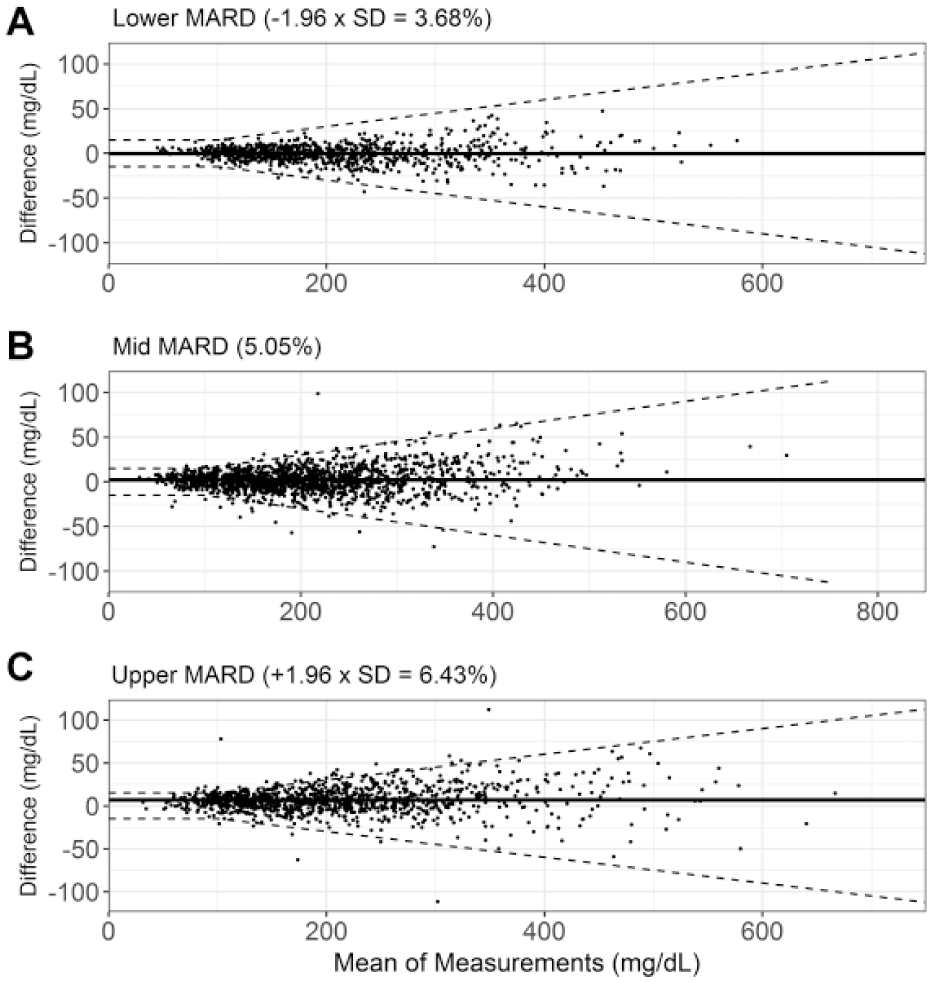
Difference plots for representative strip batches selected from (a) mean MARD; (b) +1.96 SD MARD; (c) −1.96 SD MARD. Limits denote the ISO 15197:2015 system accuracy limits (±15 mg/dL for reference glucose <100 mg/dL and ±15% for reference glucose ≥100 mg/dL). Solid line denotes mean difference of batch population.
Strip Batch MARD and Consensus Error Grid Performance
Plotting the individual data points for the 3 strip populations on the consensus error grid (CEG; Figure 5), shows that use of strips from the upper MARD population does not result in a loss in clinical safety (upper MARD: 99.57% A zone, 0.28% B zone, 0.14% C zone 99.86% A+B zone; mid MARD: 99.40% A zone, 0.60% B zone, 100.00% A+B zone; lower MARD: 99.86% A zone, 0.14% B zone; 100.00% A+B zone). The mean MARD, −1.96 SD and +1.96 SD MARD populations exhibited slopes of 1.01, 0.99, and 1.01 respectively. The lower MARD batch population yielded a bias intercept value of 0.87 mg/dL, compared to −0.50 mg/dL and 4.61 mg/dL for the mean MARD and upper MARD populations, respectively. The performance of these randomly selected manufactured batches are therefore not adversely affected, despite representing the extremes of MARD distribution within this diverse clinic population.
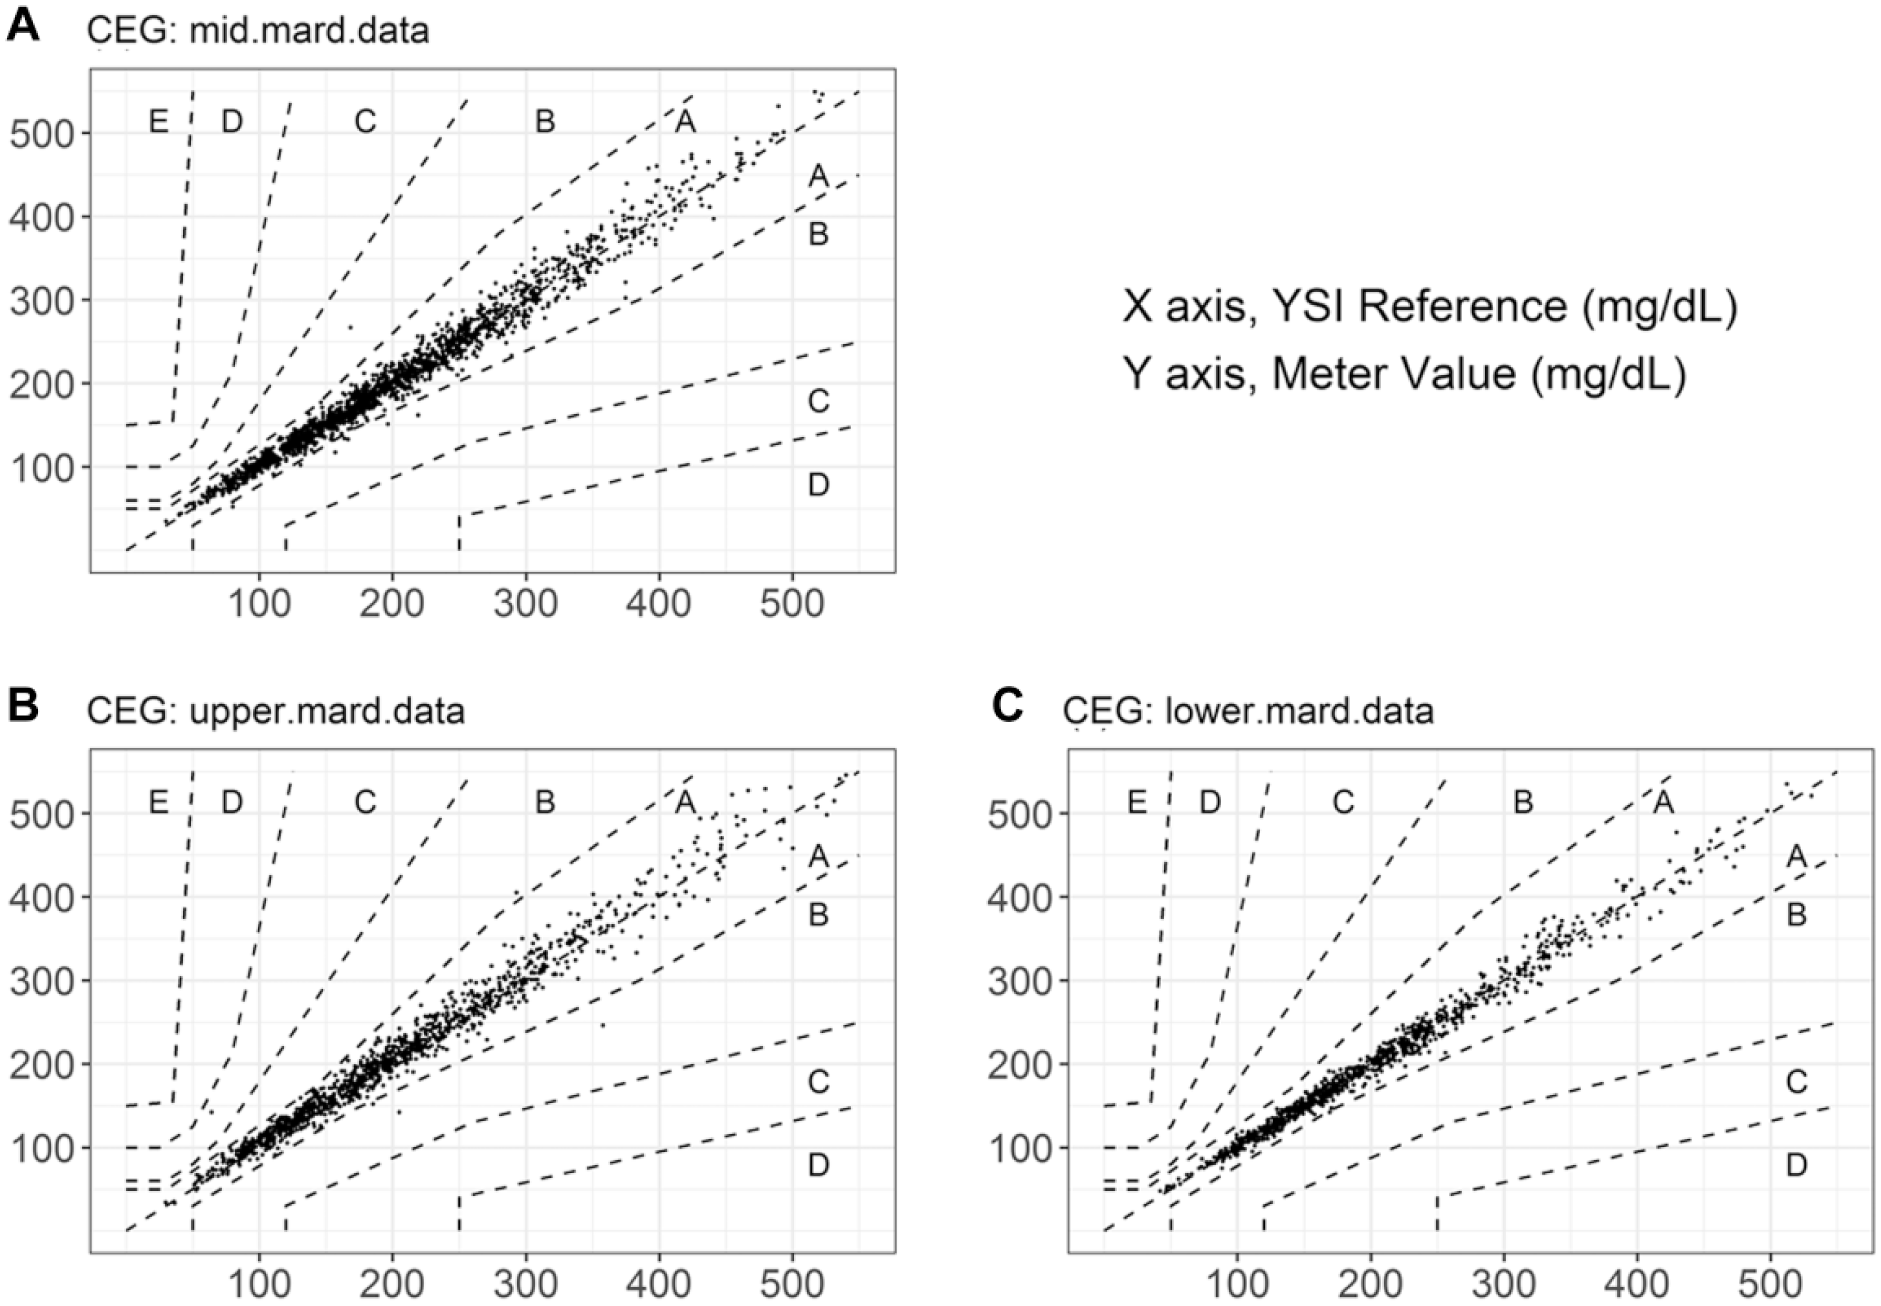
CEG plots for all paired data values from representative strip batches selected from populations representing (a) mean MARD; n = 1670, y = 1.01x − 0.50, R2 = .98; (b) +1.96 SD MARD; n = 1404, y = 1.01x + 4.61, R2 = .97; (c) and −1.96 SD MARD; n = 1405, y = 0.99x + 0.87, R2 = .99.
Discussion
There is little published batch MARD distribution data for SMBG systems, since most studies are limited, focusing on the evaluation of a single or small number of batches. While such studies may provide quantitative “within-batch” MARD, there is little reported “between-batch” MARD. This is important from the perspective of the manufacturer who, when producing BG strip batches, should strive to maintain process conditions and material inputs to deliver both within-batch and between-batch consistency. The on-going production of multiple batches over many years, where variations in process conditions and materials, coupled to the maintenance and improvement of production equipment all have potential to influence produce performance. In this context, the study presented here provides in-depth information regarding the consistency of an SMBG product manufactured over multiple years.
This data set demonstrates that the SMBG system exhibits consistently low MARD by batch and by glucose level over a surveillance period of 7.5 years. Increasing numbers of studies are now using MARD to compare the clinical accuracy of SMBG systems.10,12-16 Pardo and Simmons, 17 recognizing the non-interchangeability of ISO and MARD, developed a Bayesian model to define an acceptable MARD in terms of meeting ISO accuracy criteria. They concluded a near 100% chance of satisfying ISO 15197:2015 if MARD values are between 3.25-5.25% (overall MARD in this study: 5.05%).
Bedini et al 13 conducted an SMBG accuracy study on 3 strip products to model hypothetical insulin dosing errors due to system inaccuracy. Potential dosing differences were identified depending on the MARD value of the system, prompting the authors to comment that insulin dosing errors are of high clinical significance as they may be compounded over time since modification of insulin dosing may occur consecutively and multiple times per day. 18 Therefore, the need for all diabetes BG measurement systems, whether SMBG or continuous glucose monitoring (CGM), to demonstrate low MARD should be a key expectation of users and product performance criterion.
While MARD is increasingly quoted for comparing SMBG systems, there are limited reports of batch-to-batch differences in individual SMBG products. Baumstark et al 2 investigated the performance of 4 batches from 5 separate SMBG systems using an ISO-like system accuracy test design. They found significant differences in relative bias calculated per Bland-Altman with maximum batch-to-batch differences varying from 1.0-13.0%. 19 The authors conclude that manufacturers should regularly check strip batch-to-batch differences to minimize risk of false treatment decisions. By contrast, we have provided data describing accuracy performance across 671 individual strip batches with mean batch biases of −2.28 and +4.85 recorded at ±1.96 SDs from the mean bias.
Similarly, there are also limited studies reporting MARD distributions for CGM sensors. This is equally important to CGM users when transitioning to a new sensor, where between-sensor differences may potentially hinder optimum diabetes management. Freckmann et al 20 conducted a study on 3 CGM systems in which subjects wore 6 sensors in parallel (2 sensors from each system) to compare sensor-to-sensor differences. They calculated precision absolute relative difference (PARD), that is, sensor-to-sensor MARD, to express performance differences between the sensor pairings, yielding values of 10.1-18.1%.
MARD distribution by sensor has been reported by Bailey et al. 21 for the factory-calibrated Freestyle Libre system. Evaluation was based on 72 subjects each wearing 2 systems for up to 14-days, yielding n = 13 195 BG/sensor and n = 12 172 YSI reference/sensor paired results (equivalent to an average of 92 MARD values per sensor, comparable to the 100 values gathered for each BG strip batch in clinic). An overall MARD of 11.4% was recorded, but in terms of distribution, the range of sensor to sensor MARDs observed was ~5 to 23%.
Libre product labeling claims a 14-day sensor wear (CE approval) with a lesser 10-day sensor wear approved for the US by the FDA. Test strips packaged in vials of, for example, 50 strips, may be consumed within a similar 10 or 14-day time-frame by high frequency testers (3.6 strips/day). In this respect, a single Libre sensor may be equated with a 50-strip vial in terms of number of tests performed before a sensor is replaced or a new strip vial opened. Based on our 7.5-year surveillance data, a user, making a transition to a new vial of strips may reasonably expect a maximum mean MARD “shift” of 2.75% (6.43-3.68%; ±1.96 SD) when moving to a new strip batch (based on 671 batches) compared to up to an ~18% MARD shift when users switch to a new Libre sensor (based on 144 sensors). It may also be noted that the Libre system remains reliant on the use of SMBG systems, given Libre CE indications for use require users to perform BG testing (1) to confirm the accuracy of sensor hypo/hyperglycemia readings; (2) when inconsistencies between symptoms and BG reading are apparent; and (3) in times of rapidly changing glucose (primarily a physiologic rather than a sensor design/performance factor).
Similarly, Dexcom claim a 9.0% overall MARD for the G5 Mobile CGM versus YSI reference and 11.3% during home use versus a BG meter, (51 subjects, 7-day study, x2/day calibration; G4 Platinum CGM system using G5 mobile software).22,23 Paired G5/YSI readings yielded sensor to-sensor MARDs of between 4 and 26%. These data indicate considerable levels of sensor to sensor variability that may be encountered by individual users as they transition to each new sensor.
Furthermore, Medtronic recently released the MiniMed 670G hybrid closed loop system, incorporating the Guardian Sensor 3, demonstrating an overall MARD of 10.55% based on an SMBG calibration every 12 hours. 24 FDA documentation 25 reports MARD within discrete glucose bins, although differing to those defined in ISO 15197:2015 (Table 2), yielding values of 17.03 mg/dL, 7.96 mg/dL, and 9.58% at <40 mg/dL, 40-60 mg/dL, and 351-400 mg/dL glucose, respectively. Overall MARD was reported for the claimed glucose range 40-400 mg/dL and as MAD at ≤80 mg/dL. An overall MARD value of 9.64% was recorded when SMBG calibrations were performed 3-4 times/day. No data regarding sensor-to-sensor MARD variability for the Medtronic Guardian Sensor 3 were found.
Pardo et al., 26 among others, have argued that the use of MARD alone is insufficient in describing the performance characteristics of CGM systems, proposing a new method to more completely characterize sensor performance. By constructing a probability versus MARD plot, they showed that a given CGM MARD can potentially encompass a wide performance range. They quote an example of a CGM system with a MARD of 12% where CGM values were predicted to be within 5% of the reference only 10-25% of the time. They caution that using MARD as a single measure of performance for CGM is insufficient and may lead to incorrect conclusions.
Conclusion
This study reports MARDs for SMBG test strips for a manufacturer’s clinical data set of 80 258 data points, gathered over a 7.5-year surveillance period. An overall MARD of 5.05% was recorded, consistent with values reported for other market-leading SMBG systems. However, the robustness of the reported MARDs for other SMBG systems may be constrained by: limited number of batches evaluated; possibility that batches were manufactured at a similar point in time, thus not reflecting differences in performance due to raw material lot changes; and potentially compromised by choice of reference instrumentation. Consequently, the mean batch MARD of 5.05% (range 3.68-6.43%) recorded in this surveillance program has no comparison in the literature, despite such information being important for control of BG for people with diabetes.
Comparing the MARD distribution of this SMBG system in this surveillance program to that of marketed CGMs demonstrates superior SMBG clinical accuracy to any CGM, both in terms of overall MARD, and batch-to-batch (strip), versus sensor-to-sensor (CGM) MARD. While concerns have been raised regarding the batch-to-batch variability of SMBG systems having an impact on the reliability of BG measurements and thus the impact on therapeutic decisions and achievement of glycemic goals, so health care professionals should weigh up the benefits of trend data alongside the greater variability in the accuracy of CGM systems with respect to informing optimal therapeutic decision-making. As a minimum, batch-to-batch (SMBG) and sensor-to-sensor (CGM) differences should be evaluated and reported by all manufacturers to minimize the risk of erroneous therapeutic decision making and ensure greater transparency when comparing glucose monitoring systems. These factors are also important from the perspective of building confidence in disease self-management for people with diabetes.
Footnotes
Acknowledgements
The authors would like to thank the staff at each clinic location for performing the required clinical procedures.
Abbreviations
Abs, absolute; ARD, absolute relative difference; BG, blood glucose; BGM, blood glucose measurement; CEG, consensus error grid for type 1 diabetes; CGM, continuous glucose monitoring; ISO, International Organization for Standardization; MAD, mean absolute difference; MARD, mean absolute relative difference; SD, standard deviation; SMBG, self-monitoring blood glucose; YSI, yellow springs instruments.
Declaration of Conflicting Interests
The author(s) declared the following potential conflicts of interest with respect to the research, authorship, and/or publication of this article: SS, SM, MG, and RD are full-time employees of LifeScan Scotland Ltd. BL is a full-time employee of LifeScan Inc.
Funding
The author(s) disclosed receipt of the following financial support for the research, authorship, and/or publication of this article: This work was funded by LifeScan Scotland Ltd.