
Abstract
Background:
Glucose values of continuous glucose monitoring (CGM) have time delays compared with plasma glucose (PG) values. The artificial pancreas (STG-55, Nikkiso, Japan) (AP), which measures venous blood glucose directly, also has a time delay because of the long tubing lines from sampling vessel to the glucose sensor. We investigate accuracy and time delay of CGM and AP in comparison with PG values during 2-step glucose clamp study.
Methods:
Seven patients with type 2 diabetes and 2 healthy volunteers were included in this study. CGM (Enlite sensor, Medtronic, Northridge, CA, USA) was attached on the day before the experiment. Hyperglycemic (200 mg/dL) clamp was performed for 90 minutes, followed by euglycemic (100 mg/dL) hyperinsulinemic (100 μU/mL) clamp for 90-120 minutes using AP. CGM sensor glucose was calibrated just before and after the clamp study. AP and CGM values were compared with PG values.
Results:
AP values were significantly lower than PG values at 5, 30 minute during hyperglycemic clamp. In comparison, CGM value at 0 minute was significantly higher, and its following values were almost significantly lower than PG values. The time delay of AP and CGM values to reach maximum glucose levels were 5.0 ± 22.3 (NS) and 28.6 ± 32.5 (P < .05) min, respectively. Mean absolute rate difference of CGM was significantly higher than AP (24.0 ± 7.6 vs 15.3 ± 4.6, P < .05) during glucose rising period (0-45 min); however, there were no significant differences during other periods.
Conclusions:
Both CGM and AP failed to follow plasma glucose values during nonphysiologically rapid glucose rising, but indicated accurate values during physiological glucose change.
Keywords
The accuracy of glucose monitoring is important to control blood glucose in patients with diabetes. Continuous glucose monitoring (CGM) measures subcutaneous interstitial fluid glucose concentrations, and it is available in many countries. The overall accuracy of CGM depends on the sensor, the reference blood glucose concentrations used for calibration, and the calibration algorithm. 1 Because blood glucose is diffused to interstitial tissues, the interstitial glucose value is reported to be delayed approximately 10 minutes than plasma glucose (PG). 2 However, it was also reported that Enlite sensor (Medtronic, Northridge, CA, USA) provided accurate data at different glucose concentrations and rates of change. 3 Enlite sensor in combination with iPro2 (Medtronic, Northridge, CA, USA) is not a real-time (unblinded) CGM, but a retrospective (ie, blinded when wearing) CGM. iPro2 CGM was designed to show data after the maximum of 7 days of wearing, and the data were adjusted mathematically using reference fingerstick glucose values.
The artificial pancreas (AP) STG-55 (Nikkiso CO, LTD, Tokyo, Japan) is a device for the evaluation of glucose metabolism and the management of critically ill patients.4,5 AP measures venous blood glucose directly, but it also has a time delay because of a long tubing line (1.0 m) from sampling vessel to the glucose sensor. To date there are no reports that have compared subcutaneous continuous device with an intravenous continuous device at various glucose values.
The aim of the study is to investigate accuracy and time delays of CGM and AP in comparison with PG during acute rising (20 mg/dL/min) to hyperglycemic and euglycemic glucose clamp conditions.
Methods
Seven patients with type 2 diabetes and 2 healthy volunteers were included in this study. We performed 10 tests of experiment: 8 subjects were studied once and 1 subject was studied twice. This study protocol was approved by the Tokushima University Institutional Review Board (#1598) and was in compliance with the World Medical Association’s Declaration of Helsinki. All subjects gave written informed consent. The characteristics of subjects are shown in Table 1.
Characteristics of Subjects.
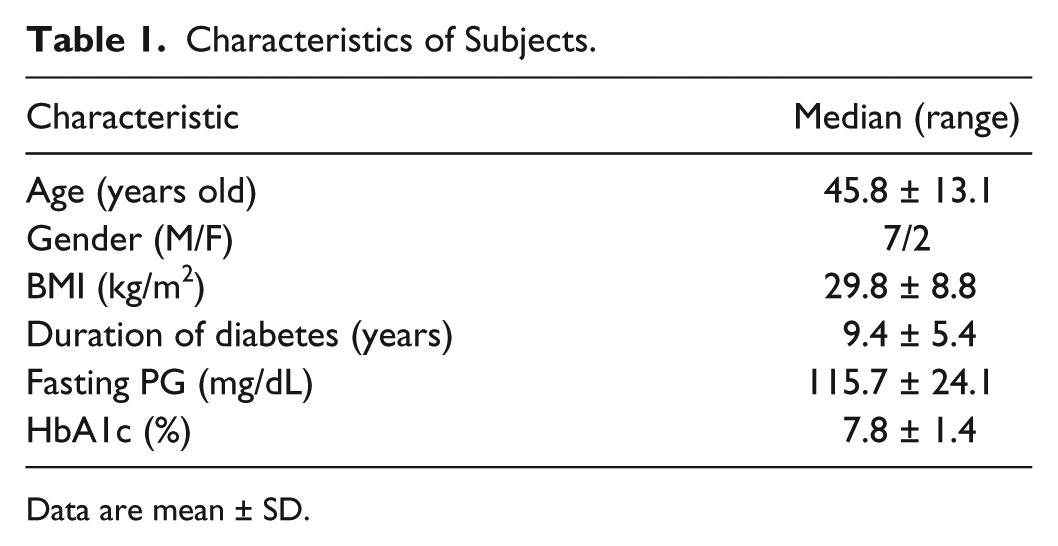
Data are mean ± SD.
CGM (Enlite sensor, Medtronic, Northridge, CA, USA) was attached on the day before the experiment. CGM sensor glucose values were calibrated with venous blood glucose measurement by a point-of-care glucose analyzer IVD, GLUTEST MINT (Sanwa Kagaku Kenkyusho, Kyoto, Japan) just before and after the clamp study. AP system was also calibrated just before the experiment according to the manufacturer’s instruction.
After overnight fasting, antecubital vein was cannulated with three catheters in each subject. The first catheter was inserted for venous sampling, the second one was for the infusion of glucose, and the third one was for the insulin infusion. Two catheters were connected to the intravenous continuous glucose monitor of AP and infusion. The total volume of the tubing is 0.9 mL, and the rate of flow is approximately 0.2 mL/min depending on the body weight and blood glucose concentration. STG-55 monitors blood glucose levels using a dual-lumen catheter and a glucose sensor electrode with a glucose oxidase method. Before starting the procedure, two-point internal calibration of AP was performed using two standard solutions (glucose concentration, 0 and 200 mg/dL).
We designed our study with basically the same protocol as our previous report (Gorogawa et al), 6 which was modified from the original report by DeFronzo et al. 7 Hyperglycemic clamp was performed for 90 minutes, followed by euglycemic hyperinsulinemic clamp for 90-120 (90-180 or 210 from the beginning) minutes using AP (Figure 1). In detail, infusion of 20% glucose solution was started to raise blood glucose from fasting state to 200 mg/dL within 5 minutes and was followed by hyperglycemic clamp. Soon after hyperglycemic clamp procedure, primed-constant infusion of insulin (starting from 4.62 to 1.45 mU/kg/min) and computer-controlled exogenous infusion of 20% glucose solution were started to achieve the desired steady-state plasma insulin concentrations (100 μU/mL) and to maintain blood glucose levels (100 mg/dL) during euglycemic hyperinsulinemic clamp. 8 PG values were recorded every 5 minutes for the first 15 minutes, and thereafter every 15 minutes during the study period. AP and CGM values were retrospectively analyzed. The time to reach maximum glucose value was recorded during hyperglycemic clamp period. Hyperglycemic clamp was divided into the CGM glucose rising period (“rising period”) and 60-90 minutes as the “hyperglycemic plateau period.” Euglycemic hyperinsulinemic clamp was divided into 90-150 minutes as the “falling period” and 150-180 or 180-210 minutes as the “euglycemic period.” AP and CGM values were compared with PG values using Parkes consensus error grid for type 1 diabetes 9 during the study period. Because the error grid analysis judged the quality of the approximation of reference BG from readings taken at isolated static points in time, regardless of the temporal structure of the data as reported by Kovatchev et al.10 The error matrix, which combines rate error grid analysis zones and point error grid analysis zones, in each period of AP and CGM were calculated according to Kovatchev et al. 10
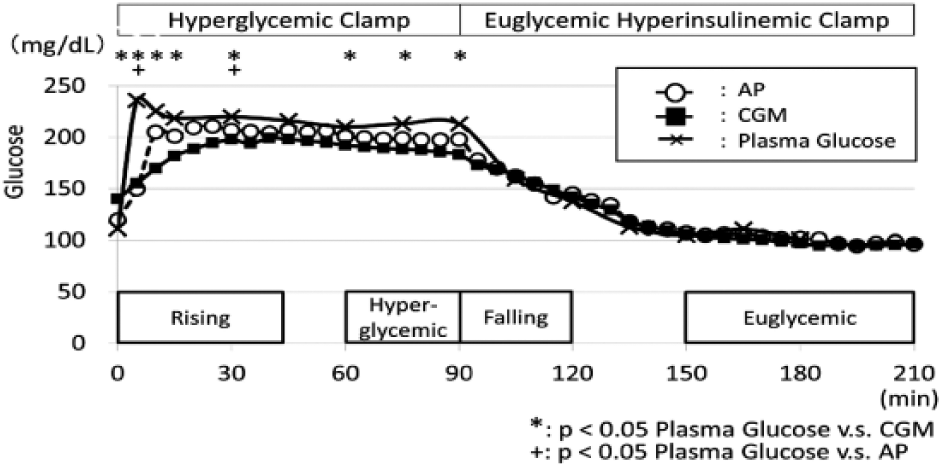
Two-step clamp. Hyperglycemic clamp (200 mg/dL), followed by hyperinsulinemic (100 μU/mL) euglycemic (100 mg/dL) clamp was performed and the average glucose values of 10 experiment were shown. The reference blood glucose values for CGM were done just before and after the clamp study.
A comparison of mean absolute rate difference (MARD [%]) of glucose values with PG between AP and CGM in each period was calculated as previously reported. 11
Plasma insulin levels were measured in the laboratory of Tokushima University Hospital using the fluorescence-enzyme immunoassay procedure (Tosoh Corp, Tokyo, Japan).
Statistical Analysis
Glucose values were not normally distributed; they were analyzed using nonparametric tests. Glucose values of CGM and AP were compared with PG values using nonparametric Mann-Whitney U tests. The differences in glucose values of each clamp period of CGM, AP, and PG values were evaluated using one-way repeated-measures ANOVA, with Bonferroni-Holm-adjusted post hoc tests for multiple comparisons. P values of less than .05 were considered statistically significant. Statistical analyses were performed using SPSS software version 21 (SPSS, Chicago, IL, USA).
Results
Seven patients with type 2 diabetes and 2 healthy volunteers were enrolled in this study. PG values between these patients and volunteers were similar at fasting state and during hyperglycemic clamp in our study.
AP values were significantly lower than PG values at 5 minutes (AP: 141.1 [median 134.1] vs PG: 233.9 [235.5] mg/dL, P < .0001) and 30 minutes (AP: 141.1 [median 134.1] vs PG: 233.9 [235.5] mg/dL, P < .05) during hyperglycemic clamp (Figure 1). In comparison, CGM value at 0 minutes was significantly higher, and its following values except 45 minutes were significantly lower than PG values (CGM: 135.2 [125.5] vs PG: 108.4 [101.0] mg/dL, P < .05) (Figure 1). The CGM glucose values rose until 45 minutes during the hyperglycemic clamp period; therefore, we defined the 0-45 minute period as the rising period. As evaluated with one-way ANOVA, AP and CGM values during the rising period and hyperglycemic period were significantly lower than PG values (Table 2). CGM values during hyperglycemic plateau period were significantly lower than PG values (Table 2).
One-way ANOVA Analysis of CGM, AP, and PG During Each Period.
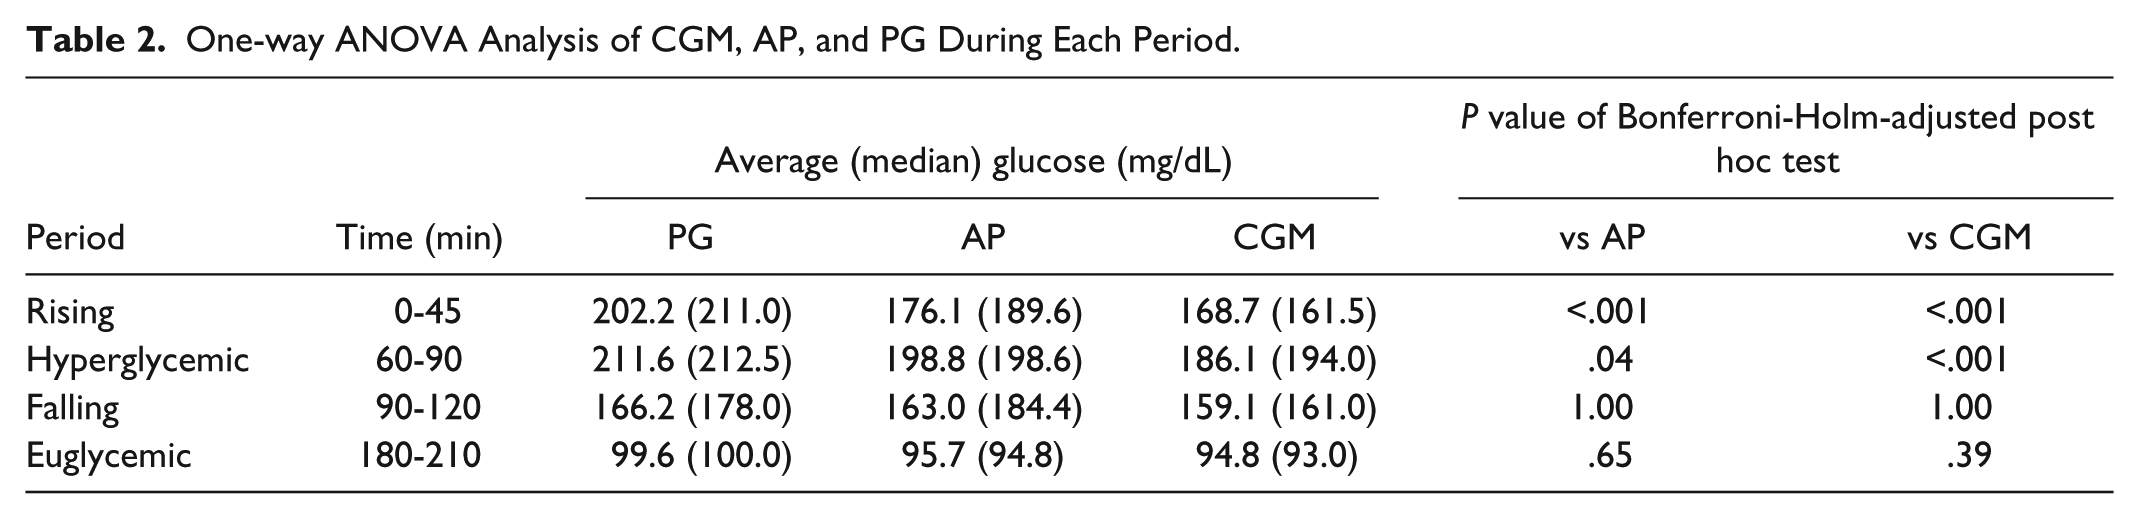
AP, CGM, and PG values were not different between these groups during the falling period and euglycemic plateau period (Table 2). The time delays of AP values to reach maximum glucose levels were comparable with PG values and the time delays of CGM values to reach maximum glucose levels were significantly higher than PG values (Table 3).
Comparison of Time to Reach Maximal Glucose During Hyperglycemic Clamp Among PG, AP, and CGM.
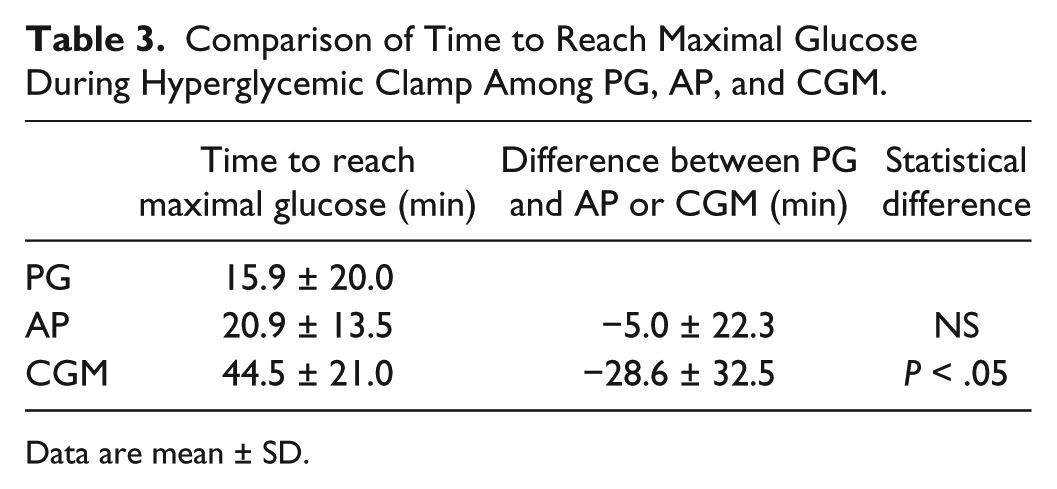
Data are mean ± SD.
The differences between AP, CGM, and PG values in the whole experiment were shown in Figure 2. Of CGM and AP values, 95% were within the zones A and B in the Parkes consensus error grid (Figure 2). The distributions of Parkes consensus error grid of AP and CGM in each period were investigated. The distributions of zone A in AP values were significantly higher than in CGM values during rising period (Figure 3). Zone A in CGM was higher than AP values during the falling period according to the error matrix10 in each period of AP and CGM (Supplementary Table).
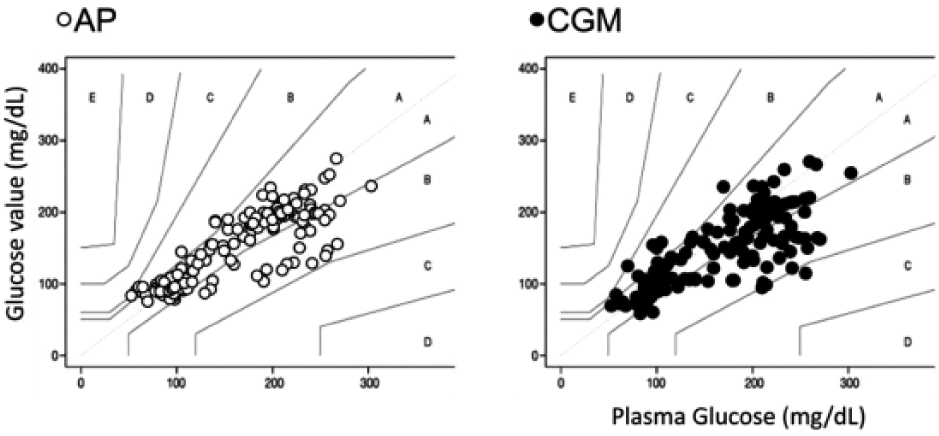
Parkes consensus error grid of AP, CGM, and PG during the experiment. Vertical values indicate PG values. More than 99% of glucose values of AP and CGM were within zone A and B.
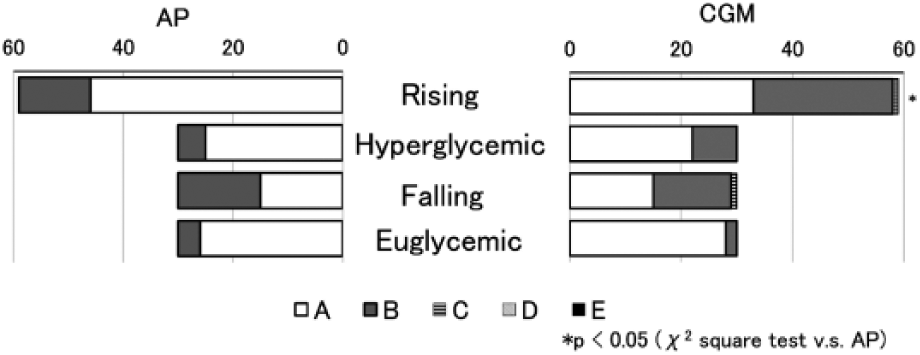
The distribution of Parkes consensus error grid of AP and CGM in each period. X-axis is the percentage of the values in each zone. The distribution of zone A for AP values was significantly higher than in CGM values during the rising period (P < .05).
MARD for the rising period was significantly lower in AP than CGM (15.3 ± 4.6 vs 24.0 ± 7.6, P < .05); however, there were no difference between the MARD of AP and CGM in the other time periods (Table 4).
Comparison of MARD (%) of Glucose Values With PG Between AP and CGM in Each Period.
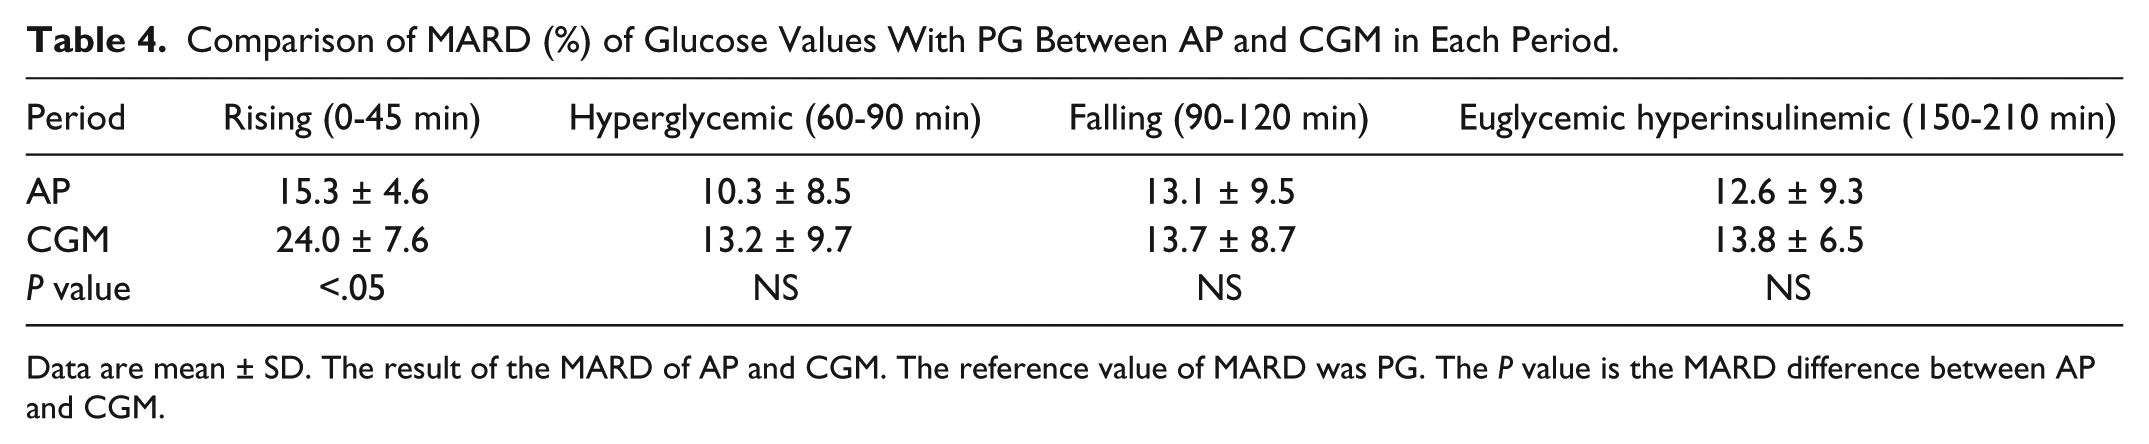
Data are mean ± SD. The result of the MARD of AP and CGM. The reference value of MARD was PG. The P value is the MARD difference between AP and CGM.
Discussion
We investigated herein the accuracy and time delays of CGM and AP in comparison with PG during acute rising (20 mg/dL/min) to hyperglycemic and euglycemic glucose clamp conditions. Hyperglycemic clamp was designed to raise PG from approximately 100 to 200 mg/dL within 5 minutes, which equates to an average rate of 20 mg/dL/min, so this trial does not represent blood glucose fluctuation in real life. AP and CGM values were supposed to show the same glucose values as PG values; however, both of these values were behind PG values during the acute rising period.
To our knowledge, this is the first study to compare AP, CGM, and PG values during nonphysiological glucose rising of hyperglycemic clamp followed by euglycemic hyperinsulinemic clamp. CGM values did not catch up to PG values during the rising period or the hyperglycemic period. There are several reasons for this phenomenon. CGM values were calibrated with two reference points, which were just before and after the experiment in this study. This indicates that retrospective mathematical smoothing, that is, adjustment to values to show an even curve, delayed CGM values during the rising period, which might have led to the higher CGM values at the beginning of hyperglycemic clamp and the lower CGM values during this period. It is reported that the mean (standard deviation) time delay of the CGM values to blood glucose meter was 9.5 (3.7) minutes. 12 The time to catch up to maximum glucose of CGM values in this study was more delayed than in the previous report. This may also account for the delay during the acute rising of glucose.
AP values were significantly lower during the rising period in several points (Figure 1). It might be because of the time lag of the AP system due to the length of the tubing set during clamp procedure is approximately 4-5 minutes. However, AP values were not statistically delayed compared with PG values using multiple comparison method (Table 2). This rising speed is far faster than the previous report, which describes the comparison of PG and CGM values during hyperglycemic clamp by Monsod et al. 13 It might not be necessary for CGM to catch up for these conditions.
The previous reports by Morrow et al 14 compared AP and CGM during steady state in variable glucose clamp, and they found CGM was accurate from 50-250 mg/dL. They used Biostator CGIIs as the AP system, while we used STG-55, which is the only available bedside AP in Japan. The study design was quite different from the previous study by Morrow et al in the view of changing speed of glucose concentration. The blood glucose was raised up by 20 mg/dL/min in our study; however, it was raised up by 2 mg/dL/min in the previous study. So the raising speed of blood glucose was 10 times faster than in the previous report. Although MARD values were not so different from Morrow et al’s report, there might be another index to be evaluated. Medtronic’s sensor response is limited by filtering algorithms to be no more than 3 mg/dL/min. 15 Our protocol is to raise up blood glucose levels 100 mg/dL within 5 minutes, so the delay of the CGM sensor glucose value compared to PG value was expected to be more than their report. There also might have been a streaming/mixing effect, and also the sensor in the AP device is in the center of the AP system. There must have been a time delay because of the tubing. However, there is no other smaller tubing available for the current STG-55 system. We could not test smaller tubing.
On the other hand, AP and CGM values were not different as PG values during rest of the periods (Table 2). These rest of the periods were almost usual physiological blood glucose change. Both CGM and AP may be able to catch up with glucose change in the most of daily life.
Zone A and zone B in the Parkes consensus error grid have been regarded as clinically acceptable. 9 Although AP and CGM values were significantly different from PG values, more than 99% of AP and CGM values were within zone A and zone B (Figure 2). This indicates that AP and CGM values were at least clinically safe to use. However, the distribution of zone A in AP was significantly higher than CGM during the rising period according to precise investigation (Figure 3). These results indicate that AP reflects the glucose change better than CGM during rapid glucose change. On the other hands, zone A of the error matrix10 during falling period, AP seems worse than CGM; this may be because of automatic smoothing of the CGM computer algorithm (see Supplementary Table).
We performed 10 tests of experiment: 8 subjects were studied once and 1 subject was studied twice; however, the number of subjects was small. There are several questions left for this experiment. If we change the calibration time to a very distant time from the experimental period, do the results remain the same? Also, if we use real-time CGM sensors, do they perform the same way? These questions are left for future research.
Conclusions
Both CGM and AP did not follow nonphysiological acute glucose rising, but matched well during physiological glucose-lowering change.
Footnotes
Abbreviations
AP, artificial pancreas; BMI, body mass index; CGM, continuous glucose monitoring; HbA1c, glycated hemoglobin; MARD, mean absolute rate difference; PG, plasma glucose.
Declaration of Conflicting Interests
The author(s) declared the following potential conflicts of interest with respect to the research, authorship, and/or publication of this article: This work was funded by Nikkiso CO, LTD, Tokyo, Japan.
Funding
The author(s) disclosed receipt of the following financial support for the research, authorship, and/or publication of this article: MM has received research support from Nikkiso CO, LTD.
Supplementary material is available for this article online.
References
Supplementary Material
Please find the following supplemental material available below.
For Open Access articles published under a Creative Commons License, all supplemental material carries the same license as the article it is associated with.
For non-Open Access articles published, all supplemental material carries a non-exclusive license, and permission requests for re-use of supplemental material or any part of supplemental material shall be sent directly to the copyright owner as specified in the copyright notice associated with the article.