
Abstract
Background:
Automated clinical decision support systems (CDSS) are associated with improvements in health care delivery to those with long-term conditions, including diabetes. A CDSS was introduced to two Scottish regions (combined diabetes population ~30 000) via a national diabetes electronic health record. This study aims to describe users’ reactions to the CDSS and to quantify impact on clinical processes and outcomes over two improvement cycles: December 2013 to February 2014 and August 2014 to November 2014.
Methods:
Feedback was sought via patient questionnaires, health care professional (HCP) focus groups, and questionnaires. Multivariable regression was used to analyze HCP SCI-Diabetes usage (with respect to CDSS message presence/absence) and case-control comparison of clinical processes/outcomes. Cases were patients whose HCP received a CDSS messages during the study period. Closely matched controls were selected from regions outside the study, following similar clinical practice (without CDSS). Clinical process measures were screening rates for diabetes-related complications. Clinical outcomes included HbA1c at 1 year.
Results:
The CDSS had no adverse impact on consultations. HCPs were generally positive toward CDSS and used it within normal clinical workflow. CDSS messages were generated for 5692 cases, matched to 10 667 controls. Following clinic, the probability of patients being appropriately screened for complications more than doubled for most measures. Mean HbA1c improved in cases and controls but more so in cases (–2.3 mmol/mol [–0.2%] versus –1.1 [–0.1%], P = .003).
Discussion and Conclusions:
The CDSS was well received; associated with improved efficiencies in working practices; and large improvements in guideline adherence. These evidence-based, early interventions can significantly reduce costly and devastating complications.
Keywords
Best practice in the management of diabetes has been established by the use of national guidelines based on an appraisal of the available evidence.1-3 Diabetes care in Scotland relies on a series of managed clinical networks supported by a national informatics platform—the Scottish Care Information Diabetes Collaboration (SCI-Diabetes). 4 Regional and national audits of clinical practice are published on an annual basis using data extracted from SCI-Diabetes. 5 Despite the rising prevalence of diabetes in Scotland there has been a sequential improvement in QPIs and the incidences of diabetes-related complications have decreased.6-8 However, there is room for improvement in adherence to guidelines, as evident when comparing with the international community. 9
It is estimated that more than half of all clinical decisions fail to take account of the best available evidence. 10 In addition, evidence-based guidelines often do not accommodate comorbidities and multiple medications.11-13 There is a recognized need to find innovative ways of integrating knowledge into clinical workflow, to contextualize and personalize care, and to manage the complex care needs and human factors that contribute to unwanted variation in practice.14,15
Clinical decision support systems (CDSS) utilize algorithms of varying complexity that are applied to existing eHealth systems. The use of automated reminders via CDSS has been shown to be one of the most consistently successful approaches to encourage clinicians to adopt evidence-based practice, 16 although there is a lack of evidence to demonstrate that this translates into improved clinical outcomes. 17
This study reports on a project that aimed to pilot a CDSS within the SCI-Diabetes system within two regions in Scotland. The evaluation aimed to assess users’ and patients’ reaction to the CDSS, to demonstrate whether there were no unintended adverse effects attributable to the system, and to quantify any change in clinical processes or outcomes.
Methods
The CDSS was based on the Evidence Based Medicine electronic Decision Support (EBMeDS) system developed by the Finnish Medical Society—Duodecim Medical Publications Ltd, who collaborated on the project. 18 The various algorithms used to generate CDSS messages were amended to conform to Scottish national guidelines, 1 with full details of the final scripts available via the EBMeDS website. 19 EBMeDS is accredited by the UK National Institute for Health and Care Excellence (NICE), 20 and is currently being evaluated in a number of settings.21-25 Messages could be grouped into 3 main categories:
Reminders of pending investigations, eg, screening tests for diabetes-related complications
Prompts to consider intervention, eg, initiating a treatment associated with improved long-term outcomes
Alerts to a potentially deleterious situation, eg, prescribing of a contra-indicated medication or inappropriate dose
The SCI-Diabetes user interface (UI) was adapted to display these messages within a “pop-up” dialogue box that appears on opening an individual patient record, the appearance and behavior of which was adapted in light of user feedback (see Figure 1).
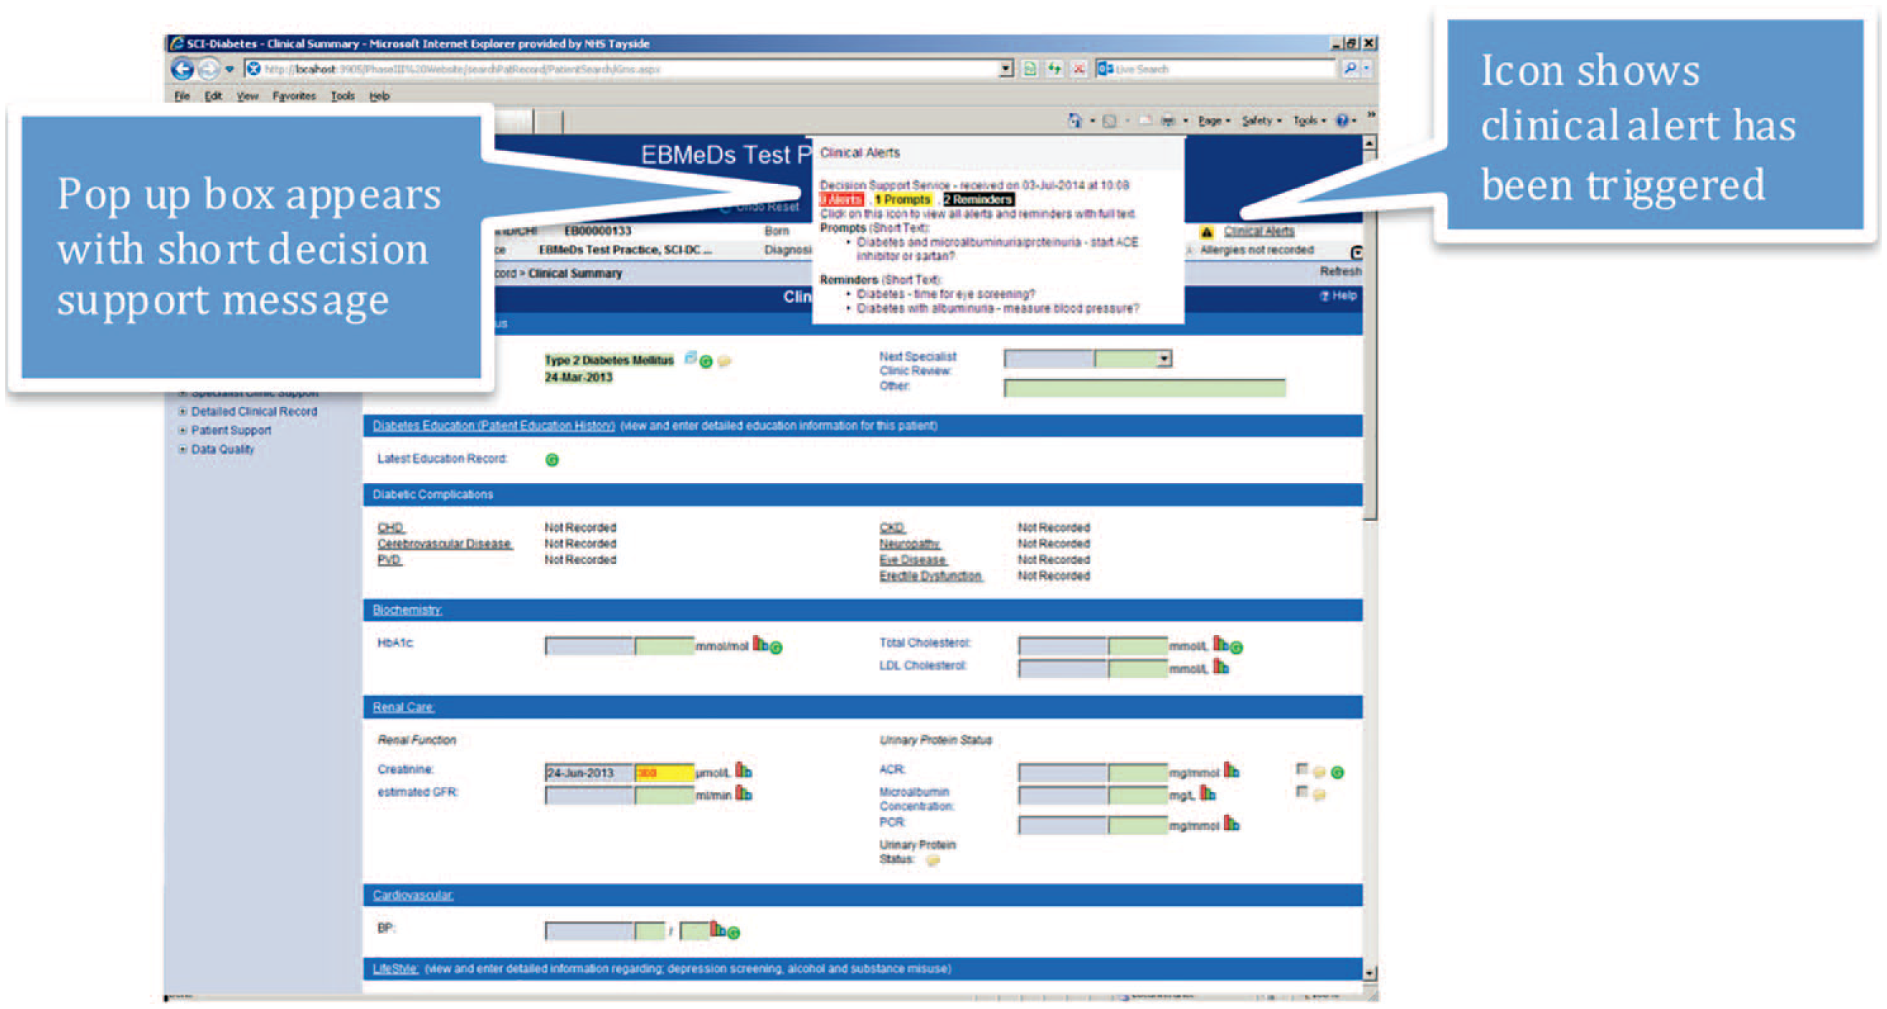
Screenshot of SCI-Diabetes user interface showing CDSS short message pop up dialogue box within a test page.
All people with diabetes in Scotland are registered to SCI-Diabetes (approximately 280 000 individuals). 5 The system encrypts and transmits compressed, coded data via the NHS N3 network. HCP access is dependent on which health care domain the user is employed. All study data were extracted in a pseudo-anonymized format. Data controllers retained the cipher and all data were transferred to the researchers using a secure NHS file sharing network. Permission to access these data was granted via the national Caldicott Guardian, in accordance with the UK Data Protection Act 1998. 26 The service improvement nature of the project precluded the need for formal research ethics review.
Implementation of the CDSS within SCI-Diabetes adopted a quality improvement approach whereby the system was introduced to a limited number of health care domains; evaluated for acceptability; adapted in light of user feedback; and then introduced more widely. Two such “improvement cycles” ran over the course of an 18-month period. Cycle 1 was conducted in Tayside, Scotland, and included Ninewells hospital diabetes clinic plus one general practice. Cycle 2 widened coverage to include St John’s hospital, Livingston diabetes clinic. The system was then implemented for the whole of NHS Tayside (including primary care) to cover a combined diabetes population of ~30 000. This study reports on data obtained from improvement cycles 1 and 2 (see Figure 2).
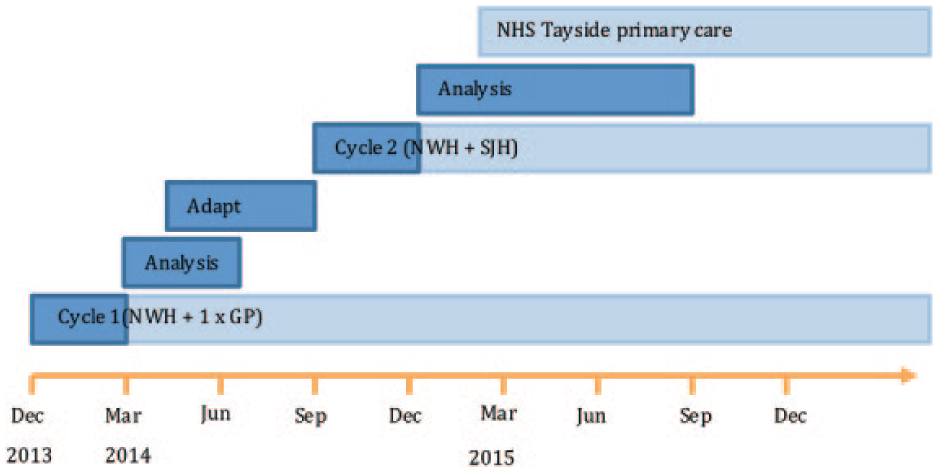
Project timeline showing the 2 improvement cycles. NWH, Ninewells Hospital; GP, General Practice; SJH, St John’s Hospital.
Patient Reaction
A patient-reported experience measures (PREMs) questionnaire was devised and distributed to patients attending diabetes clinics at two time points: December 2013-February 2014 (cycle 1) and August 2014-February 2015 (cycle 2). The questionnaire was adapted from the NHS Scotland Patient Survey27,28 and consisted of a series of closed, 5-point Likert-type scale items grouped within different domains: interaction with doctors and nurses, use of medication, and general satisfaction. A copy of the questionnaire is available within the supplementary files. Scores were calculated for each domain. The domain scores served as dependent variables in a multivariable linear regression analysis. Patient demographics and presence/absence of a CDSS message displayed to the HCP were entered as independent predictors.
Health Care Professional Reaction
Two questionnaires were developed for distribution to health care professional (HCP) users of SCI-Diabetes and distributed prior to, and at the end of each 3-month quality improvement cycle in both primary and secondary care. The questionnaires were available in electronic and paper versions and consisted of a series of closed 5-point Likert-type scale questions grouped by theoretical construct, derived from the Unified Theory of Acceptance and Use of Technology (UTAUT) model, 29 and adapted from the work of Heselmans et al. 30 Construct scores served as dependent variables in a multivariable linear regression analysis. HCP demographics were entered as the independent predictors.
Three HCP focus groups were conducted, each comprising 8-9 HCPs of varying roles within the diabetes departments taking part in the study. The first focus group explored attitudes to CDSS prior to implementation. The second group gave reaction and feedback following the first improvement cycle. The system was amended in light of this feedback and the third focus group gave their reaction to these changes. A constant comparative approach identified emergent themes describing the differing attitudes to CDSS adoption.
For the quantitative analysis of HCP system usage, data were extracted from the SCI-Diabetes audit trail for improvement cycle 1. The outcomes of interest were the number of user “clicks” within patient record and the duration of time that the patient record was viewed. Comparison was made between presence or absence of a CDSS message using multivariable generalized estimating equations, correcting for number of CDSS messages; patient comorbidity score; diabetes type; insulin therapy and socioeconomic status.
Clinical Processes
The outcomes of interest included adherence to guideline recommendations (as measured by QPIs). The QPIs included screening for foot disease (standardized foot screening in accordance with Scottish diabetes group guidance); 31 hyperlipidemia (serum cholesterol); thyroid disease (serum thyroid stimulating hormone [TSH]); and kidney disease (serum creatinine and urinary albumin/creatinine ratio [UACR]).
Cases were defined as those patients where the HCP received a CDSS message during the period of study. Cases were matched to controls residing in regions within Scotland that were not taking part in the study (ie, their HCP did not receive any CDSS messages), and who had attended their local diabetes clinic during the period of study. Controls were matched in a ratio of 2:1 based on the following criteria: age (±2 years); gender; diabetes type; duration of diabetes (±2 years); BMI (±2 kg/m2); and attendance at clinic during the study period.
Cases and controls were included in the analysis of each QPI if there were no recorded screening tests within the previous 15 months (24 months for TSH). In each instance, cases’ HCP received a CDSS message alerting them to this fact, whereas no such message was displayed to controls’ HCP. Adherence was considered improved if those patients with no recorded screening activity proceeded to have the screening test done within 30 days postappointment. Cases and controls were compared by multivariable linear regression taking into account potential demographic confounders (user role, patient age, diabetes type/duration, comorbidity, and deprivation).
Power was calculated using the foot disease screening primary outcome. Based on national data, 82% of patients would have received foot screening in the preceding 15 months. 32 Approximately 1200 patients would attend clinic during the period of study, 216 (18% of 1200) of whom would have had no foot screening in the past 15 months. With no intervention, it was assumed that 12 of these patients would receive foot screening every month (ie, background screening rate: 82% of 216 divided by 15 months = 11.8). If the CDSS resulted in the HCP screening an additional 8 patients per month then over the course of the 3-month study period, 60 patients who had not received foot screening for 15-months (ie, 3*(8+12)) would receive foot screening in the intervention clinic (60/1200 = 5%). It was assumed that the control patient group (anticipated n = 2400) was subject to the same background rate of foot screening, resulting in 24 patients per month who had not received screening in the past 15-months receiving foot screening through routine care—equivalent to 72/2400 (3%) over the three-month period. The resulting difference between the 2 samples (5% of 1200 vs 3% of 2400) would allow the null hypothesis that there is no difference between the 2 groups to be rejected with 90% power.
Clinical Outcomes
This analysis considered all cases in whom a CDSS message was displayed to HCPs (ie, including those instances outside the diabetes clinic environment) during improvement cycles 1 and 2, matched in the same way to controls living outside the study area, that is, the controls had attended the diabetes clinic but the decision support system was not available. The main clinical outcome of interest was change in glycemic control (HbA1c) at one year following the initial CDSS message (cases) or one year following the initial consultation (controls).
Secondary outcomes included change in serum cholesterol, blood pressure (systolic [SBP] and diastolic [DBP]) and urinary albumin/creatinine ratio (UACR). All samples were processed and analyzed by local NHS biochemistry laboratories (fully accredited to ISO 15189 by the United Kingdom Accreditation Service). Paired data were obtained for each dependent variable from baseline and follow-up at 9-15 months. Comparison of baseline data was made using Student’s T test. The difference between baseline and follow-up values were calculated and then cases and controls were compared by multivariable linear regression, taking into account potential demographic confounders. Independent variables with significance of P < .3 on initial univariate regression were retained in the final model.
Power calculations were based on 1200 patients attending clinic during the study period, of which it was assumed that a prompt would be displayed to the HCP in 20% of cases (n = 240). Prior to the study, the mean HbA1c for patients in Tayside was 59 mmol/mol. 32 A 2 mmol/mol reduction in mean HbA1c in cases, with no observed difference in controls at follow-up would result in the rejection of the null hypothesis that there was no difference between the groups with 81% power (assuming SD = 10).
Results
Patient Reaction
A total of 359 questionnaire responses were received from cycles 1 and 2 combined, from a total population of 2072 clinic attendances (17%). Response rates were higher for cycle 2 (281/471, 60%), following the introduction of dedicated research staff to improve distribution. Responses to all domains were overwhelmingly favorable with >90% or respondents reporting positively to each item. There was no significant association between presence or absence of a CDSS message and score in any of the domains, suggesting that the CDSS had no impact on patient satisfaction with the consultation.
Health Care Professional Reaction
The response rate for pre and post intervention questionnaires was 57/105 (54%) and 39/105 (37%), respectively. Attitudes to the CDSS were mixed. The majority of respondents had a positive or neutral response to the content of the reminders (in terms of relevance, clarity, and quality) and ease of use. Despite this, self-reported use of the system was low. Work role predicted users’ performance expectancy (ie, the degree to which an individual believes the system will help them with their work), which was significantly higher for nurses.
The focus groups demonstrated that HCPs were generally receptive to the idea of a CDSS and could appreciate its utility. There were concerns regarding user fatigue; insufficient tailoring to role; covert surveillance of system use; and the applicability of guidelines in general to a complex patient population. Following implementation, there was evidence of some users using the system within their normal clinical workflow to improve the efficiency of their use of SCI-Diabetes. System behavior was amended in light of feedback prior to the second improvement cycle and subsequent feedback was positive.
With regards to system usage, there were 5355 unique patient records opened during improvement cycle 1, each record being opened a median of 3 times (range 2 to 56, interquartile range (IQR) 4). The total number of records opened was 17 280. CDSS messages were displayed on opening 6665/17 280 patient records (39%). When displayed, the median number of CDSS messages was 3 (range 1 to 12, IQR 3). Presence of a CDSS message had no association with the duration that the record was viewed by nurses, however the number of mouse clicks made by nurses within the patient record was significantly increased when a CDSS message was displayed (median number of clicks (IQR) 19 (29) versus 16 (25), adjusted P = .014). Among doctors, the duration that the record was viewed was significantly reduced when a CDSS message was displayed (median duration (IQR) 33 sec (81) vs 38 sec (85), adjusted P = .032), with no other significant confounders. The presence or absence of a CDSS message had no relationship with number of mouse clicks made by doctors.
Clinical Processes
A CDSS message was displayed to an HCP in 1883 cases attending the diabetes clinic (cycle 1 = 1116, cycle 2 = 767 cases), of which 1749 were matched to two controls. An additional 59 cases were matched to one control, resulting in a comparator group of 1808 controls. The remaining 75 cases were unable to be matched on the defined criteria and so were excluded from analysis. There were no significant differences between cases and controls for any of the matching criteria, that is, age, gender, diabetes type and duration, and BMI.
Prior to the intervention, adherence to each of the QPIs was greater than 60% (Table 1). The proportion of all cases that had had foot screening in the previous 15 months was significantly greater amongst cases than amongst controls (76.5% versus 73.4%, P < .001), whereas controls had significantly greater adherence to screening for TSH, creatinine and cholesterol. There was no difference between groups in previous adherence to UACR screening (see Table 1).
Adherence to Guidelines in Cases and Controls, Before and After Clinic Appointment.
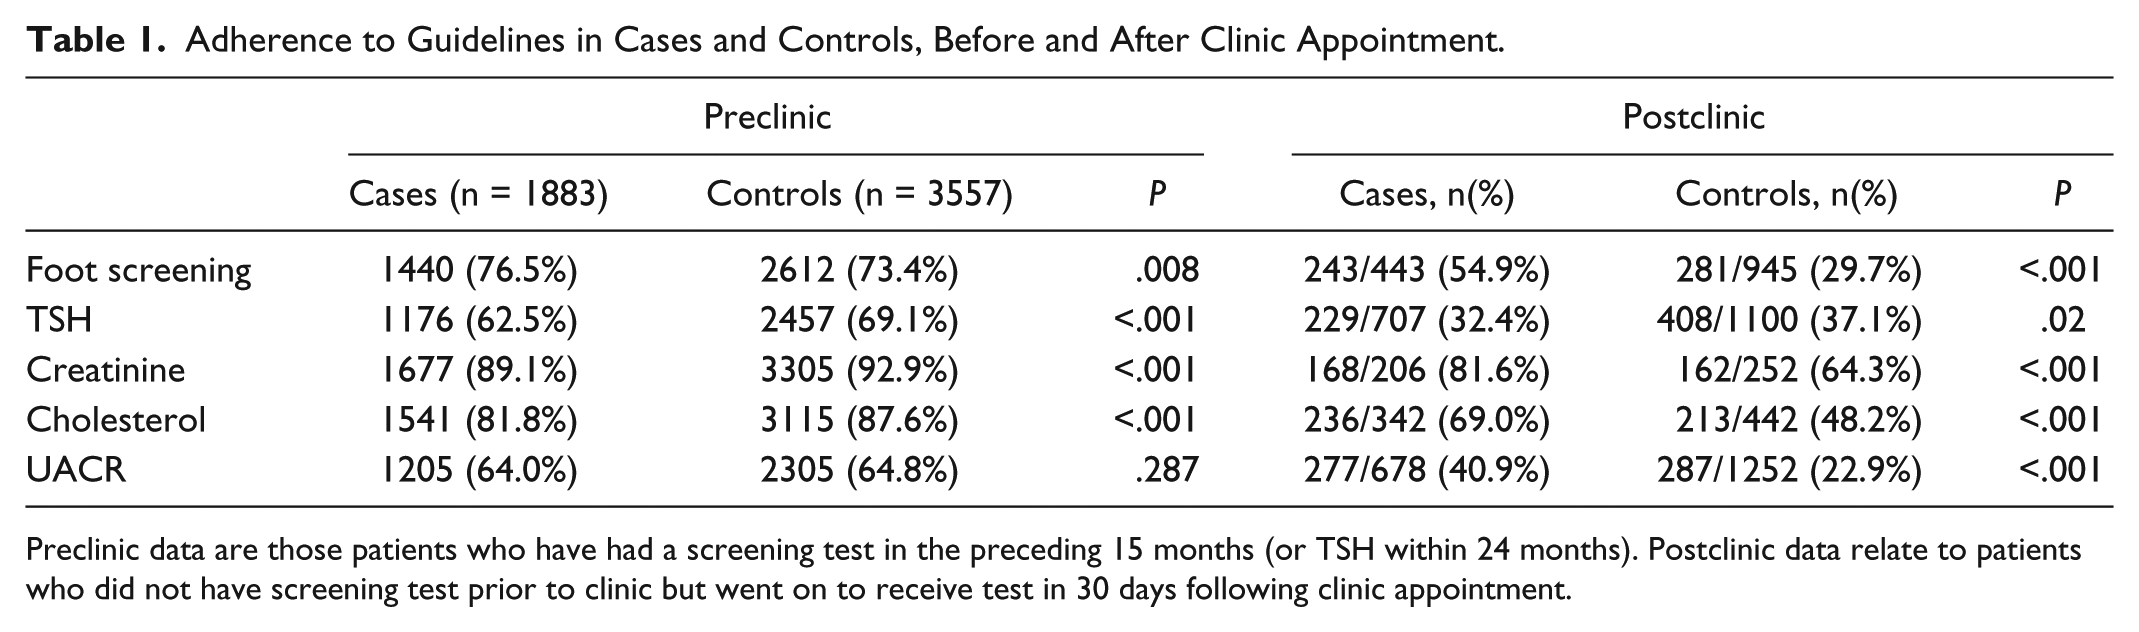
Preclinic data are those patients who have had a screening test in the preceding 15 months (or TSH within 24 months). Postclinic data relate to patients who did not have screening test prior to clinic but went on to receive test in 30 days following clinic appointment.
In the month following a clinic appointment, a significantly greater proportion of cases than controls received appropriate screening for foot disease, kidney disease and hypercholesterolemia (Table 1). After adjusting for potential confounders, patient group (ie, case or control) was a significant predictor of whether or not a patient received appropriate screening following a clinic appointment for each QPI. The size of this effect varied by hospital site. During improvement cycle 1, the intervention was significantly associated with increased uptake of screening for foot disease (adjusted OR 1.4, 95% CI: 1.0 to 2.1, P = .045) and urinary protein (2.0 (1.5 to 2.7), P < .001) but decreased uptake of thyroid disease screening (0.2 (0.1 to 0.2) P < .001). During improvement cycle 2, cases were significantly more likely than matched controls to undergo screening for all of the outcomes, the odds of which were far greater than those observed in cycle 1. Cases were over 4 times more likely than cases to have their feet, cholesterol and creatinine checked (adjusted OR (95% CI): 4.5 (3.2 to 6.3); 4.5 (2.3 to 8.6); 4.2 (2.7 to 6.5) respectively, all P < .001); 9 times more likely to have TSH checked (9.1 (6.2 to 13.2) P < .001); and twice as likely to have UACR checked (2.7 (2.0 to 3.6) P < .001). The overall probability of receiving screening more than doubled for hypercholesterolemia (adjusted OR 2.4 (95% CI: 1.6 to 3.0)); creatinine (2.5 (1.6 to 3.9)); UACR (2.3 (1.9 to 2.8)); and foot screening (2.9 (2.3 to 3.6)), all P < .001. Screening for hypothyroidism decreased slightly (0.8 (0.7 to 1.0), P = .035) (see Figure 3).
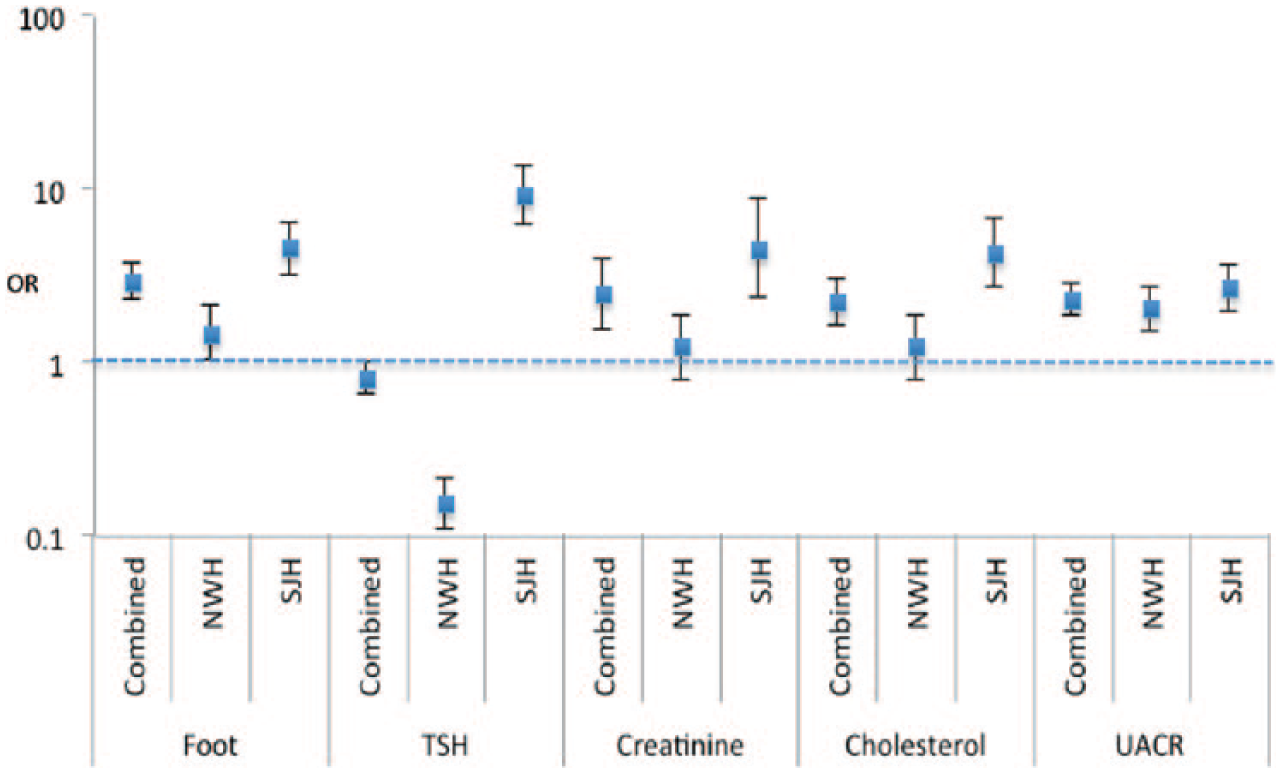
Adjusted odds ratios for each of the primary outcomes, stratified by site. Odds represent the probability of a case receiving screening for the complications of diabetes following a clinic appointment, compared with controls. Adjusted for age, diabetes type and duration, gender and BMI. NWH, Ninewells hospital; SJH, St John’s hospital; OR, Odds ratio (log scale); TSH, Thyroid stimulating hormone; UACR, urinary albumin/creatinine ratio.
Clinical Outcomes
A CDSS message was generated for 5692 cases in total (including the 1883 cases visiting clinic). Of these, 5245 were successfully matched to two controls. An additional 187 cases were matched to one control, resulting in a total control population of 10 677. The remaining 260 cases were unable to be matched on the defined criteria and so were excluded from analysis.
There were no significant differences between cases and controls in terms of demographic variables nor HbA1c at baseline (71.4 mmol/mol (6.5%) vs 70.6 (6.5%), P = .086). Baseline cholesterol, SBP and UACR were significantly greater in controls (P < .001, P < .001, P = .028 respectively) and baseline DBP was significantly higher in cases (P < .001) (see Table 2).
Linear Regression Used to Determine Significance of Patient Group as a Predictor of Clinical Outcomes.
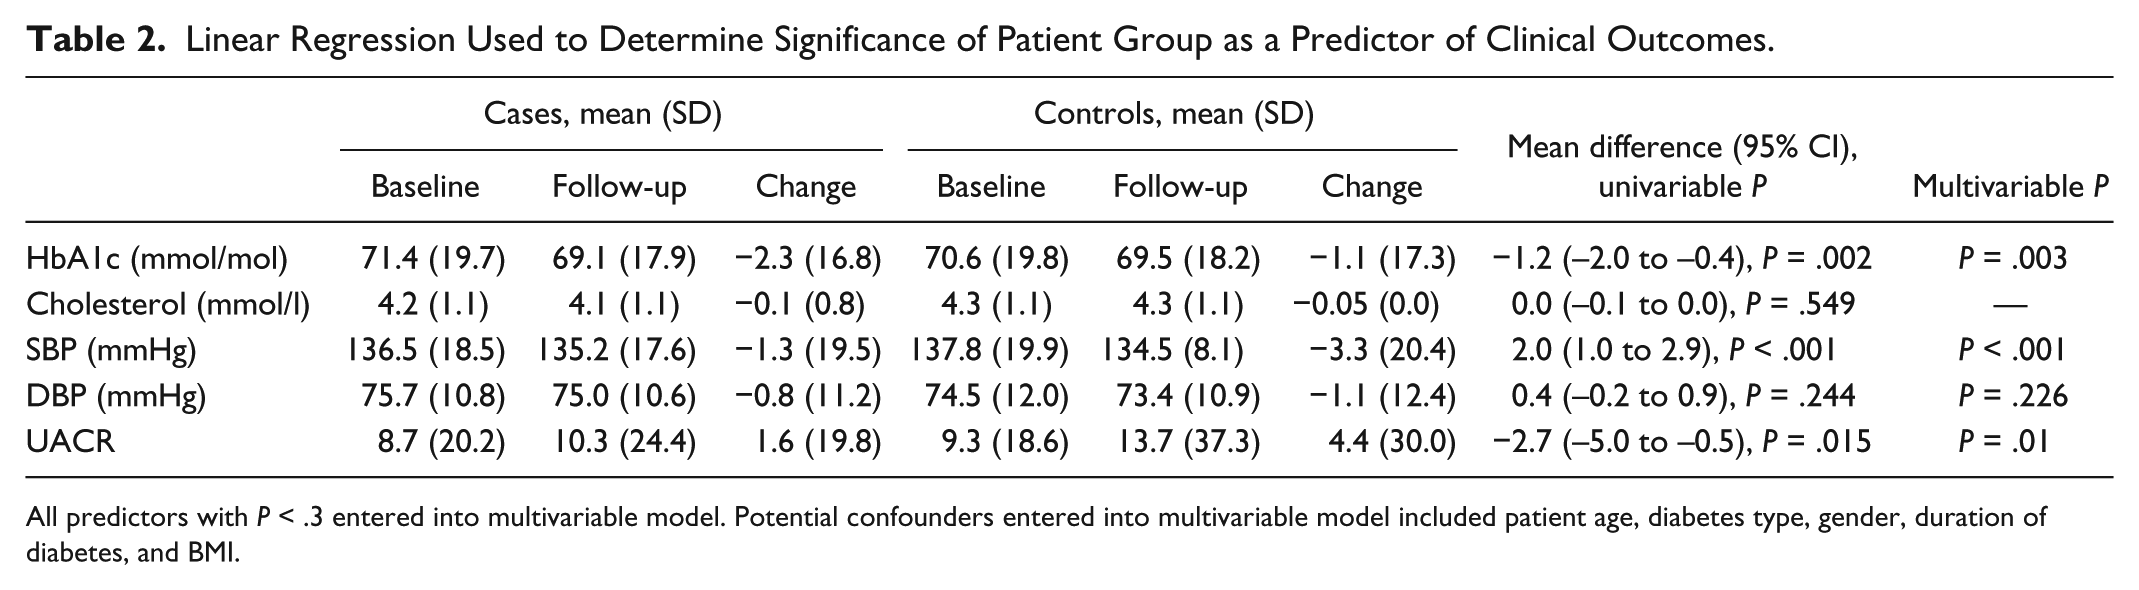
All predictors with P < .3 entered into multivariable model. Potential confounders entered into multivariable model included patient age, diabetes type, gender, duration of diabetes, and BMI.
Paired baseline-follow-up HbA1c values were available for 2662/5432 (47%) cases and 6203/10 677 (58%) controls. Both cases and controls showed improvements in HbA1c, with significantly greater improvement in cases (mean change in HbA1c: 2.3 mmol/l (–0.2%) vs –1.1 (–0.1%), B 1.2 95% CI 0.4 to 2.0, P = .003). There were no significant differences in change in cholesterol and DBP between the groups. SBP improved more among controls (mean change in SBP: –1.3 mmHg vs –3.3, B –2.0, 95% CI: –3.0 to –1.0, P < .001). UACR increased in both groups but significantly more in the control group (mean change in UACR: 1.6 vs 4.4, B 2.9, 95% CI 0.7 to 5.1, P = .01) (see Table 2).
Discussion
This study showed that the use of the CDSS has not had any demonstrable adverse effects on patient experience, clinic consultation or working practices. In addition, this study has demonstrated improved HCP adherence to guideline-driven care. There may also be potential efficiencies and wider cost savings by decision prompts which negate the need for wider interrogation of the medical record. The modest improvements demonstrated in glycemic control have the potential to reduce diabetes-related complications in the long term. These findings are in keeping with other smaller studies assessing the effects of CDSS on the management of long-term conditions, including diabetes. 17 This study further adds to the evidence base by demonstrating how an iterative, quality improvement approach can lead to effective implementation at a population level with large improvements in adherence to guidelines.
This study has also identified differences in working patterns between members of the multidisciplinary team. When subject to a CDSS prompt, on average, doctors would spend less time within the patient record. This may reflect focus group findings that the system enables a more targeted approach to consultations. In contrast to doctors, nurses’ time within the clinical record was unchanged by the CDSS, however their interaction with the system increased (as measured by user clicks). In this case, the CDSS may be acting as a catalyst for users to increase their data entry and is consistent with the questionnaire findings that nurses had greater performance expectancy. Regardless of such supposition, it is worth noting that any change in consultation style or efficiencies had no demonstrable negative impact on patients’ experience of the consultation, as measured by PREMs.
Diabetes-related complications place a substantial burden on health care services. It has been estimated that the overall cost of diabetes within the United Kingdom in 2010/11 was £23.7 billion, with direct costs equivalent to approximately 10% of NHS annual spending. 33 As disease prevalence increases, it is estimated that by 2035 this proportion will rise to 17% of health spending in the United Kingdom. Small improvements in glycemic control are associated with considerable long-term savings due to reduced complications. 34
As the prevalence of diabetes grows, so too does the role of primary care in delivering care. 35 Primary care HCPs are tasked with navigating between multiple guidelines in an effort to deliver effective care to a population with increasing comorbidities. 13 In this context, the potential utility of decision support systems becomes increasingly apparent.
There are a number of limitations in study design that limit the generalizability of our findings. Questionnaire response rate was generally low and focus groups were based on convenience samples of HCPs. The proxy measures of user-interaction with the system (mouse “clicks” and time spent within the case record) were blunt instruments. When analyzing QPIs, controls were closely matched to cases by demographic variables, but there was no ability to match local clinical practice. All centers follow the same national guidance, 1 however it is acknowledged that practice will likely vary by center, as borne out by the comparison of guideline adherence at baseline. It is notable that these observed differences in adherence at baseline were often in the opposite direction to the differences observed at follow-up, suggesting that the intervention had a real impact.
Future work should include further analysis of emergent data; widening the scope of the investigation to cover additional clinical outcomes (eg, prescribing practices); the development and implementation of additional rule-based algorithms based on further user feedback and emerging literature/guidelines; and the effect of tailoring of messages to user group (HCPs and patients).
Conclusions
The diabetes digital landscape is evolving at a rapid pace. Scotland’s national informatics platform for diabetes ensures that widespread implementation of a CDSS is technically straightforward. This work could easily be adapted to systems within other countries as well as other chronic diseases. This project can be viewed as an exemplar for other health care organizations considering such innovations with the potential to improve the safety, quality, and standardization of diabetes care.
Footnotes
Acknowledgements
We acknowledge the help and support of staff and patients of NHS Tayside and NHS Lothian.
Abbreviations
ACE, angiotensin converting enzyme; BMI, body mass index; CDSS, clinical decision support systems; CI, confidence interval; DBP, diastolic blood pressure; EBMeDS, evidence-based medicine electronic decision support; GP, general practitioner; HbA1c, hemoglobin A1c; HCP, health care professional; IDF, International Diabetes Federation; IQR, interquartile range; NHS, National Health Service; NWH, Ninewells Hospital; OR, odds ratio; PREMs, patient-reported experience measures; QPI, quality performance indicator; SBP, systolic blood pressure; SD, standard deviation; SJH, St John’s Hospital; TSH, thyroid stimulating hormone; UACR, urinary albumin/creatinine ratio; UI, user interface; UK, United Kingdom; UTAUT, unified theory of acceptance and use of technology.
Declaration of Conflicting Interests
The author(s) declared the following potential conflicts of interest with respect to the research, authorship, and/or publication of this article: PN is employed by Duodecim Medical Publications, developers and owners of the EBMeDS proprietary system that was used in this study.
Funding
The author(s) disclosed receipt of the following financial support for the research, authorship, and/or publication of this article: This work was supported by a grant from the Digital Health & Care Institute.
Supplemental Material
Supplementary material for this article is available online.
References
Supplementary Material
Please find the following supplemental material available below.
For Open Access articles published under a Creative Commons License, all supplemental material carries the same license as the article it is associated with.
For non-Open Access articles published, all supplemental material carries a non-exclusive license, and permission requests for re-use of supplemental material or any part of supplemental material shall be sent directly to the copyright owner as specified in the copyright notice associated with the article.