
Abstract
Background:
Closed-loop (CL) systems aims to outperform usual treatments in blood glucose control and continuous glucose monitors (CGM) are a key component in such systems. Meals represents one of the main disturbances in blood glucose control, and postprandial period (PP) is a challenging situation for both CL system and CGM accuracy.
Methods:
We performed an extensive analysis of sensor’s performance by numerical accuracy and precision during PP, as well as its influence in blood glucose control under CL therapy.
Results:
During PP the mean absolute relative difference (MARD) for both sensors presented lower accuracy in the hypoglycemic range (19.4 ± 12.8%) than in other ranges (12.2 ± 8.6% in euglycemic range and 9.3 ± 9.3% in hyperglycemic range). The overall MARD was 12.1 ± 8.2%. We have also observed lower MARD for rates of change between 0 and 2 mg/dl. In CL therapy, the 10 trials with the best sensor spent less time in hypoglycemia (PG < 70 mg/dl) than the 10 trials with the worst sensors (2 ± 7 minutes vs 32 ± 38 minutes, respectively).
Conclusions:
In terms of accuracy, our results resemble to previously reported. Furthermore, our results showed that sensors with the lowest MARD spent less time in hypoglycemic range, indicating that the performance of CL algorithm to control PP was related to sensor accuracy.
Achieving recommended glycemic targets is difficult for patients with type 1 diabetes (T1D), despite high motivation and substantial time spent for controlling in everyday life. Currently, despite increasingly effective treatments and glucose monitoring systems, the majority of individuals with T1D still cannot achieve recommended glycemic goals. In this context, there is an increasing awareness that maybe the best solution for T1D patients could be a closed-loop system that can independently restore insulin needs and provide good glycemic balance. This system can deliver insulin automatically, by continuous subcutaneous insulin infusion (CSII). In addition, a designed glycemic control algorithm calculates de amount of insulin to be delivered based on continuous glucose measurements obtained by means of a subcutaneous glucose sensor connected wireless to a glucose monitor, that is, continuous glucose monitoring (CGM). 1
Accuracy of CGMs’ measurements has been improved over the years, and the FDA has recently approved the commercialization of a closed-loop (CL) device that relies on CGM measures to automatically delivery insulin to T1D patients. As CGM measures the glucose in the interstitial fluid, there is a physiological delay due to the fact that glucose must be transported from blood to interstitium. Besides that, inherent sensor properties and the dynamic profile of PG excursions affect sensors’ accuracy.2-4 Therefore, a mismatch in relation to the blood glucose measurements is still present. Consequently, these differences diminish controller’s performance and glycemic management, but it is not an impediment for the usage in CL systems. 5 In a previous study, 6 the consequences of CGM limitations were analyzed in-silico in CL performance, by incorporating real CGM device characteristics into the UVa/Padova simulator. This study showed that poorly CGM performance might have a relevant impact on closed-loop outcomes. In addition, in another study, lack of CGM accuracy resulted in poor postbreakfast control and patients with most hypoglycemic alarms were also those with the highest CGM’s errors. 7
In this study, an evaluation of numerical and clinical accuracy of Paradigm Veo® system with the Enlite-2 sensors® (ENL; Medtronic MiniMed, Northridge, CA) was performed during postprandial period (PP), using data obtained from a previous closed-loop clinical trial. 8 In addition to this, the individual performance closed-loop trials across the study was also assessed according to the accuracy of the sensors in each trial.
Methods
Study Procedure, Devices and Population
Twenty T1D subjects underwent an 8-hour standardized mixed meal test (60 g carbohydrate, CHO) on 4 occasions. On 2 occasions (open loop [OL]), conventional CSII was used and boluses were based on the individual insulin-to-carbohydrates ratios. On the other two occasions, after a meal-announcement, an augmented bolus was given, followed by manual adjustments of the basal rate every 15 minutes according to a CL controller recommendation.
CSII was carried out with the Paradigm Veo insulin pump and CGM using ENL. Two CGM were inserted at least 24 hours before the meals tests and were calibrated using the Contour® Next Link (Ascensia Diabetes Care Holdings AG, Basel, Switzerland; formerly Bayer) 30 minutes before a lunch meal. Although two sensors were used during the study for safety and regulatory reasons, only one was used to feed the CL algorithm. The second sensor was used just in case of failure or malfunction of the first sensor. Definition of the primary CGM (hereafter Main CGM) was performed automatically by the system, based on an accuracy analysis prior to the start of the CL operation. Malfunction has been defined as absolute relative difference (ARD) greater than 30% between CGM and plasma glucose (PG) reference at two consecutives samples or greater than 40% at one-time point.
Two venous lines were prepared, one for arterialized venous blood sampling and the other for insulin/glucose infusion, if required. PG samples were measured every 15 minutes using YSI 2300 Stat Plus Glucose Analyzer (YSI Inc, Yellow Springs, OH, USA). To ensure comparable metabolic conditions between studies, subjects received intravenous infusion of regular human insulin or glucose to maintain PG at 90-100 mg/dl, until the beginning of studies at 12:00. During an 8-h period, postprandial glucose was monitored and OL or CL insulin therapies were applied. Following insulin administration, if PG fell below 70 mg/dl during two consecutive readings, a fixed amount of 15 g of oral glucose was administered to prevent hypoglycemia. Table 1 summarizes the main demographics characteristics of the patients included in this study. Figure 1 shows the protocol details during the sessions. More information about the trial can be found elsewhere. 8
Demographic Characteristics of the Data Set Used.
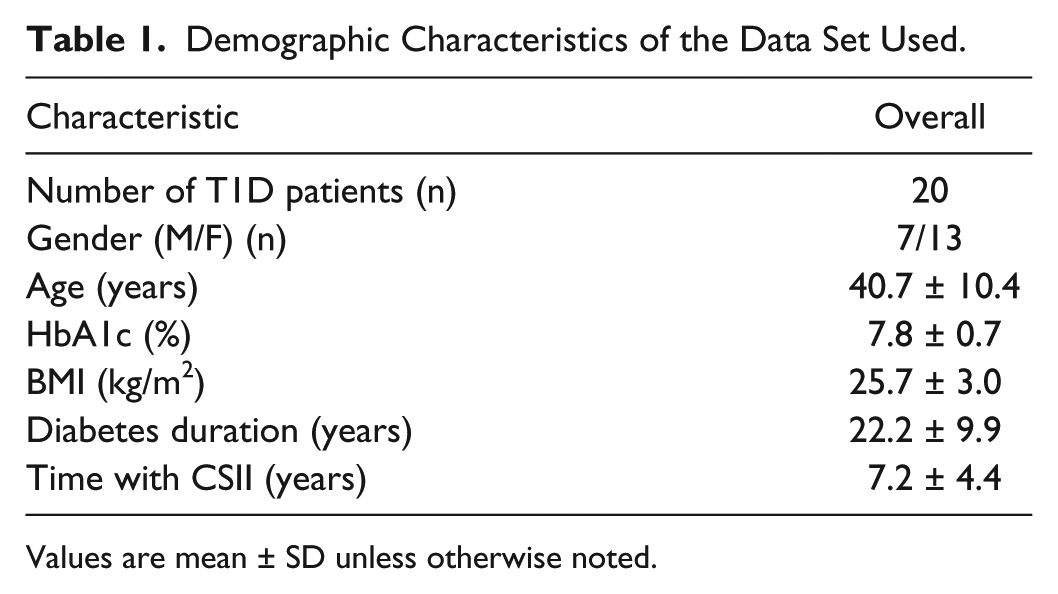
Values are mean ± SD unless otherwise noted.
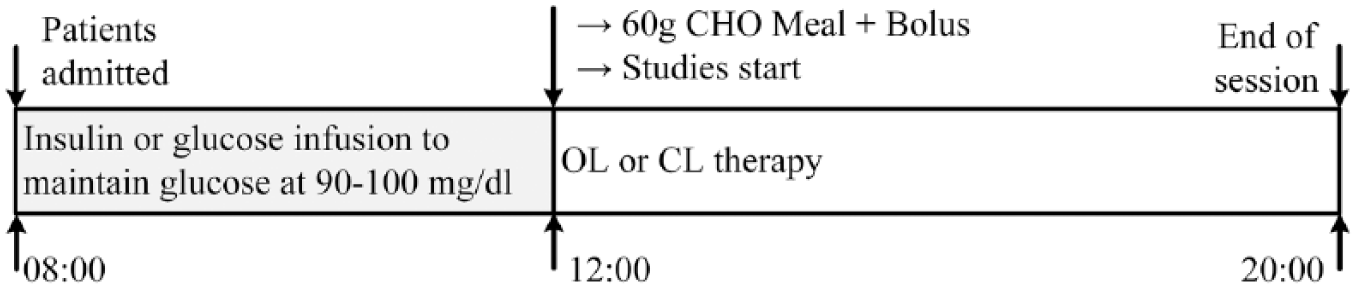
Protocol design of the OL and CL sessions.
Data Analysis
CGM data were registered every 5 minutes and PG data were recorded every 15 minutes. To align CGM and PG data, CGM data were linearly interpolated and rounded to 1 sample per minute. Missing data were not interpolated.
In this work, the accuracy and precision of the CGM sensors were evaluated by the mean absolute relative difference (MARD) and precision absolute relative difference (PARD).9-13 Due to the specific conditions and duration of the trial, we perform the analysis of the short-term MARD (during 8-h) in this work, however, the term MARD is used in the text. The performance of the CL trials was assessed according to the 10 best and worst accurate sensors, sorted by the MARD. Clinical accuracy was analyzed with the Clarke’s error grid analysis (EGA), 14 International Organization for Standardization (ISO) criteria (ISO 15197:2013), 15 and Bland-Altman analysis. 16
Overall average and aggregated MARD and PARD were calculated for all sessions and categorized into glucose ranges <70, 70-180, and >180 mg/dl, as it was performed in other studies.10,11 The average MARD and PARD results were evaluated as averages across all the sessions. MARD and error (error = PG – CGM) were also analyzed according to the PG rate of change.
Relative differences were evaluated as averages across all the sessions (n = 74 and n = 148, for PARD and MARD, respectively). The aggregated MARD and PARD were calculated as the aggregated mean of overall data. The average MARD and PARD in the glucose ranges considered only the sessions that presented hypoglycemic or hyperglycemic events. Aggregated MARD and PARD in the glucose ranges considered all MARD and PARD data categorized in each glucose range. For the CL sessions, the average and aggregated MARD results of the Main CGM were compared with the results of both CGMs (ie, if only 6 of all the sessions presented hypoglycemic events, the MARD results on the hypoglycemic range will count with n = 12 when both CGMs are considered or n = 6, if only the Main CGM is considered).
Different values of average and aggregated MARD and PARD are expected due to the number of individual paired data points is not exactly the same from subject to subject as well as the amount of time spent in each glucose concentration.
The MARD of the main sensor of CL trials was sorted ascendingly. The 10 most accurate sensors were chosen as the 10 best CL sensors. The 10 least accurate sensors were chosen as the 10 worst CL sensors. This allowed the evaluation of the effects of the accuracy of the sensors in the CL trials.
Times in each glycemic range were calculated for PG and CGM measurements for the sessions with 10 best and 10 worst CL sensors. Results were analyzed through mean ± standard deviation (SD) and median (interquartile range [IQR]). The Anderson-Darling normality test was used to determine the normality of the data. For data that does not follow a normal distribution, the sign test was used. A significance level of .05 was considered.
Results
The impact of accuracy of CGM was observed during 8-hour PP. During the CL sessions, a meal bolus was combined with the controller’s insulin infusion, as a feedforward action, to reduce the prandial peak. It is well known that meals are the major disturbance that causes large glycemic excursions. In our study, even with a meal contending 60 grams of CHO, the majority (77.1%) of the rates of change of glycemia were between –1 and 1 mg/dl/min.
Effects of the CGM Accuracy in Closed-Loop Performance
Table 2 presents the MARDs of the 10 best and 10 worst main sensors of the CL trials. Both average and aggregated MARDs of the 10 best are about 15.3% lower than average and aggregated MARD of the 10 worst sensors.
MARD for the 10 Best and 10 Worst Main Sensors of the CL Trials.
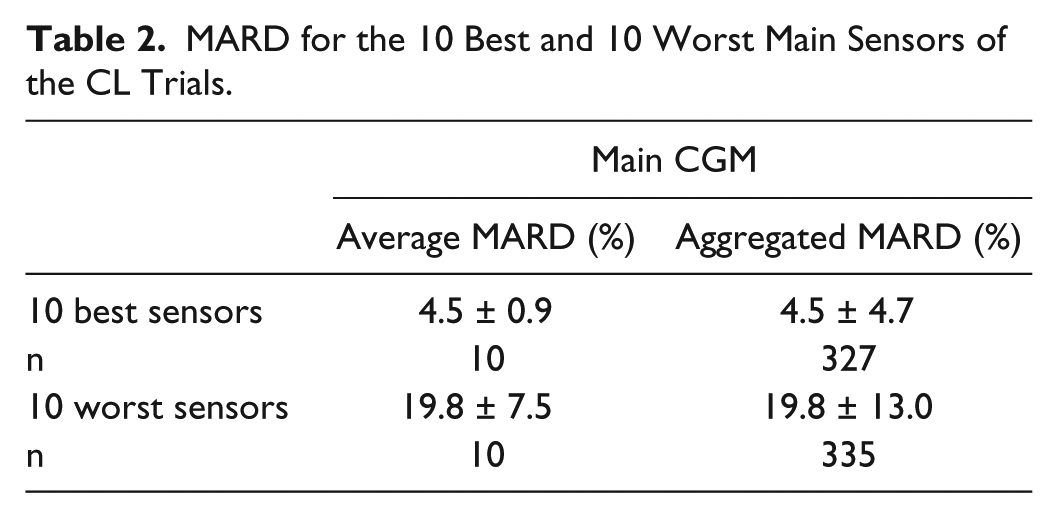
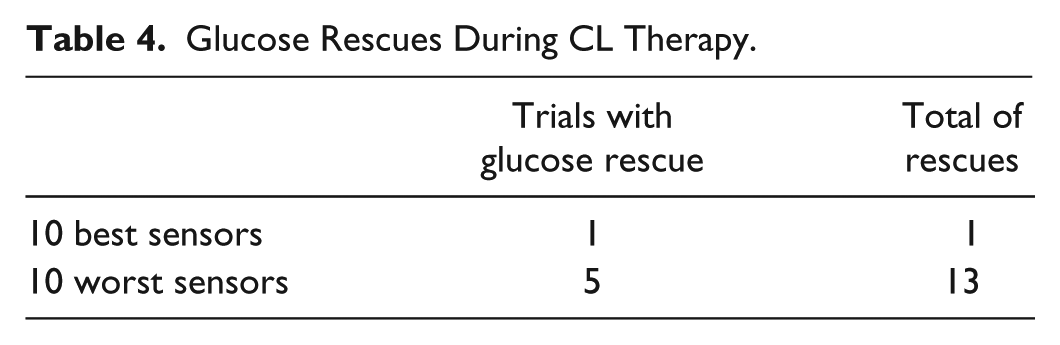
Table 3 presents the time (in minutes) spent in, above, and below the range for 10 best CL sensors and 10 worst CL sensors, calculated either with PG or CGM measurements. Table 4 shows the glucose rescues during the CL therapy. In only one of the 10 trials that considered the best sensors occurred hypoglycemia and administration of oral glucose (rescue) one time. When the 10 trials with the worst sensors were considered, in five trials there was administration of oral glucose, with a total of 13 rescues. Figure 2 shows the mean values of CGM and PG readings for the 10 CL trials with worst MARD. Figure 2a represents the 5 trials in which no glucose rescues were required, and Figure 2b shows the 5 trials in which glucose rescues were necessary.
Time Spent In, Above, and Below the Range in Each 10 Best CL Sensors and 10 Worst CL Sensors, Calculated Either With PG or CGM Measurements.
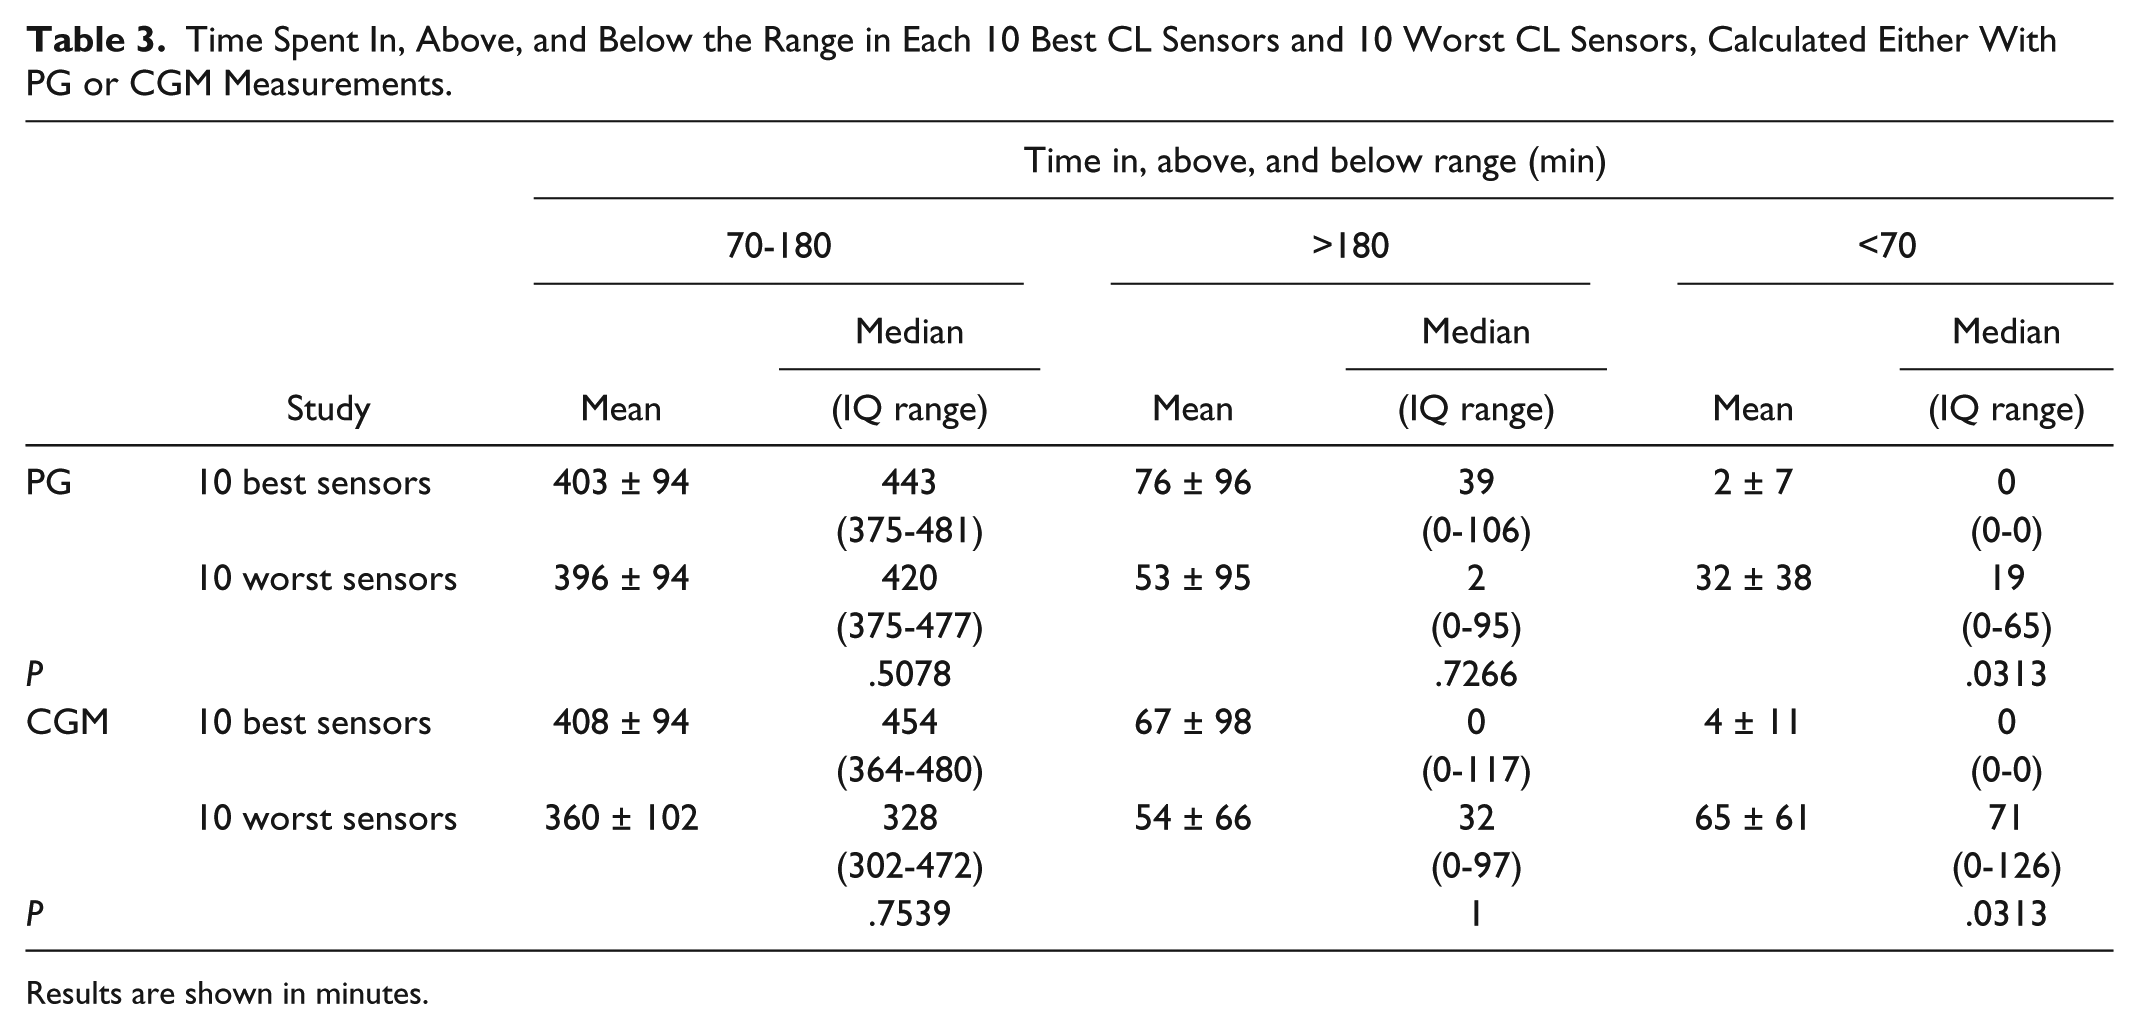
Results are shown in minutes.
Glucose Rescues During CL Therapy.
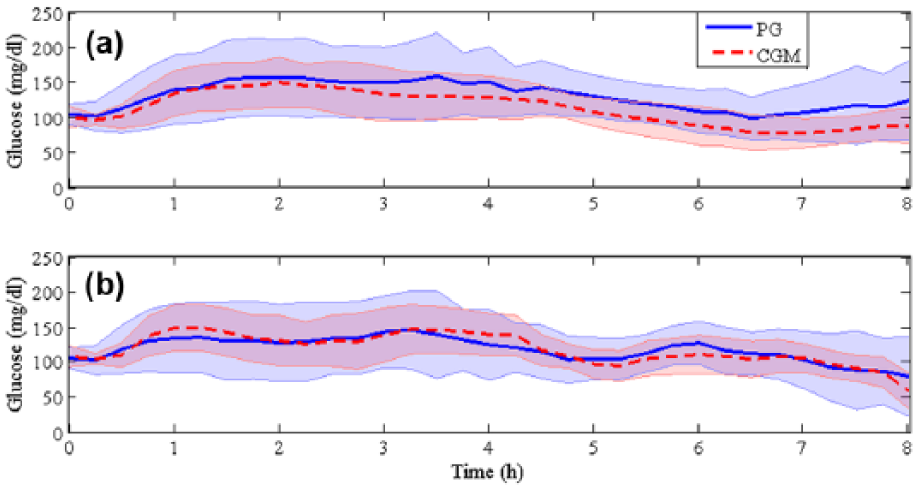
Mean ± SD of PG and CGM readings for the CL trials with 10 worst MARD. (a) Sessions in which glucose rescues were not required. (b) Sessions in which glucose rescues were necessary due to PG readings below 70 mg/dl.
MARD and PARD
Table 5 shows the average and aggregated MARD and PARD for all sessions. The overall average and aggregated MARD were equal to 12.0 ± 7.5% (n = 148, 74 sessions, 2 sensors per session) and 12.0 ± 11.2% (n = 4851), respectively.
Average and Aggregated MARD and PARD for All Sessions.
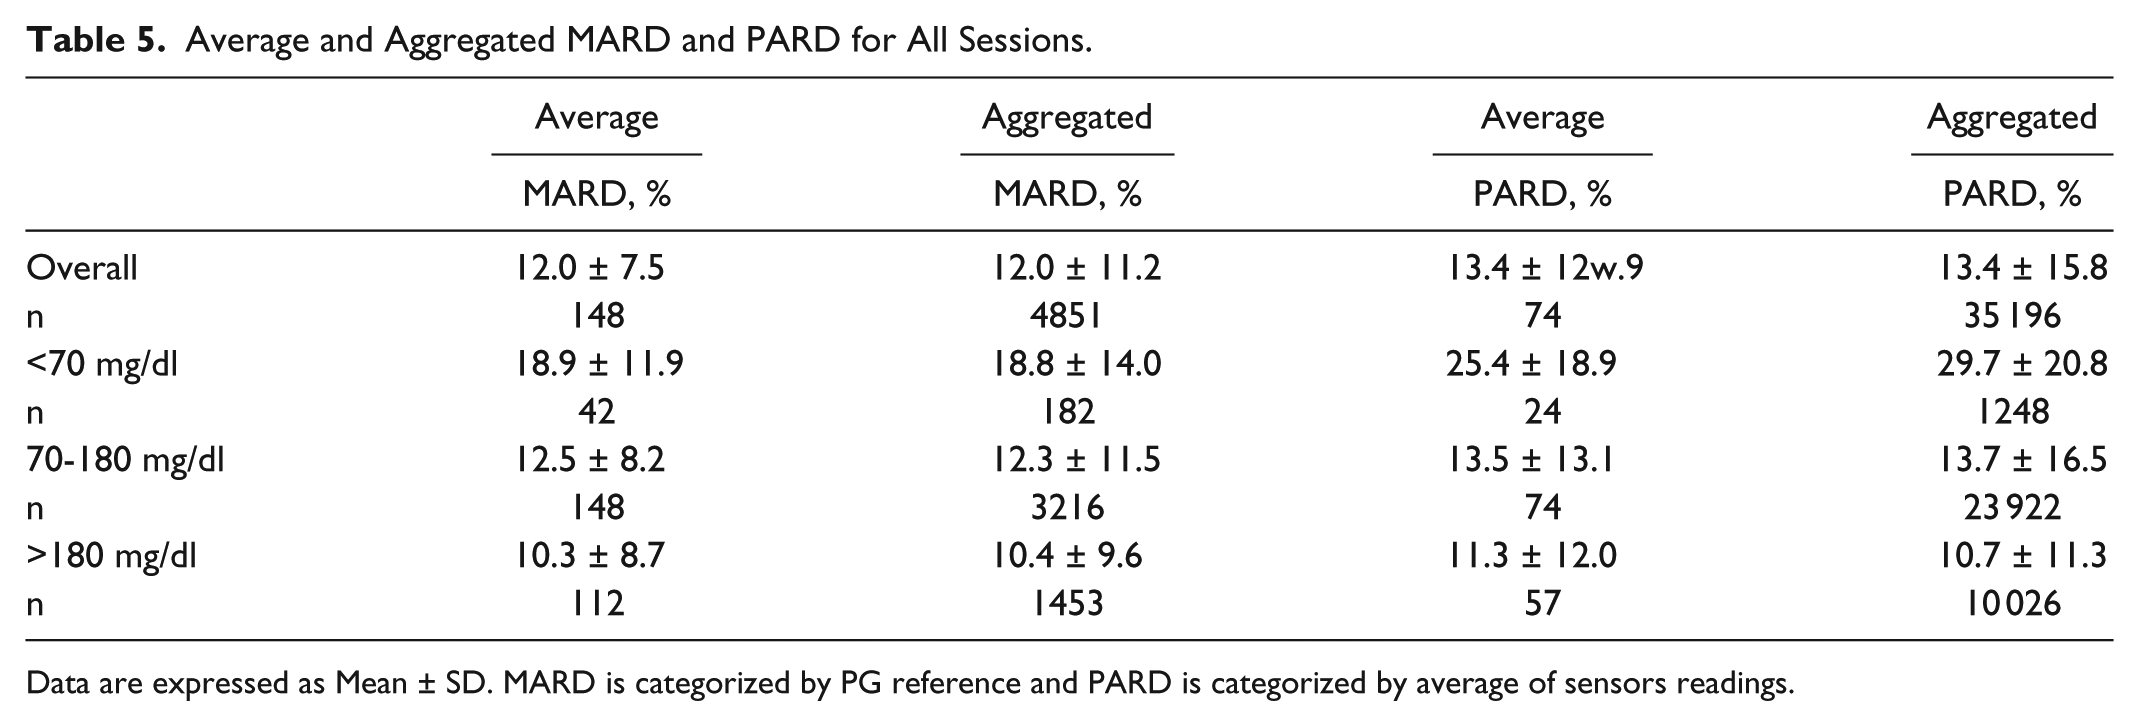
Data are expressed as Mean ± SD. MARD is categorized by PG reference and PARD is categorized by average of sensors readings.
Average and aggregated MARD in the euglycemic range were equal to 12.5 ± 8.2 (n = 148) and 12.3 ± 11.5 (n = 3216), respectively. These values were higher than the values obtained in the hyperglycemic range, where better accuracy was achieved.
Figure 3 shows an illustration of the CGMs readings considering the best and the worst average PARD values between all sessions. PG reference is also shown. Figure 3a shows that the readings of CGM1 and CGM2 almost overlap each other, which indicates a good precision. Figure 3b shows the worst average PARD value obtained between all sensors. This graph illustrates a lack of precision between this pair of CGMs. Considering Figure 3b, at the beginning of the session, both CGMs present small variations in relation to the PG reference. After approximately one hour of the beginning of the session, both sensors diverge from the PG reference: CGM1 is higher than PG reference and CGM2 is lower than PG reference. CGM1 is overestimating PG, it could lead to excessive insulin delivery and development of hypoglycemia. Analogously, CGM2 is underestimating PG, which could lead to hyperglycemia due to the lack of insulin. However further conclusions regarding the error must take into account the control algorithm embedded in each CL system.
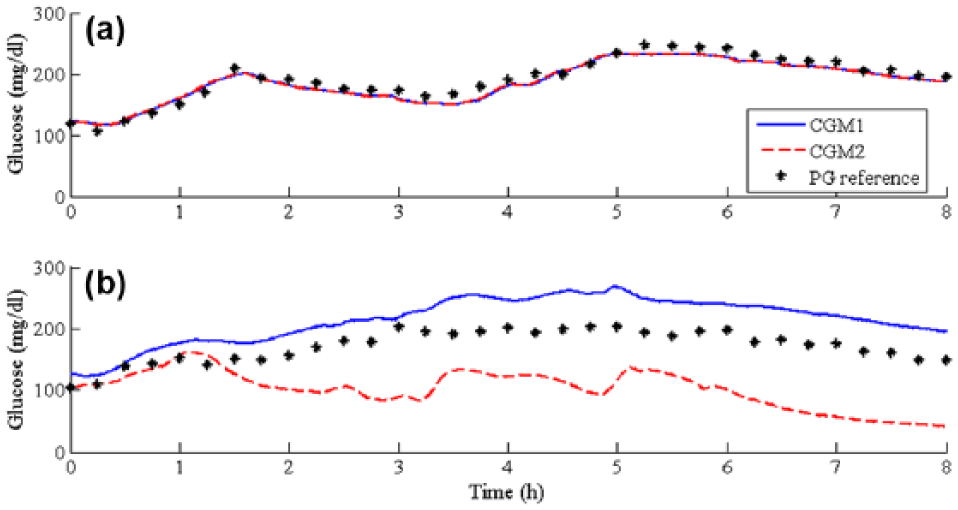
Illustration of CGMs readings considering (a) the best average PARD values between all sessions and (b) the worst average PARD values between all sessions.
MARD—Main CGM
Table 6 compares the value of the MARD for the CL trials using both CGM sensors and using the Main CGM. It is clear that the overall average and aggregated MARD values for the Main CGM are lower than when both CGMs are considered. This happens due to the procedure of switching between the two CGMs to use the best one as the input of the control algorithm.
MARD of CL Sessions: MARD of Both CGM Sensors Compared With Main CGM.
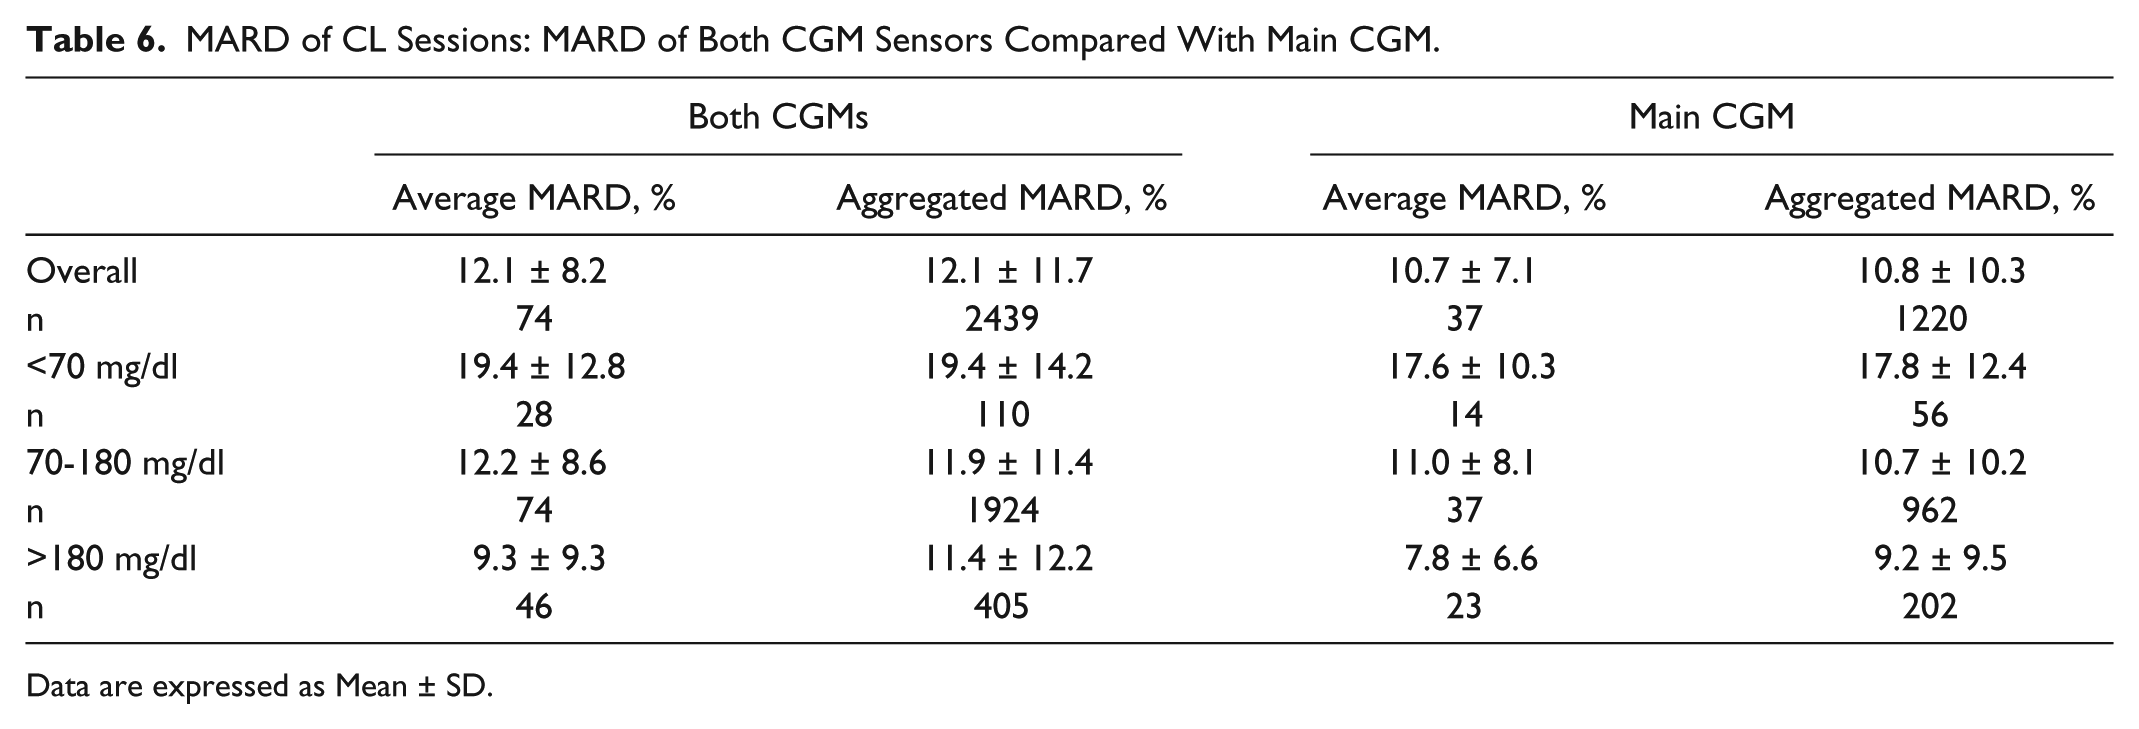
Data are expressed as Mean ± SD.
Accuracy According to PG Rate of Change
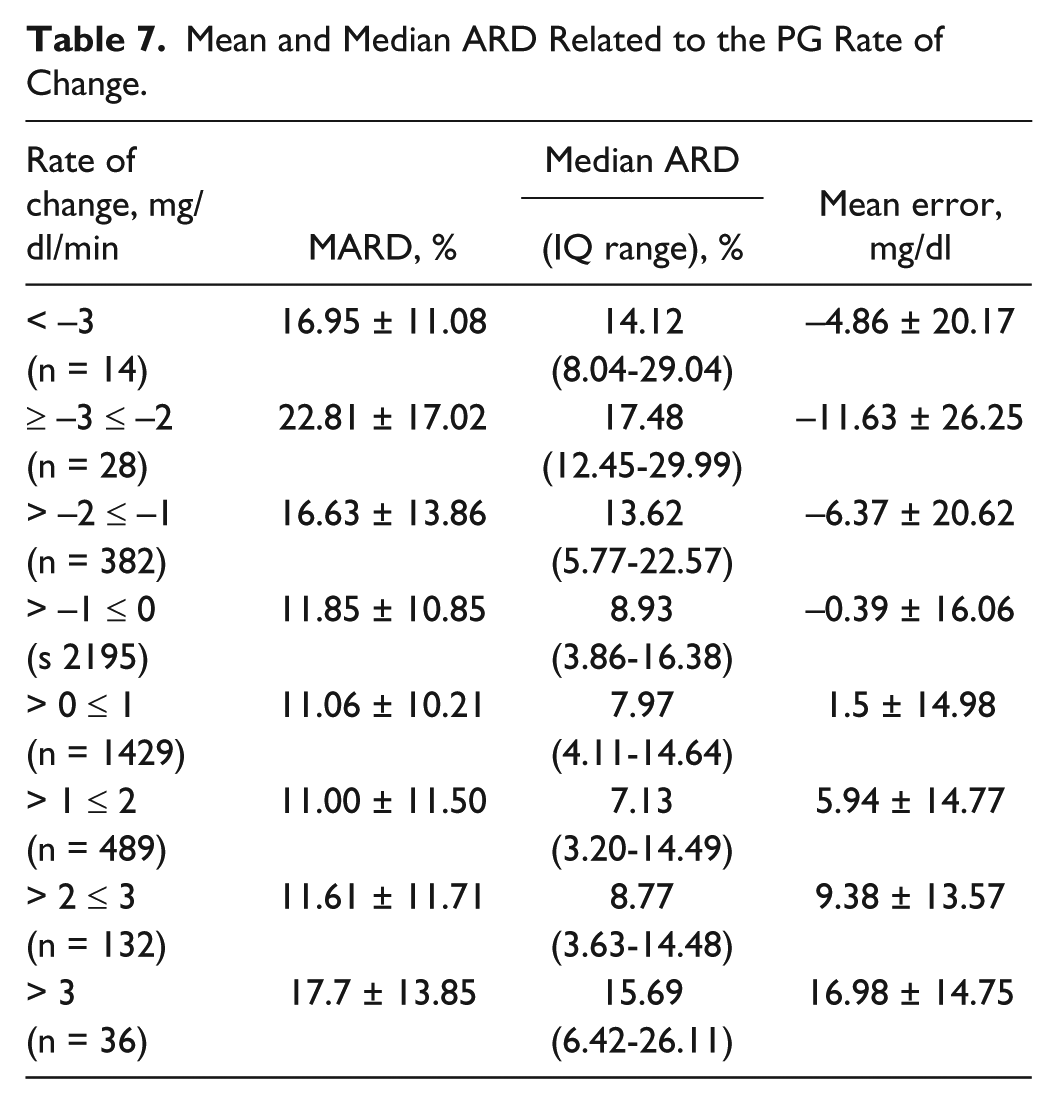
Table 7 shows the MARD, median ARD and the mean error related to the PG rate of change. We observed an increase in MARDs as absolute value of rate of change increases, especially for negative values of changes. In accordance with other publication, 17 sensor errors tend to be positive (CGM readings lower than PG) when the PG rate of change is positive and negative (CGM readings higher than PG) when the PG rate of change is negative.
Mean and Median ARD Related to the PG Rate of Change.
Analysis of Clinical Accuracy
The analysis of clinical accuracy has been performed using Clarke EGA, ISO Criteria and Bland-Altman Analysis. Considering both CGM sensors and all sessions (n = 2630), the EGA yielded 83.45%, 15.32%, 0.02%, 1.22%, and 0.00% of paired measurement results in zones A, B, C, D, and E, respectively. According to the ISO Criteria, 82.05% of the data pairs were considered correct and 17.95%, incorrect. Considering the Bland-Altman analysis, the mean of the differences between PG and CGM readings is equal to 2.44 ± 23.73 mg/dl, with agreement limits of +48.96 mg/dl and –44.07 mg/dl. Numerically, 94.9% of the data lied between the agreement limits.
Discussion
In our study, ENL showed in the PP numerical accuracy closed to that previously reported in different glucose ranges in other time periods of the day and tends to be lower with higher rates of change in glucose. More importantly, our results indicate that the accuracy of the sensor could be strongly related to the controller’s performance in CL trials.
We evaluated the consequences of the CGM accuracy in the performance of our CL studies using data from the best and worst accurate sensors according to MARD. The performance of these trials was assessed by the time spent in each predefined glycemic range and also by the quantity of glucose rescues for hypoglycemia that were administered during the sessions. Considering PG readings, the median time spent in euglycemic range was comparable for the trials with both 10 best and 10 worst sensors (443 vs 420 minutes). The analysis of the same metric using CGM readings showed greater difference (454 vs 328 minutes). However, no statistical difference has been observed in the results.
There was a significant reduction in the time spent in the hypoglycemic range, when 10 best and worst sensors were compared, for both PG and CGM measures. For both PG and CGM readings, the median time spent in hypoglycemic range for the 10 best sensors was 0 minutes. Whereas the median time spent in the hypoglycemic range during the trials with the 10 worst sensors was 19 and 71 minutes, for PG and CGM readings, respectively. Moreover, regarding to the number of rescues in case of hypoglycemia (PG < 70 mg/dl), there was only one case of administration of oral glucose when the best sensors were considered, while there were five trials that required administration of oral glucose when the worst sensors were used.
To analyze the type of error that induces hypoglycemic events, the 10 worst CL sessions according to MARD were divided in two groups: sessions with and without glucose rescues. Each one of these groups contains five sessions. According to Figure 2a, the mean values of CGM readings are consistently below the mean values of PG readings for the trials that did not require glucose rescues. However, in Figure 2b the mean values of CGM and PG readings the same behavior is not noticed. During different times of the sessions the mean CGM readings are higher than the mean PG readings, which led to excessive insulin delivery for the five sessions that required glucose rescues.
So far, to the authors knowledge, no other publications reported PARD results for ENL, impeding a direct comparison and evaluation of our results. Pleus and his colleagues 11 presented an evaluation of average and aggregated PARD of Dexcom G4® stand-alone CGM system (Dexcom, San Diego, CA) for 7 days, including periods of induced glucose excursions. Overall average and aggregated PARD presented by them was considerably lower than the values our study. In their study, overall PARD equals to 7.3 ± 1.9 (n = 10), and 7.3 ± 8.1 (n = 96 430), average and aggregated, respectively. Our values are about 80% higher than the values obtained by Pleus et al. 11
We observed different values of average and aggregated PARD for different glucose ranges. Sensor precision is poor in the hypoglycemic range, according to our results. Pleus and his colleagues 11 showed that the G4 sensor is less precise during the hypoglycemic range. For both sensors, the best PARD results were obtained in the hyperglycemic range.
The average and aggregated MARD obtained in our study are lower than the values obtained by Kropff and his colleagues, 18 but they used a previous version of the sensor than the one we used in our project. In both studies the worst performance was obtained in the hypoglycemic range. In another study, 19 two Enlite sensors were inserted in the abdomen and evaluated for 24 hours in adults in a clinical research center. Similarly to our trial, sensors were calibrated at the beginning of each visit but with the possibility of being recalibrated posteriorly. Overall median ARD was 12.6% when CGM measures were compared with venous blood samples, a value almost identical to the MARD obtained by us.
The effects of rate of change in MARD has also been investigated by Pleus and colleagues. 20 Their results indicates that faster glucose concentration changes result in a more pronounced apparent decrease in accuracy. However, in our results, the MARD for glucose values rising between 2 and 3 mg/dl/min was smaller than the MARD for glucose values falling between –2 and –1 mg/dl/min (11.61 vs 16.63%).
Finally, the comparison of the accuracy between the Main sensor and both sensors showed, as expected, that the values presented for the Main CGM were lower than the values for both CGM. It should be pointed out that this comparison is far from a realistic situation because in real-life use of CGM (including CL systems) only one CGM device will be used.
In addition to the previously mentioned novelties, our study has also some limitations. Our study was designed and performed in a controlled clinical research in-patient environment and during the PP using a single meal with a specific composition. This limits extrapolation of results to daily life conditions usage of CGM.
Conclusions
In this work we analyzed the short-term accuracy of the ENL sensor during PP considering operation in OL and CL. In summary, the ENL showed in the postprandial period accuracy closed to that previously reported in previous studies. We also noticed that lower errors are related to lower rates of change of glucose.
Considering the sensors used during CL operation, we noticed the trials with the 10 best sensors spent less time in the hypoglycemic range than the trials with the 10 worst sensors and required less glucose rescues. For the trials with worst sensors that did not require glucose rescues, the mean value of PG was consistently higher than the mean value of CGM.
Footnotes
Abbreviations
ARD, absolute relative difference; CGM, continuous glucose monitor; CHO, carbohydrate; CL, closed loop; CSII, continuous subcutaneous insulin infusion; EGA, error grid analysis; ENL, Paradigm Veo system with the Enlite-2 sensors; IQR, interquartile range; ISO, International Organization for Standardization; MARD, mean absolute relative difference; OL, open loop; PARD, precision absolute relative difference; PG, plasma glucose; PP, postprandial period; SD, standard deviation; T1D, type 1 diabetes;
Authors’ Note
An abstract containing partial results from this study was presented in a poster presentation at the Advanced Technology and Therapeutics in Diabetes (ATTD) Conference in Paris, February 15-18, 2017.
Declaration of Conflicting Interests
The author(s) declared no potential conflicts of interest with respect to the research, authorship, and/or publication of this article.
Funding
The author(s) disclosed receipt of the following financial support for the research, authorship, and/or publication of this article: This project has been partially supported by the Spanish Government through Grants DPI 2013-46982-C2-1-R, DPI 2016-78831-C2-1-R, DPI 2013-46982-C2-2-R, and DPI 2016-78831-C2-2-R, the National Council of Technological and Scientific Development, CNPq–Brazil through Grants 202050/2015-7 and 207688/2014-1.