
Abstract
Background:
Effective glucose control in the intensive care unit (ICU) setting has the potential to decrease morbidity and mortality rates and thereby decrease health care expenditures. To evaluate what constitutes effective glucose control, typically several metrics are reported, including time in range, time in mild and severe hypoglycemia, coefficient of variation, and others. To date, there is no one metric that combines all of these individual metrics to give a number indicative of overall performance. We proposed a composite metric that combines 5 commonly reported metrics, and we used this composite metric to compare 6 glucose controllers.
Methods:
We evaluated the following controllers: Ideal Medical Technologies (IMT) artificial-intelligence-based controller, Yale protocol, Glucommander, Wintergerst et al PID controller, GRIP, and NICE-SUGAR. We evaluated each controller across 80 simulated patients, 4 clinically relevant exogenous dextrose infusions, and one nonclinical infusion as a test of the controller’s ability to handle difficult situations. This gave a total of 2400 5-day simulations, and 585 604 individual glucose values for analysis. We used a random walk sensor error model that gave a 10% MARD. For each controller, we calculated severe hypoglycemia (<40 mg/dL), mild hypoglycemia (40-69 mg/dL), normoglycemia (70-140 mg/dL), hyperglycemia (>140 mg/dL), and coefficient of variation (CV), as well as our novel controller metric.
Results:
For the controllers tested, we achieved the following median values for our novel controller scoring metric: IMT: 88.1, YALE: 46.7, GLUC: 47.2, PID: 50, GRIP: 48.2, NICE: 46.4.
Conclusion:
The novel scoring metric employed in this study shows promise as a means for evaluating new and existing ICU-based glucose controllers, and it could be used in the future to compare results of glucose control studies in critical care. The IMT AI-based glucose controller demonstrated the most consistent performance results based on this new metric.
Keywords
Furnary and coauthors first introduced the importance of glucose control in the intensive care unit (ICU) setting in 1999, 1 which van den Berghe et al confirmed in 2001 in the first large prospective randomized trial of tight glucose control in an ICU setting. 2 Since that time, multiple tight glucose control studies have been reported;3-6 however, the studies report different glucose metrics, making it difficult to compare study results. A recent invitation-only meeting developed a consensus statement on reporting of individual ICU glucose control metrics. 7 However, these recommendations have not yet been uniformly adopted. To compare the overall results of the various glucose control methods used in different studies, a comprehensive glucose score measurement is needed to incorporate the individual glucose metrics commonly reported. This comprehensive glucose score will allow for a direct comparison of the global glucose control achieved by different glucose control methods. In addition, a global score will be important for future studies that attempt to utilize machine learning as a means to enhance the effectiveness of glucose controllers, as many machine learning techniques require an objective function to maximize. 8 This study is an attempt to develop such a global glucose score, while at the same time testing the overall effectiveness of Ideal Medical Technologies novel AI-based glucose controller (IMT), 9 the Yale protocol (YALE), 10 Glucommander (GLUC), 11 Wintergerst et al PID controller (PID), 12 GRIP, 13 and the NICE-SUGAR (NICE) study protocol 14 through simulation testing.
Methods
We propose a new metric for scoring controller performance called the Glucose Scoring Metric, abbreviated GSM. The GSM offers a flexible framework for combining multiple individual glucose scoring metrics into one readable number by taking each individual metric
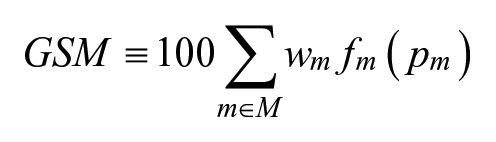
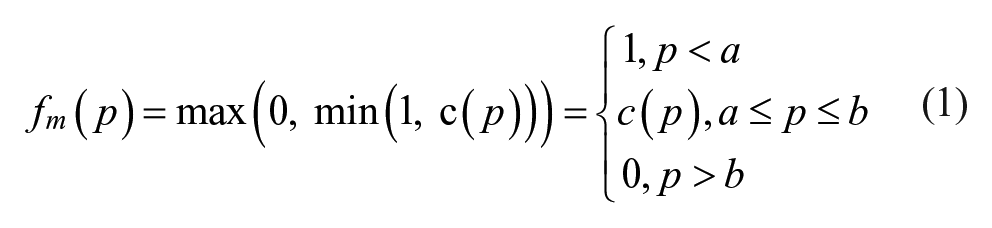
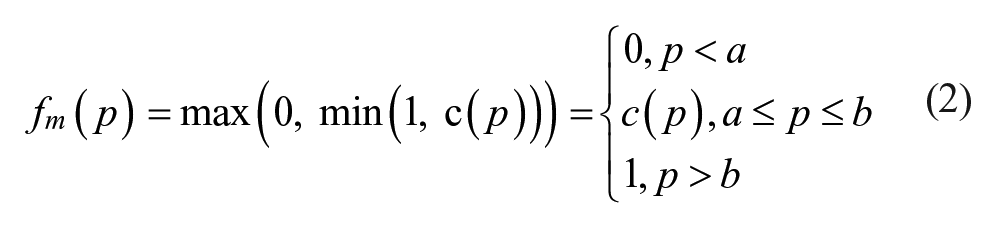
To be a valid scoring metric, the following restrictions are applied:
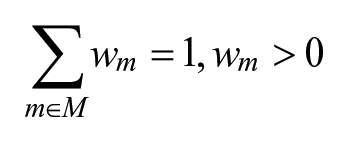
This ensures that the total weight of all metrics represents 100% of the available score. The second one concerns the scoring functions:
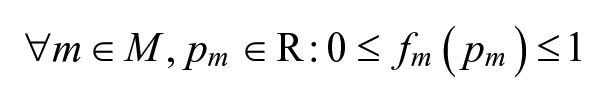
Restricting scoring functions to give a result between 0 and 1 ensures that the formerly mentioned linear combination always gives a result between 0 and 100.
In our study, we used the metrics, weights, and scoring functions noted in Table 1.
Glucose Scoring Metric Component Definitions.
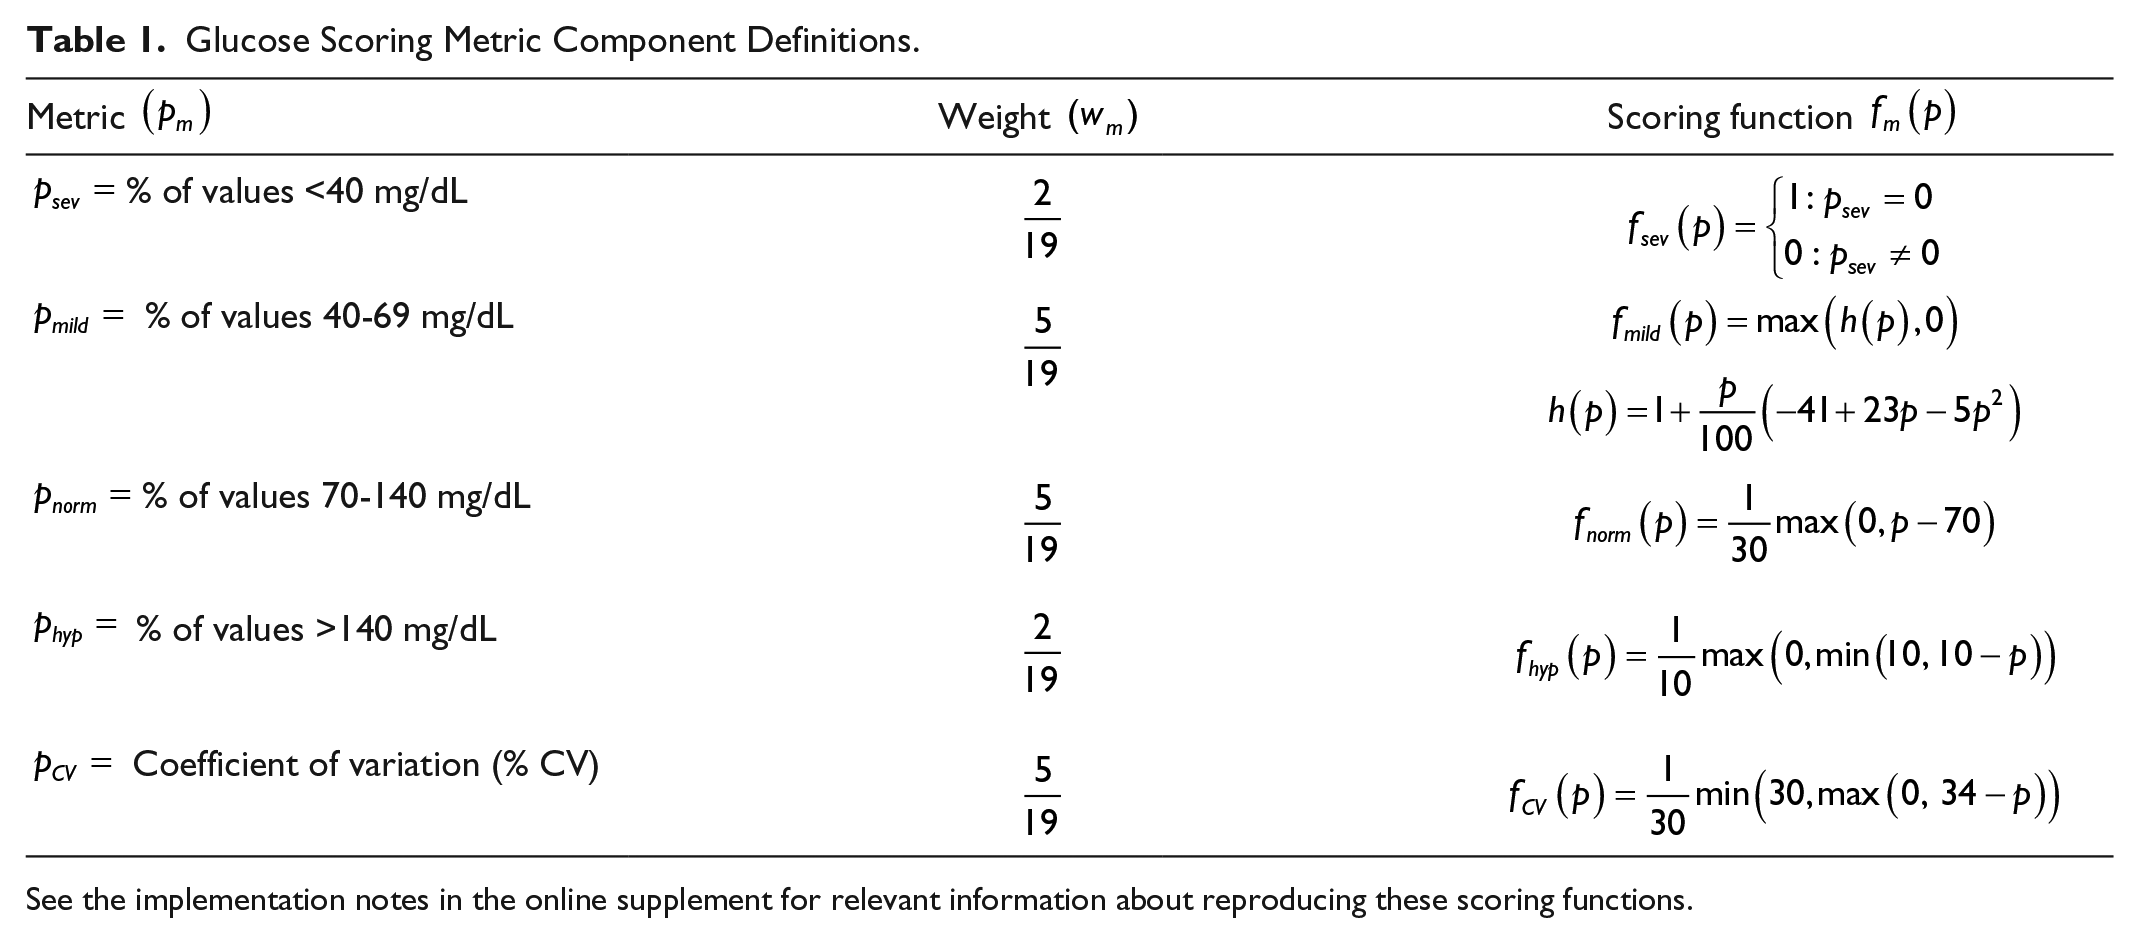
See the implementation notes in the online supplement for relevant information about reproducing these scoring functions.
We derived each scoring function and weight from previous literature on the subject alongside clinical insights from one of the authors (LD). It is increasingly rare that glucose controllers will allow a severe hypoglycemic event, so if one is observed, the controller is awarded no score for this component of the total score. As this is such a rare occurrence (<3% of simulations experienced a severe hypoglycemic event), the weight for this category is low.
In the case of mild hypoglycemia, the scoring system mentioned in our previous simulation study 15 bins all hypoglycemic (eg, <70 mg/dL) values into their integer floor, and it compares the percentage of hypoglycemic values in each bin to the percentage in each bin of the cumulative distribution given by the ideal distribution of hypoglycemic values. If the percentage observed is greater than the so called “allowed percentage,” the score is reduced by a certain amount, up to and including 0. Otherwise, it is increased by a certain amount, up to and including 0. This method is sound in principle, but it is flawed in 2 subtle ways. The first is that the score will be higher than expected if all of the hypoglycemic values are clustered around a few distinct values; in this case, the observed percentage for all values exterior to these clusters is 0, so all points are awarded in these categories, and points are only lost in categories where the hypoglycemic values are clustered. Second, the method cannot be easily calculated retrospectively, as it requires all individual glucose values and not just the overall incidence of hypoglycemia.
To rectify this issue, we propose that a polynomial be fit to the desired score for overall mild hypoglycemia, heavily rewarding mild hypoglycemia incidence of
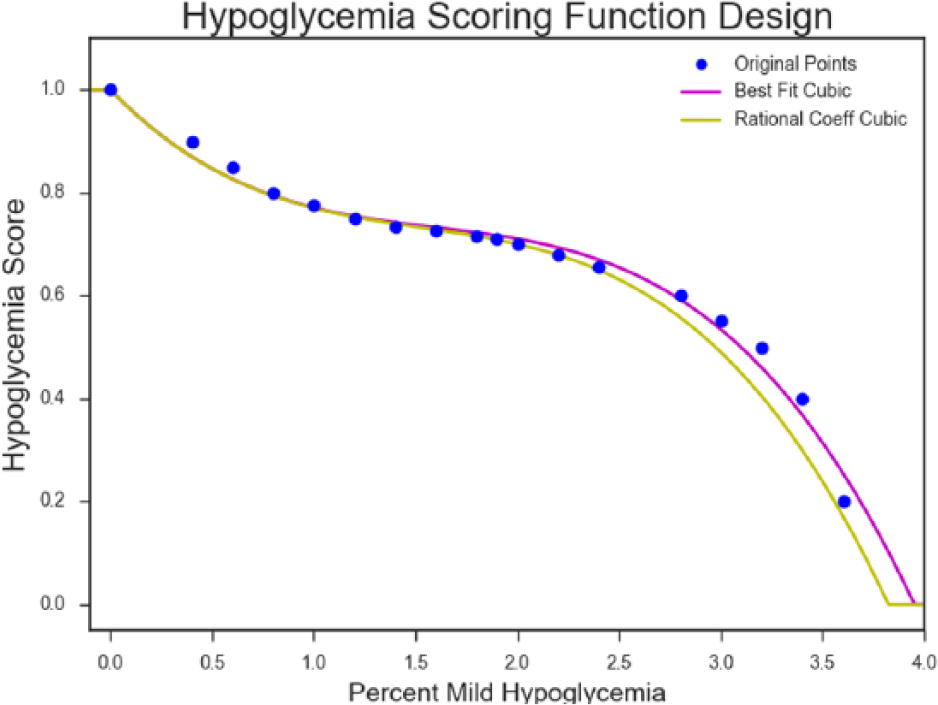
The point at (0, 1) is a fixed point in the fit we used. The rational coefficient cubic is obtained by taking the coefficients of the best fit and rounding them to the nearest hundredth, for ease of implementation. The rational coefficient cubic is the one we chose, seen as
Normoglycemia, here defined as the percentage of values falling between 70 to 140 mg/dL, is scored in a linear fashion based on the integer floor of the reported percentage. Maximum score is awarded for 100% time in normoglycemia, with 0 score being awarded for percentages <70%. Normoglycemia is awarded a larger weight than severe hypoglycemia, given the rarity of severe hypoglycemia with current controllers and that a high time in the 70-140 mg/dL range has been shown to be correlated with decreasing mortality rates. 19
Hyperglycemia, defined as the percentage of values above 140 mg/dL, is given the same lower weight as severe hypoglycemia, as we believe that as overall tight glucose control improves through use of newer control methodologies, mild hypoglycemia, time in range (70-140 mg/dL), and a measurement of dispersion such as coefficient of variation (CV) will be the most important measurements of overall glucose control. 18 The score we award is linear in the integer floor of this percentage, being maximal for no observed hyperglycemia, with no score awarded for hyperglycemia of larger than 10%.
The CV is used as a measure of dispersion. It is given the same weight as mild hypoglycemia and time in normoglycemia, as variability is a key contributor to patient outcomes.18,20 Given that reducing glucose variability is important to improving outcomes, and because reducing variance to
Under this implementation of the GSM, we define the “minimum viable controller” as the controller which achieves the best metrics that still results in a GSM score of 0. For our GSM, the minimum viable controller attains the results shown in Table 2.
Minimum Viable Controller Results.
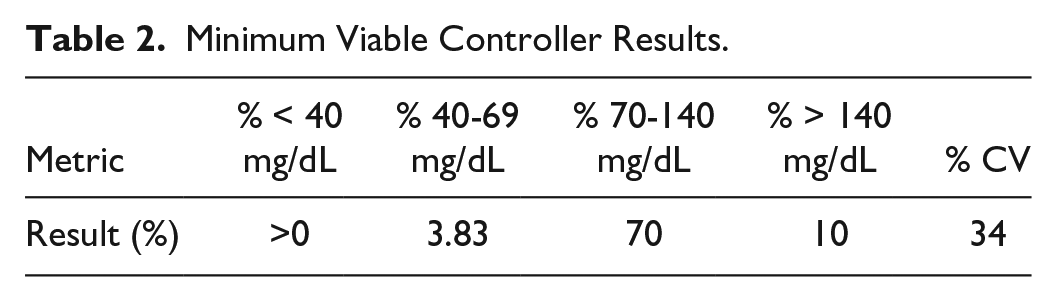
We introduce this term as a way to contextualize what our scoring system expects from clinical controllers at the bare minimum. Poor performance in the values expressed here has been linked to increased mortality rates.17,19,21
The most important feature of the GSM is that it is modular. The current metrics, scoring functions, and weights are initial suggestions for this comprehensive metric, and are meant to be modified according to which metrics are most important for patient outcomes, a topic that is still under debate in the critical care community.
18
Alternative metrics could also be included as components in the GSM, such as the letter grading given by Chassin et al.
22
Perhaps the most difficult part of adding a new metric
We employed a method to identify a critical strip
With a metric where larger outcomes are desirable, like time in range 70-140 mg/dL, the values outside the critical strip are swapped, but the end result is the same:
To compare our new scoring method to more established scoring indices, we also calculated the glycemic lability index, 23 glycemic penalty index, 24 hyperglycemic index, 25 J index, 26 and MAGE score. 27 To accommodate for variation in sampling frequencies, we normalized the glycemic lability index to represent a uniform 1-hour sampling interval for all 120 hours of simulation:
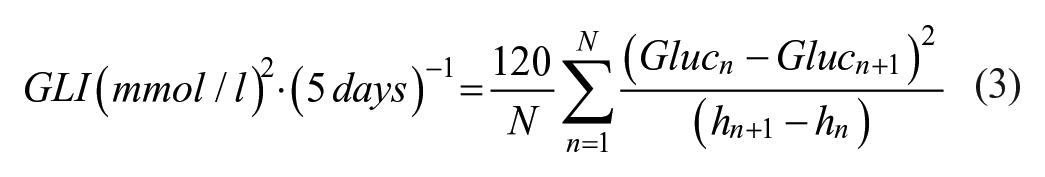
As the original article allowed for a minimum interval of every 1 hour, this normalization brings our score in line with the original method. 23 As our control range was 100-140 mg/dL, we adjusted the hyperglycemic index to score for area under the curve for values >140 mg/dL.
Simulator
We designed and implemented a new simulator to accommodate the modularity required in implementing additional glucose controllers. We adopted an object-oriented framework, with several abstract classes. The Controller class implements methods by which a given glucose controller can read glucose values from the Sensor class as often as desired, and also make control recommendations via the Prescriptions class. We designed the Prescriptions class such that controllers can make an arbitrary number of fixed control recommendations in between glucose samples, including recommendations to stop all insulin or dextrose, which is sometimes needed by controllers like the Yale protocol. The prescriptions and the cycle length, or time elapsed until the next glucose sample, are then passed to the Model class, which forward-propagates the chosen glucose insulin model 28 to the desired time in the future. The resultant glucose value is then passed through a time-variant sensor error model before being passed into the glucose controller. The general layout is shown in Figure 2.
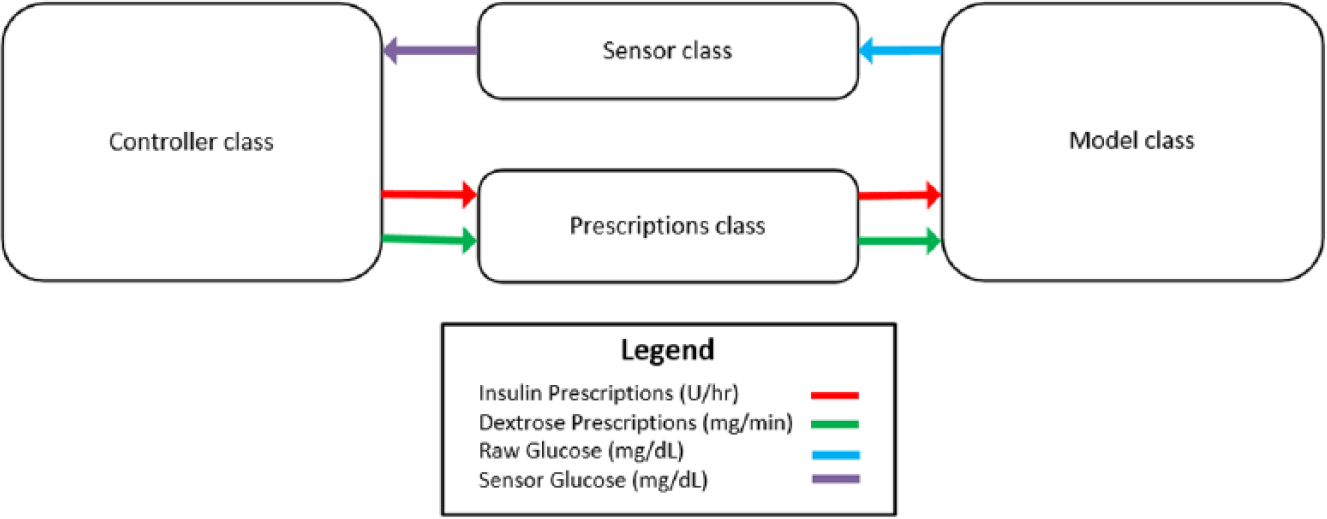
Class interfaces.
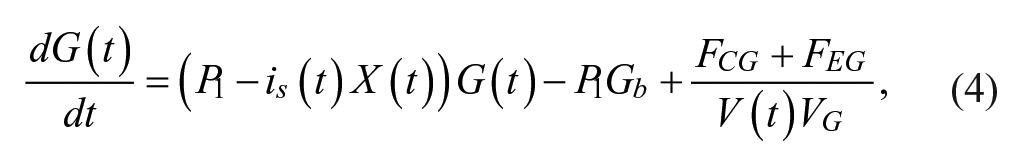
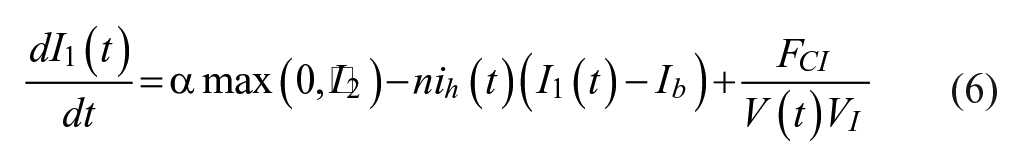
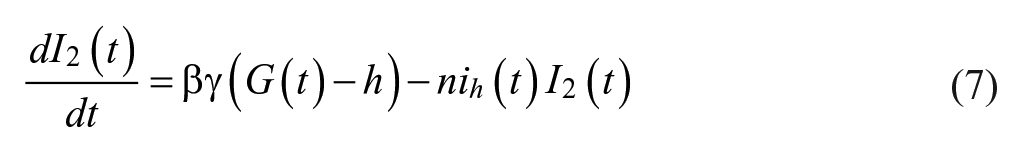
We tasked each controller with controlling 80 different simulated patients across 5 exogenous dextrose infusions for 5 in-silico days to a range of 100-140 mg/dL, except for the NICE-SUGAR controller, which was designed to control to a range of 81-108 mg/dL. We presented details of the patients and infusions used in a previous publication. 15 We employed a modified version of the Van Herpe ICU minimal model, which is described in more detail in our prior publication. 15 The modified Van Herpe model is noted in equations 4-7.
In our previous simulation study,
15
we employed a sensor error model that involved sampling from a
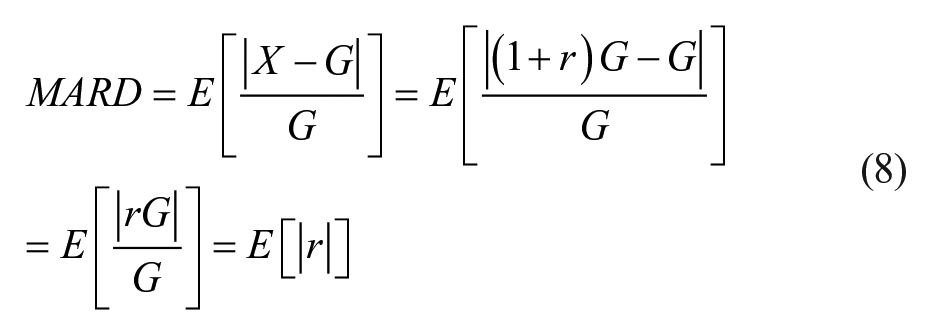
For the memoryless uniform random variable employed previously, 15 it can be seen that

While this approach does give a well perturbed signal, there is no memory inherent to the process, so it is possible to jump from
By using a random process, the relative difference has memory, and can thus be used to simulate the drift of sensor error with time. We denote the relative difference at time step
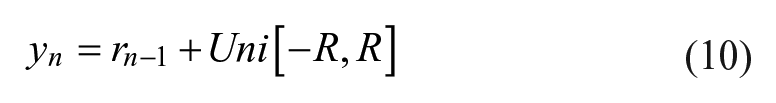
If the resultant relative difference after sampling (

The relative difference profiles that results from this process therefore does not compromise the MARD of the sensor being modelled, but produces a profile that wanders in time. This means that consecutive samples can expect to see similar relative differences, but over time, the relative difference of the sensor drifts. An extreme example of the reflection process is seen in Figure 3.
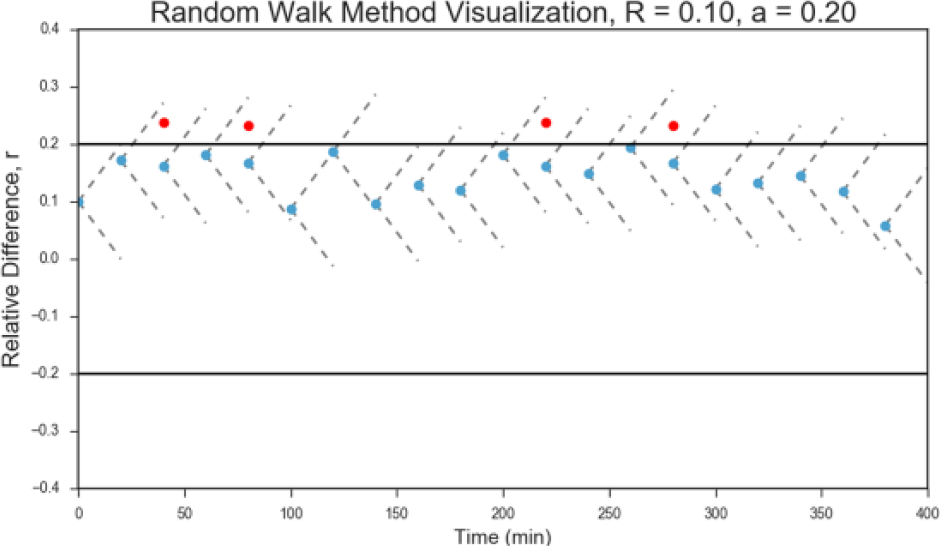
Relative difference profile of a sensor with a large drift shows frequent barrier reflections (depicted in red), with all relative differences remaining inside the expected range.
When comparing Figures 4 and 5, the benefits of the random walk method over the memoryless uniform method become apparent, as the random walk method more closely resembles the curves taken from actual continuous glucose monitors. 29
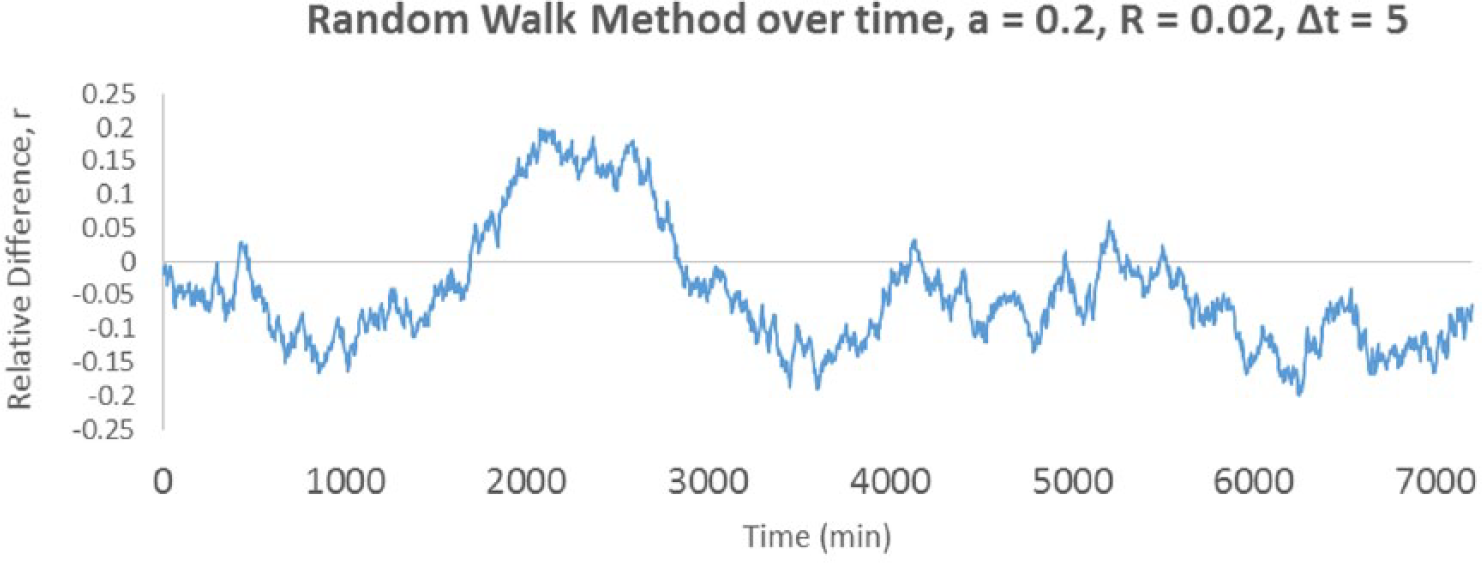
Over time, the random walk method allows the relative difference to wander within the allowed range.
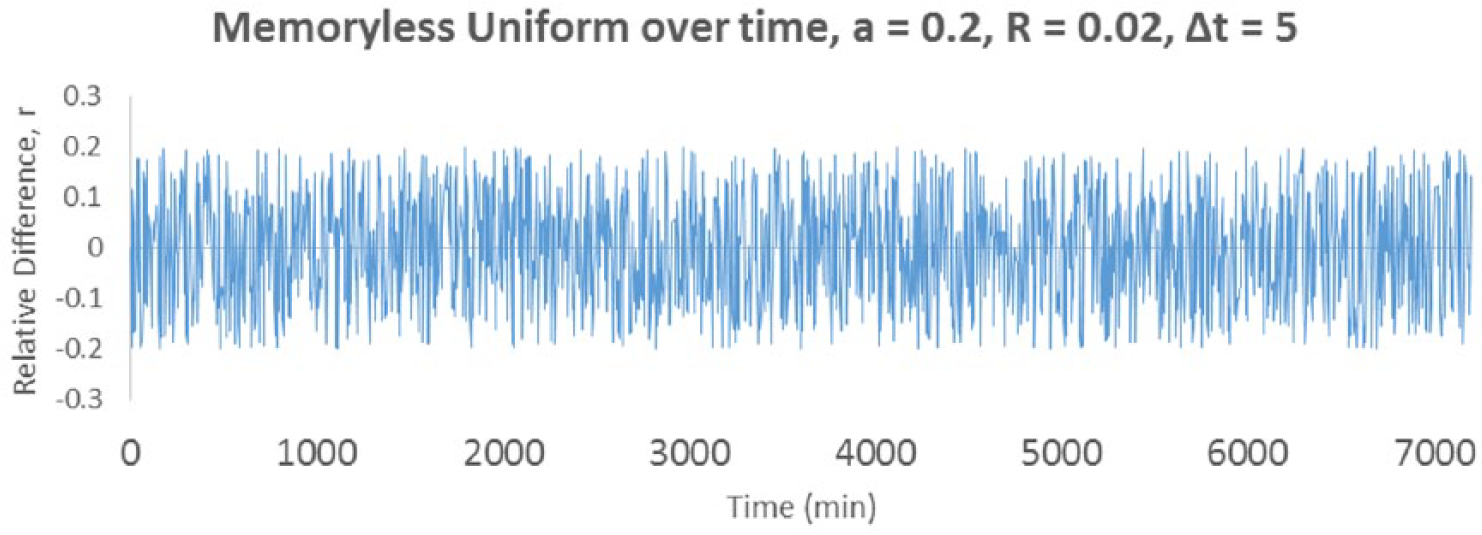
The memoryless uniform exhibits a much noisier relative difference profile.
While the random walk method of sensor error modelling is not a replacement for the autoregressive sensor error modelling seen in other publications,29,30 it does offer a lower computational overhead, a more simplistic implementation, and an MARD that is mathematically guaranteed. For the purposes of this study, we used the values in Table 3 in the sensor error model.
Random Walk Method Study Parameters.
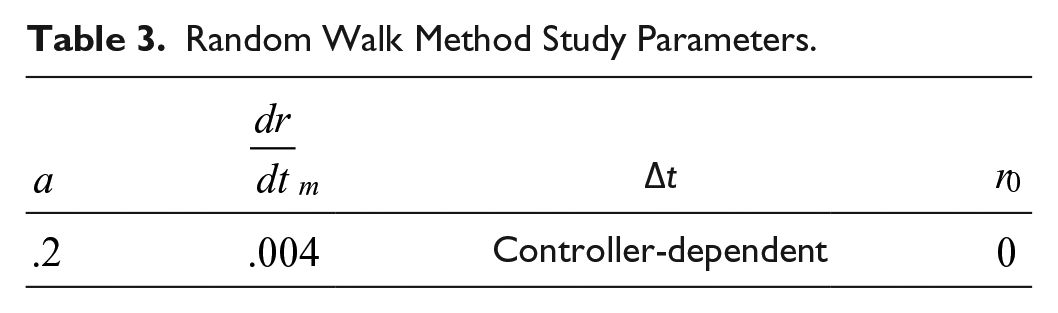
The merits and limitations of this sensor error model will have to be studied in further detail to determine applicability to clinical scenarios.
Statistical Methods
For each of the 2400 unique simulations, we calculated the mean glucose, coefficient of variation of glucose, percentage of glucose values <40 mg/dL, percentage of glucose values between 40 to 69 mg/dL, percentage of values in controller-defined range (100-140 mg/dL, with the exception of NICE which uses 81-108 mg/dL), percentage of glucose values in the normoglycemic range of 70-140 mg/dL, and percentage of glucose values >140 mg/dL. With the exception of incidence of severe hypoglycemia, all values are reported as the median and interquartile range. Severe hypoglycemia is reported as the percentage of simulations that experienced one or more severe hypoglycemic events (<40 mg/dL).
Time-Variant Model Parameters
In addition to controller flows, we perturbed our model with a time-variant insulin sensitivity, time-variant insulin half-life, time-variant insulin/glucose volume of distribution, and unannounced exogenous dextrose infusions as described in the supplement of our previous paper. 15 Time-variant model parameters were important for transforming the 2-compartment model used in the original ICU minimal model 28 into a model that features the complexity of clinical situations. As an example, consider the glucose trace achieved in Figure 6 when an exogenous dextrose infusion of 5 mg/kg/minute is applied.
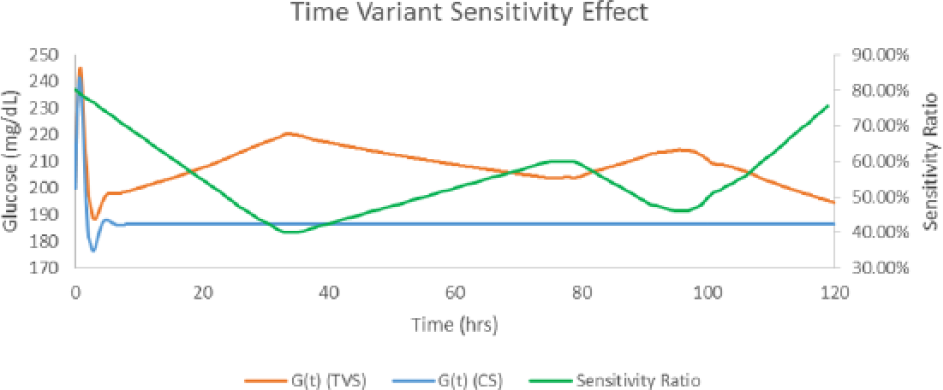
Native response with time-variant sensitivity (TVS) and without (CS). CS, constant sensitivity. Time 0 glucose = 200 mg/dL. Continuous dextrose infusion of 5 mg/kg/min.
As can be seen from Figure 6, the time-variant insulin sensitivity has significant effects on the native response to the exogenous dextrose infusion. Because the insulin sensitivity curve used was <100%, the native system was much less capable of responding to the incoming dextrose infusion. Figures 7 and 8 demonstrate the effects of time-variant insulin half-life and volume of distribution, with the latter having the least effect of the time-variant parameters.
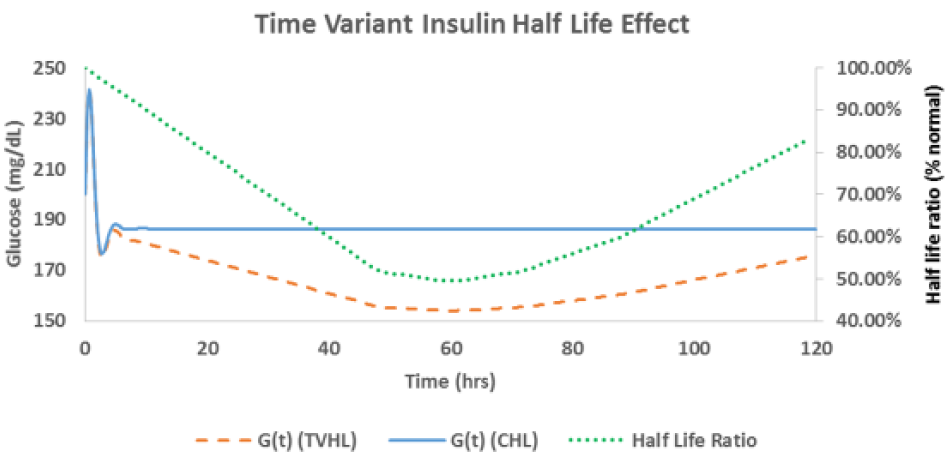
Native response with time-variant half-life (TVHL) and without (CHL). CHL, constant half-life. Time 0 glucose = 200 mg/dL. Continuous dextrose infusion of 5 mg/kg/min.
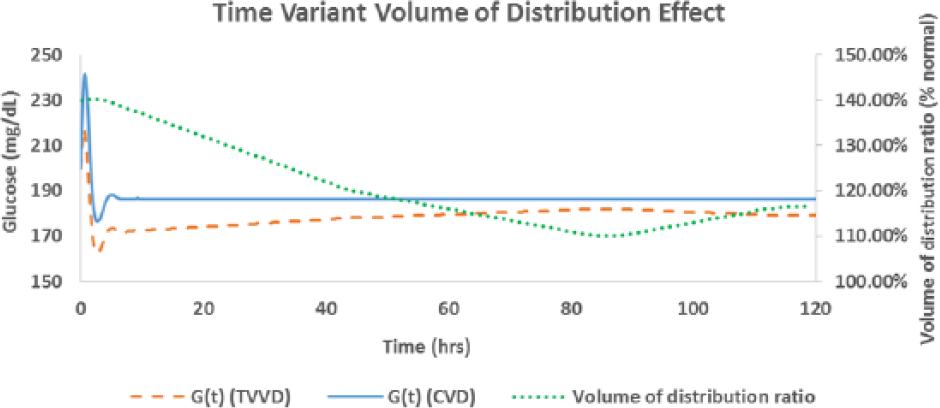
Native response with time-variant volume of distribution (TVVD) and without (CVD). CVD, constant volume of distribution. Time 0 glucose = 200 mg/dL. Continuous dextrose infusion of 5 mg/kg/min.
The insulin sensitivity underwent between day changes of 0-67%, except for 2 outliers of 150 and 600%. These insulin sensitivity changes were within the range reported by Pretty et al. 31 The insulin half-life and volume of distribution underwent between day changes in the range of 0-33%, except for one simulated trauma patient whose volume of distribution increased by 62% on day 1.
A total of 5 exogenous dextrose infusions were used; 4 were clinically relevant and 1 was a “stress test” used to evaluate the controller’s ability to deal with frequent, unannounced, random changes in the exogenous infusion. In addition, we employed 4 time-variant sensitivity curves, 3 time-variant volume of distribution curves, and 3 time-variant insulin half-life curves. We also included the unmodified original parameters, giving a total of 80 unique simulated patients to control. The details of these simulated patients can be found in the supplementary material of our previous simulation study. 15 This resulted in 400 total simulations per controller. The comparator controllers were set to cycle according to their design documents.
Results
The time in range results are presented in Table 4, with mean glucose, coefficient of variation, average infusion rates and MARD results presented in Table 5.
Comparative Simulation Study Results.
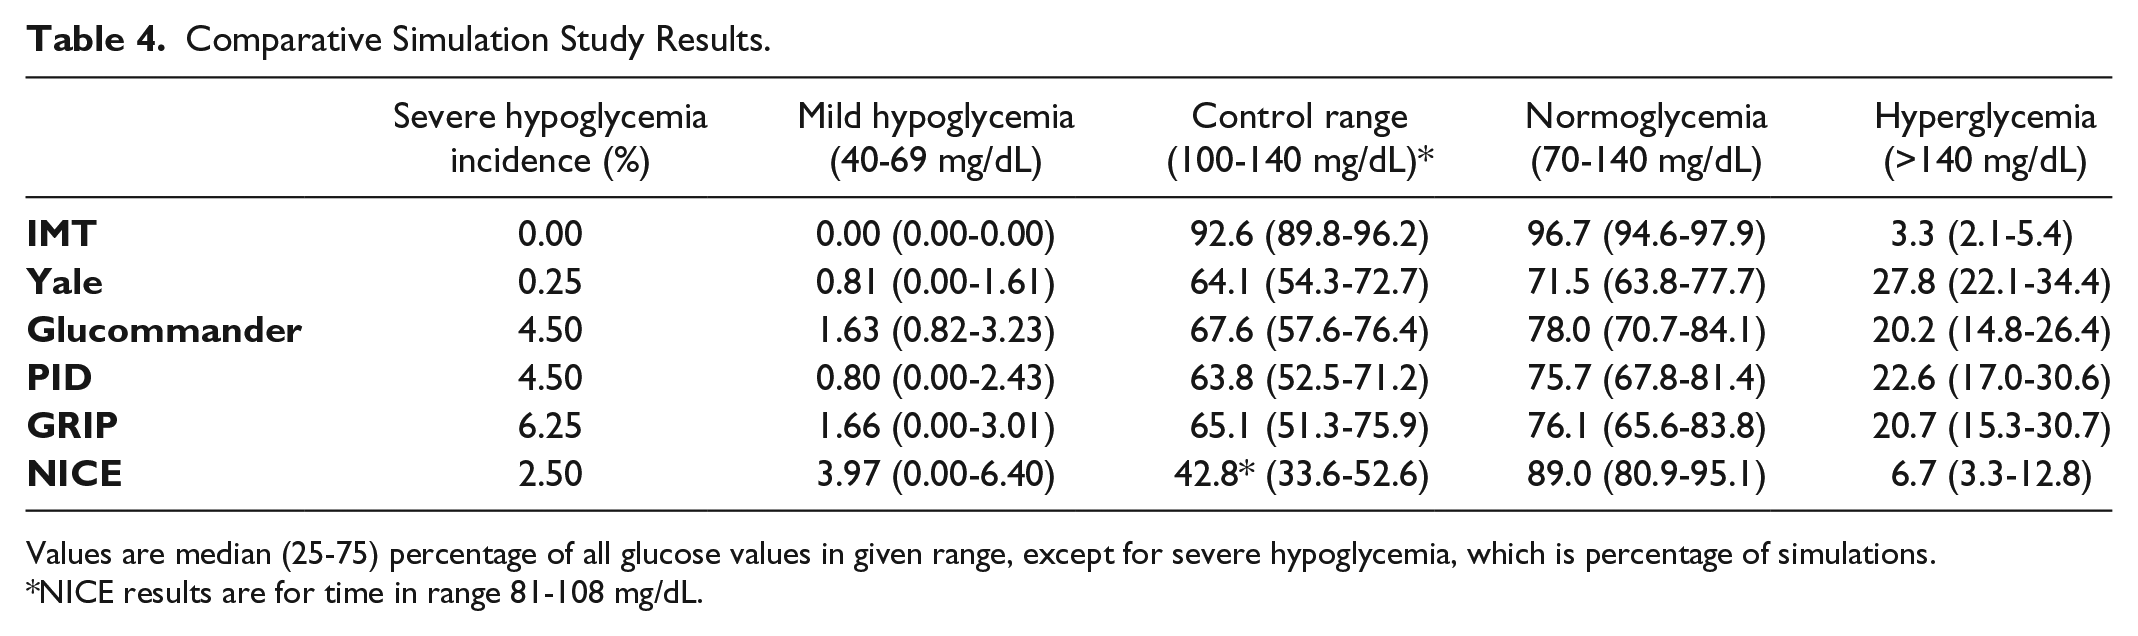
Values are median (25-75) percentage of all glucose values in given range, except for severe hypoglycemia, which is percentage of simulations.
NICE results are for time in range 81-108 mg/dL.
Central Tendency, Dispersion, Infusion Rate, and MARD Results of Comparative Simulation Study.
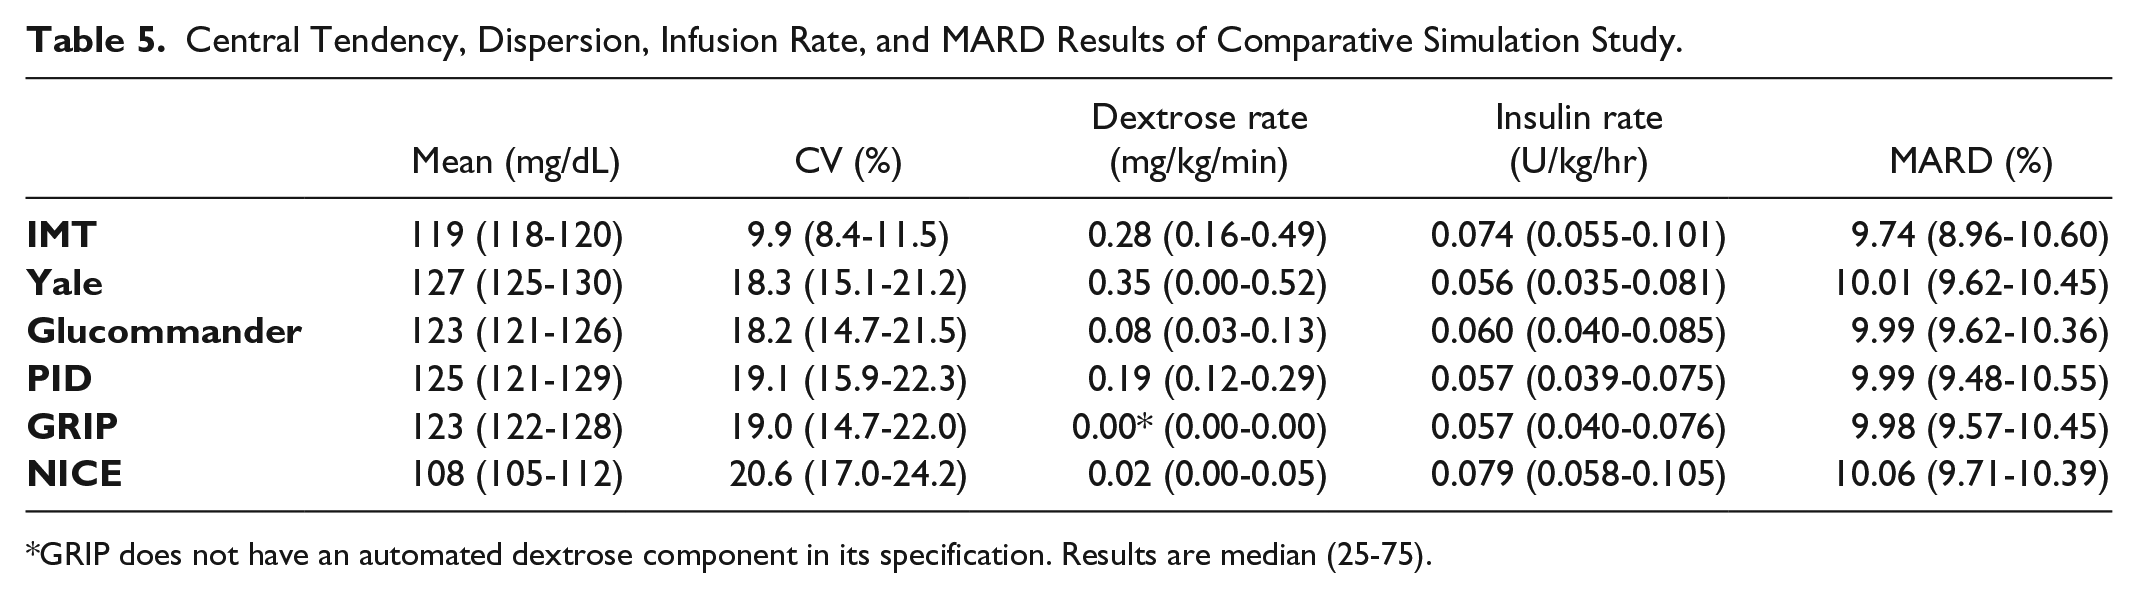
GRIP does not have an automated dextrose component in its specification. Results are median (25-75).
In addition, we computed the GSM defined in Table 1 for every controller. We present the overall score and the individual metric scores as the median and interquartile range, with the exception of the severe hypoglycemia metric, for which every controller received the same median and interquartile score of 1 (1-1). Overall score is given as a raw value, and individual metric scores are converted to a percentage of total available score for readability. The overall GSM score is noted in Figure 9, mild hypoglycemia in Figure 10, normoglycemia in Figure 11, hyperglycemia in Figure 12, and coefficient of variation in Figure 13.
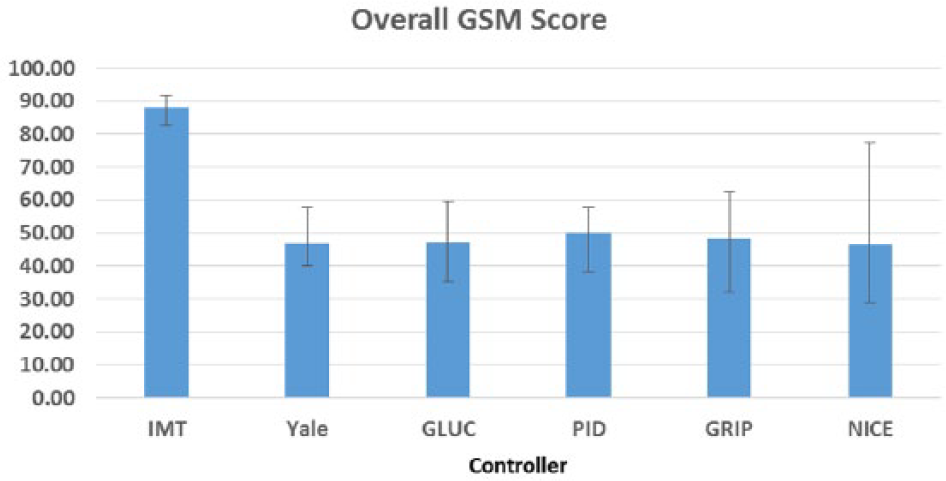
Overall GSM scores by controller. Results are median (25-75).
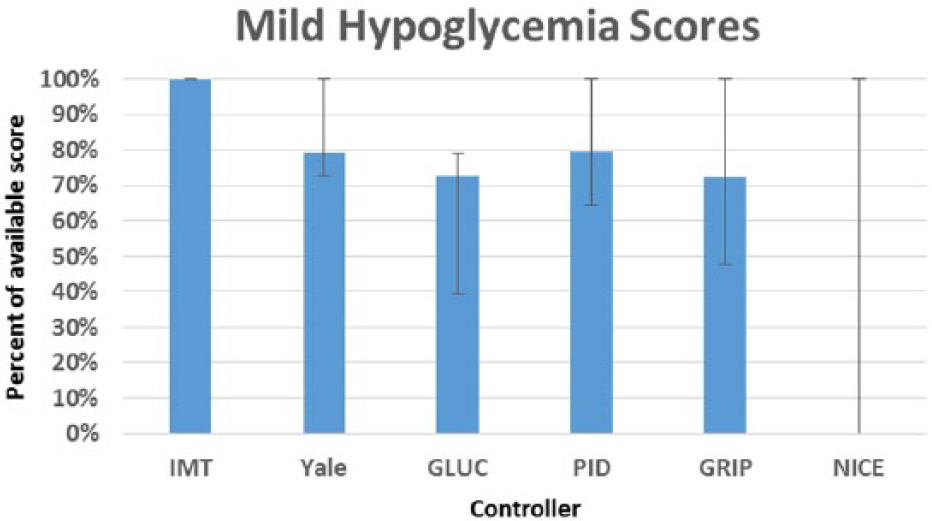
Mild hypoglycemia (40-69 mg/dL) scores by controller. Results are median (25-75).
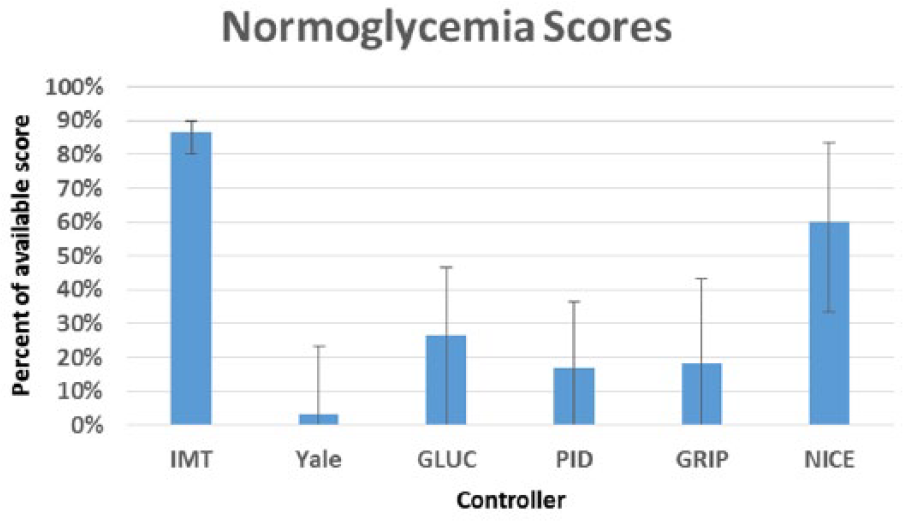
Normoglycemia (70-140 mg/dL) scores by controller. Results are median (25-75).
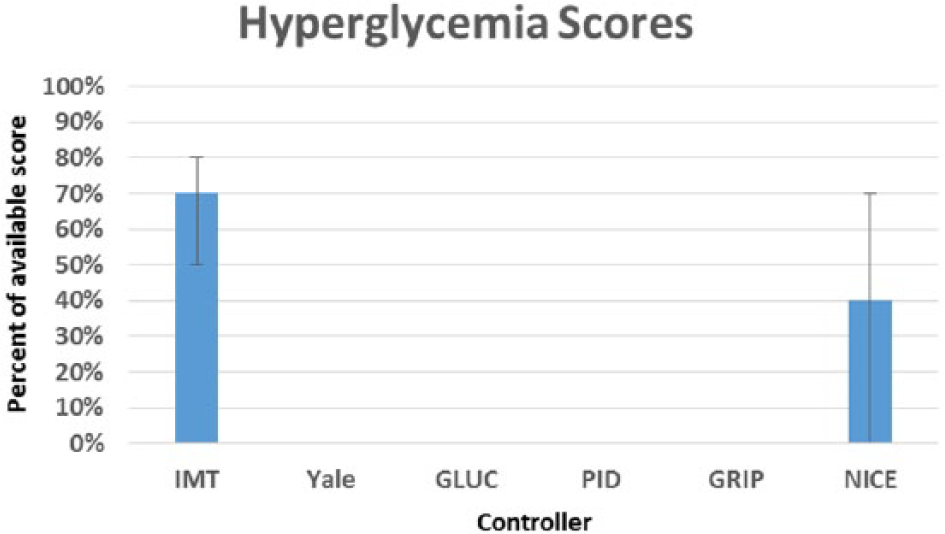
Hyperglycemia (>140 mg/dL) scores by controller. Results are median (25-75).
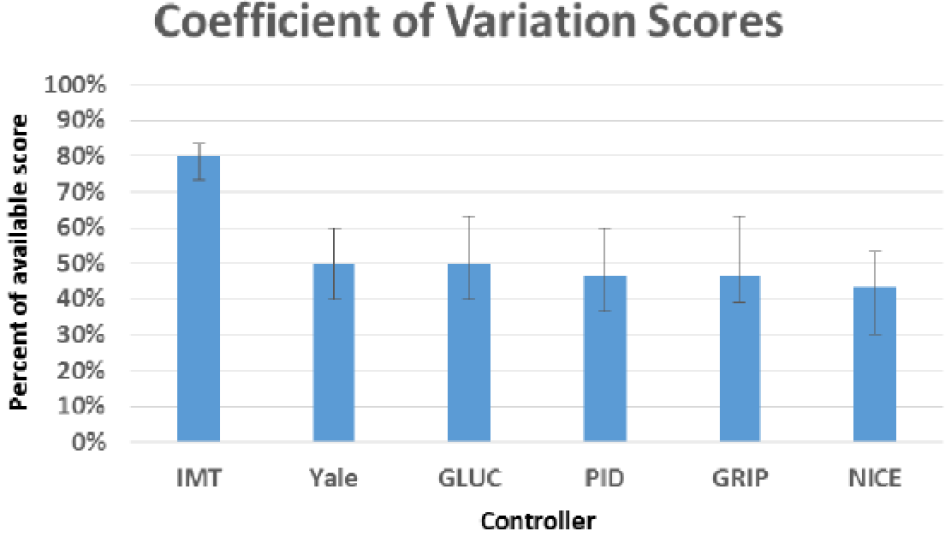
Coefficient of variation scores by controller. Results are median (25-75).
Table 6 shows the results of the overall GSM score in addition to the glycemic penalty index (GPI), glycemic lability index (GLI), hyperglycemic index (HI), J index, and mean amplitude of glycemic excursion (MAGE) score.
All Controllers Controlled to a Range of 100-140 mg/dL, Except NICE, Which Controlled to a Range of 81-108 mg/dL.
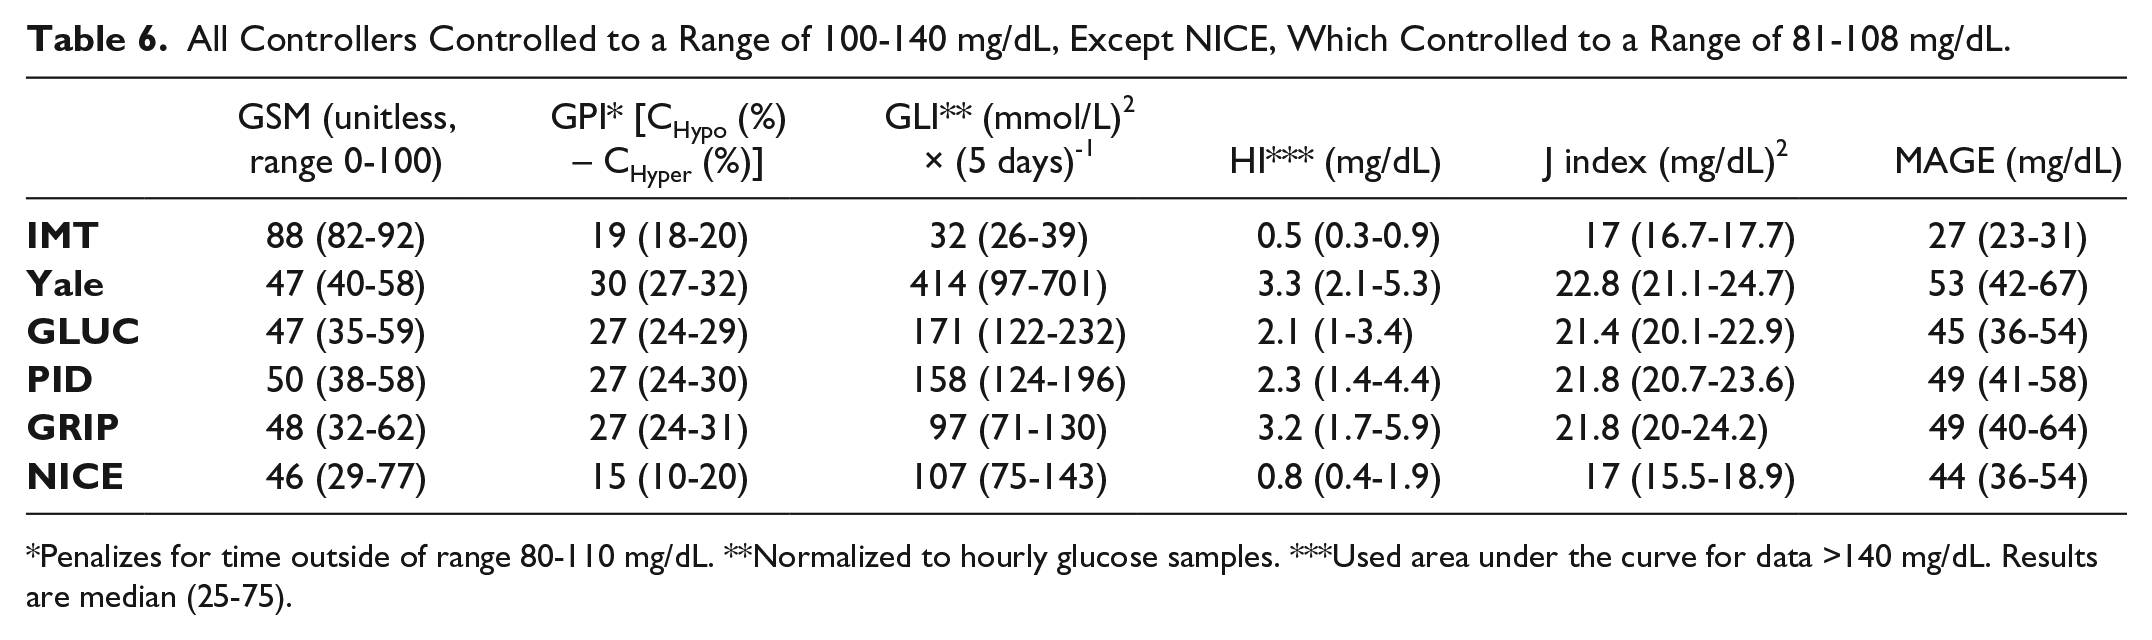
Penalizes for time outside of range 80-110 mg/dL. **Normalized to hourly glucose samples. ***Used area under the curve for data >140 mg/dL. Results are median (25-75).
Figure 14 shows the glucose versus time curves for all 6 controllers for a single simulation scenario. The sensor error model was turned off for this scenario to allow for smoother curves and improved legibility.
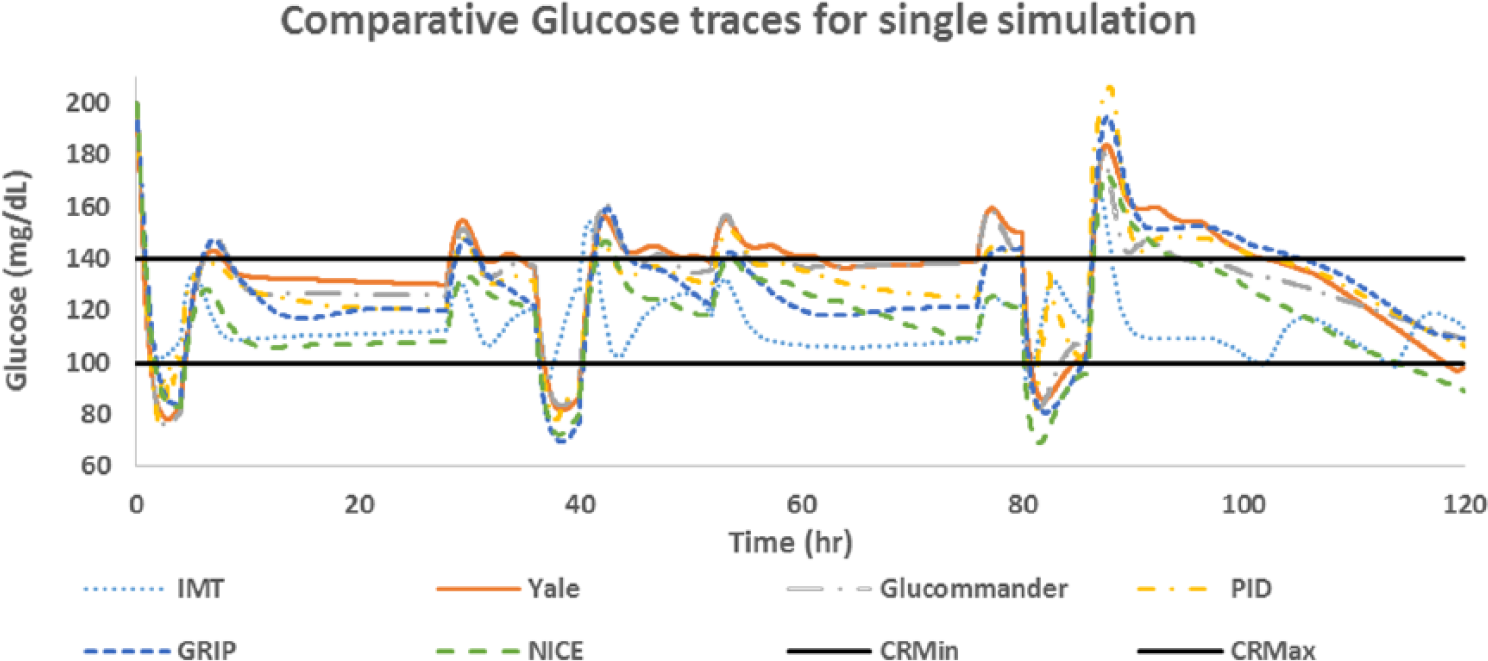
Individual glucose traces for one test scenario with starting glucose 200 mg/dL. All controllers controlled to a range of 100-140 mg/dL, except NICE, which controlled to a range of 81-108 mg/dL. CRMin, control range minimum = 100 mg/dL; CRMax, control range maximum = 140 mg/dL.
Discussion
Effective glucose control in the ICU setting has the potential to save lives 3 and to decrease the economic burden of health care.32-36 However, it is difficult to compare the numerous publications on this subject as they frequently report different results. While there is some consensus on how to report individual glucose metrics, 7 having a universal glucose control metric will be instrumental in future development of closed loop glucose controllers. While there has been some early work done on developing a universal glucose control metric for type 1 diabetes, 22 the only global index attempted for ICU patients was based on a normoglycemia range of 80-110 mg/dL, 24 which is no longer the recommended control range. 37 As glucose control in the ICU setting continues to evolve toward closed loop control, a global score of overall glucose control will allow researchers to compare different glucose control methods as they attempt to find the most efficacious control strategy. To be useful, such a score should utilize the most commonly reported glucose metrics that have also been shown to be predictive of patient outcomes. 18
In creating the GSM, we chose the commonly reported individual glucose metrics of severe hypoglycemia (<40 mg/dL), mild hypoglycemia (40-69 mg/dL), time in normoglycemic range (70-140 mg/dL), time in hyperglycemic range (>140 mg/dL), and percentage coefficient of variation. We weighted the GSM more heavily toward mild hypoglycemia, time in normoglycemic range, and coefficient of variation as previous publications have indicated these are the most important in determining mortality rates,18,19 and we believe that as future glucose control methodologies become more effective, severe hypoglycemia and severe hyperglycemia will mostly be eliminated. Our global GSM score represents an attempt to create a universal score that can be utilized by different authors to report on the overall effectiveness of their glucose control. We expect that the weighting of this score will change once it is validated against clinical results such as mortality rates. The modular nature of our scoring system will allow for easy substitution or addition of different individual glucose metrics, assuming such modifications have been proven through robust clinical studies to be superior to those we have proposed. The GSM also has the potential to have differing realizations according to the group being evaluated, including an individual GSM for individuals with type 1 or type 2 diabetes, general hospital admissions, ICU care, and so on.
We performed a simulation study to compare 5 currently utilized ICU glucose controllers to our novel AI-based glucose controller using the GSM. For each controller we measured the 5 individual glucose metrics that are part of the GSM, and calculated the overall GSM. As can be seen from Tables 4 and 5, our AI-based glucose controller outperformed all 5 of the comparator controllers across the majority of the individual metrics. The AI-based controller achieved a high time in range and low CV while at the same time avoiding any hypoglycemic events when the control range was set to 100-140 mg/dL. Our overall GSM score was 76% better than the next best controller: the Wintergerst PID controller. As noted in Table 6, our AI-based controller on the whole outperformed the other controllers using currently accepted and validated scoring metrics. Although the results in Table 6 do not serve to validate the GSM scoring metric, they do show that it is at least consistent with the other indices in assessing overall controller performance. It should be noted that the NICE-SUGAR controller was the least effective controller tested based on the GSM score, which may potentially explain the lack of positive findings in the NICE-SUGAR study. 38
The AI controller achieved its enhanced control through improved dosing methods of insulin and/or dextrose, as it did not have the maximal infusion rates for either insulin or dextrose as noted in Table 5. One of the reasons the AI-based glucose controller outperforms the other controllers is its short cycle interval of every 5-10 minutes. The other controllers cycle themselves only once every 20-120 minutes, thus they are incapable of maintaining control when there are rapid changes in the glucose versus time curve, such as during rapid changes in exogenous dextrose infusion rates or in insulin sensitivity. As the AI controller was patterned after the native system, which releases variable quantities of insulin every 5 minutes and can quickly change hepatic glucose output in an effort to maintain euglycemia, 39 from its inception it was designed with a rapid cycle interval in mind. In internal testing the AI controller remains significantly more effective than Glucommander and PID, even when these controllers are set to cycle every 10 minutes. The latter results are reflective of the AI controllers control to range strategy, and use of current glucose value in relation to the desired control range, glucose rate of change, and weight-based insulin/dextrose doses when making all control decisions.
Effective glucose control in the ICU setting that achieves a high time in range while at the same time avoiding any hypoglycemia and minimizing variability has the potential to significantly decrease morbidity and mortality rates, while at the same time lowering overall length of stay and thus health care costs. To date, only one study has been performed that has achieved these goals. 40 In this Japanese study on hepatobiliary-pancreatic surgery patients, the tight glucose control group had a 58% reduction of their surgical site infection rate, and a 21% reduction of their length of stay. As our AI-based controller achieves results in simulation testing that are at least as good as those achieved in the Japanese study, we are hopeful that it will hold up to the challenging environment of the ICU setting and be available as the control arm of an artificial pancreas system.
Conclusion
The GSM proposed in this study successfully allows for direct comparison of different glucose control methodologies. The AI-based glucose controller that we tested outperformed all of the currently in-use ICU-based glucose controllers to which we compared it in this simulation study.
Footnotes
Abbreviations
AI, artificial intelligence; CHL, constant half-life; CS, constant sensitivity; CV, coefficient of variation; CVD, constant volume of distribution; CRMax, control range maximum; CRMin, control range minimum; GLI, glycemic lability index; GLUC, Glucommander; GPI, glycemic penalty index; GSM, Glucose Scoring Metric; HI, hyperglycemic index; ICU, intensive care unit; IMT, Ideal Medical Technologies; MAGE, mean amplitude of glycemic excursion; MARD, mean absolute relative difference; NICE, NICE-SUGAR; PID, Wintergerst et al PID controller; TVHL, time-variant half-life; TVS, time-variant sensitivity; TVVD, time-variant volume of distribution; YALE, Yale protocol.
Declaration of Conflicting Interests
The author(s) declared the following potential conflicts of interest with respect to the research, authorship, and/or publication of this article: LD and JD are stock holders in Ideal Medical Technologies Inc.
Funding
The author(s) received no financial support for the research, authorship, and/or publication of this article.
Supplementary Material
Supplementary material is available for this article online.
References
Supplementary Material
Please find the following supplemental material available below.
For Open Access articles published under a Creative Commons License, all supplemental material carries the same license as the article it is associated with.
For non-Open Access articles published, all supplemental material carries a non-exclusive license, and permission requests for re-use of supplemental material or any part of supplemental material shall be sent directly to the copyright owner as specified in the copyright notice associated with the article.