
Abstract
Aims:
Cardiac autonomic reflex tests (CARTs) are time consuming and require patient cooperation for detecting cardiac autonomic neuropathy (CAN). Heart rate variability (HRV) analysis requires less patient cooperation and is quicker to complete. However the reliability of HRV results as a clinical tool, with respect to length of recording and accuracy of diagnosis is inconclusive. The current study investigated the reproducibility associated with varying length of recording for early CAN (eCAN) assessment.
Methods:
Participants were 68 males, 72 females with average age of 55 for controls and 63 for early CAN. Inclusion criteria were that participants were medication free and presented with no comorbidities. ECGs of control and eCAN were recorded and heart rate changes analyzed with the fast Fourier transform (FFT) and Lomb-Scargle periodogram (LSP). Ten-second to 5-minute recordings were extracted from a 15-minute lead-II ECG and accuracy in assessment of eCAN determined.
Results:
The eCAN group was older (P < .001) and systolic blood pressure was higher (P < .01). HDL-cholesterol was also higher in the eCAN group (P < .05). HRV analysis showed that both FFT and LSP results were significantly different between eCAN and control down to a 10-second ECG length for low frequency (LSP: P = .013, FFT: P = .024) and high frequency (HF-LSP: P = .002, FFT: P = .002) power. eCAN assessment was optimal down to 90-second recordings with a sensitivity of 100% and specificity of 29.49%.
Conclusion:
HRV is suitable for clinical practice from ECG recordings of more than 90 seconds with high accuracy and repeatability within a session for each participant.
Keywords
Consultation length in general practice is characterized by many factors but, in general, the available time of the general practitioner or health care professional is decreasing, while chronic diseases such as obesity, diabetes, cardiovascular disease, and mental health require increasing consultation times. 1 In addition, general population health checks, that may identify early asymptomatic disease is also decreasing due to time available and cost. 2 However diabetes has quadrupled in the past three decades and its complications including CVD are on the rise requiring simple and accurate diagnostic tests for clinical practice.3,4 Diabetes is characterized by an increase in coronary artery disease as well as arrhythmia and sudden cardiac death. Several pathophysiological mechanisms are responsible for some cardiac arrhythmias including cardiac autonomic neuropathy (CAN), which is a major complication of type 1 and type 2 diabetes (T2DM) and contributes to the high CVD-related mortality in diabetes.5,6 Prevalence of CAN varies between 2.5%, as reported in the Diabetes Control and Complications Trial (DCCT) up to 90% of people with type 1 diabetes.7,8 Beat to beat alterations in heart rate and blood pressure determined by cardiac autonomic reflex tests (CARTs) have been shown to be significantly different in diabetes patients compared to a healthy population sample without diabetes. 9 CARTs consist of dynamic heart rate and blood pressure tests, which identify parasympathetic and sympathetic pathology. Based on five tests included in CARTs, disease progression can be categorized into early CAN, definite CAN, and severe CAN. However CARTs require cooperation by the patient being assessed, and controlling for confounding factors. 10 CARTs are also time consuming, taking between 30-45 minutes to complete and therefore not routinely used in primary care as the usual review time in general practice has been decreasing and is currently reported to be on average 10-15 minutes.11,12 Robust methods that reduce the time required for a clinical diagnosis of CAN are required to identify individuals with CAN to allow for preventative treatment and thus to reduce the associated burden of CAN disease progression. Alternative diagnostic methods to the CARTs or in addition to CARTs have been investigated including heart rate variability (HRV) analysis.13,14 For HRV to be a useful clinical tool, accuracy, robustness against ectopic beats, consistency between successive analysis of ECG recordings and the use of short ECG recordings (preferably less than 5 minutes) need to be addressed and optimal. 15
Heart Rate Variability
Heart rate variability refers to the beat-to-beat alterations in heart rate. Under resting conditions individuals exhibit periodic variations in the distance between each R peak (RR interval) of a QRS wave of an ECG that fluctuate with the phases of respiration and other physiological and pathological variables.
The most often used methods to determine HRV are time and frequency domain analysis. 16 The fast Fourier transform (FFT) is the preferred method in HRV analysis due to its simplicity and high processing speed but has a number of shortcomings. FFT assumes a regularly sampled time series, so to deal with HRV the ECG or heart rate data requires resampling and interpolation. 17 In addition, it is sensitive to noise, ectopic beats, and is coupled to respiratory rate.18,19 The Lomb-Scargle periodogram (LSP) has been proposed as an alternative for HRV analysis as it does not require regularly sampled data or stationarity, and is robust against ectopic beats.17,20-22 The Task Force for HRV analysis and the more recent Toronto Consensus Panel have recommended an optimal recording length of 5 minutes for FFT to obtain meaningful high and low frequency results and to avoid the nonstationarity effects that characterize longer recordings.16,23 However in clinical practice, 10-second ECG recordings to identify rhythm anomalies are the initial preferred approach. Therefore a robust algorithm that allows accurate identification of cardiac pathology from raw recordings of shorter time periods that provides consistent robust results is an important addition to supporting clinical decision-making. 24 The current research investigated the variation in accurately diagnosing early CAN (eCAN) from ECG recordings with varying lengths and analyzed at different time points when applying FFT and LSP.
Methods
The Diabetes Health Clinic aims at identifying not only overt diabetes but also risk of diabetes and screens healthy people as well as those with diabetes, hypertension, cardiovascular disease, and other comorbidities associated with type 1 and type 2 diabetes mellitus. The current study group was free of diabetes and any associated comorbidities. All participants included in the study were free of any medication that could influence heart rate such as antihypertensive or antiarrhythmic medication. Participants attending a diabetes health screening clinic (DiabHealth), provided informed consent prior to having their ECG recorded for 20 minutes after abstaining from coffee, tea, alcohol, cigarettes and excessive exercise for 24 hours and a 5-minute supine rest. 25 A 15-minute recording was then extracted to allow for start-up and movement artefacts at the end of the recording period. Initial screening of participants led to the exclusion of those with heart disease, presence of a pacemaker, kidney disease or medication use, including antihypertensive and antiarrhythmic medication, that could affect HRV. The University Human Ethics Committee approved the study, which followed the Helsinki protocol for ethical conduct. All participants were informed of the nature of the research and consented to their data being used. FFT and LSP power spectral densities were determined from heart rate data after preprocessing and removal of noise and ectopic beats from the ECG signals implementing the smoothness priors approach. 26 Lead II ECGs were recorded for 20 minutes for each participant using a Maclab Pro with Chart 7 software (ADInstruments, Sydney) and the middle 15-minute segment selected for analysis. Early CAN was determined using the five recommended CARTs as the gold standards. CARTs used in clinical diagnosis for cardiac autonomic neuropathy include three heart rate tests and two blood pressure tests as originally described by Ewing and Clarke. 9 Heart rate tests include lying to standing change in heart rate, deep breathing and the Valsalva test. Blood pressure changes are assessed during a lying to standing task and handgrip task. Early CAN is defined by one of the heart rate tests being abnormal or two borderline.9,27
Seventy-one participants without CAN and 69 participants with early asymptomatic CAN attended the screening clinic (Table 1).
Patient Clinical and Demographic Data.
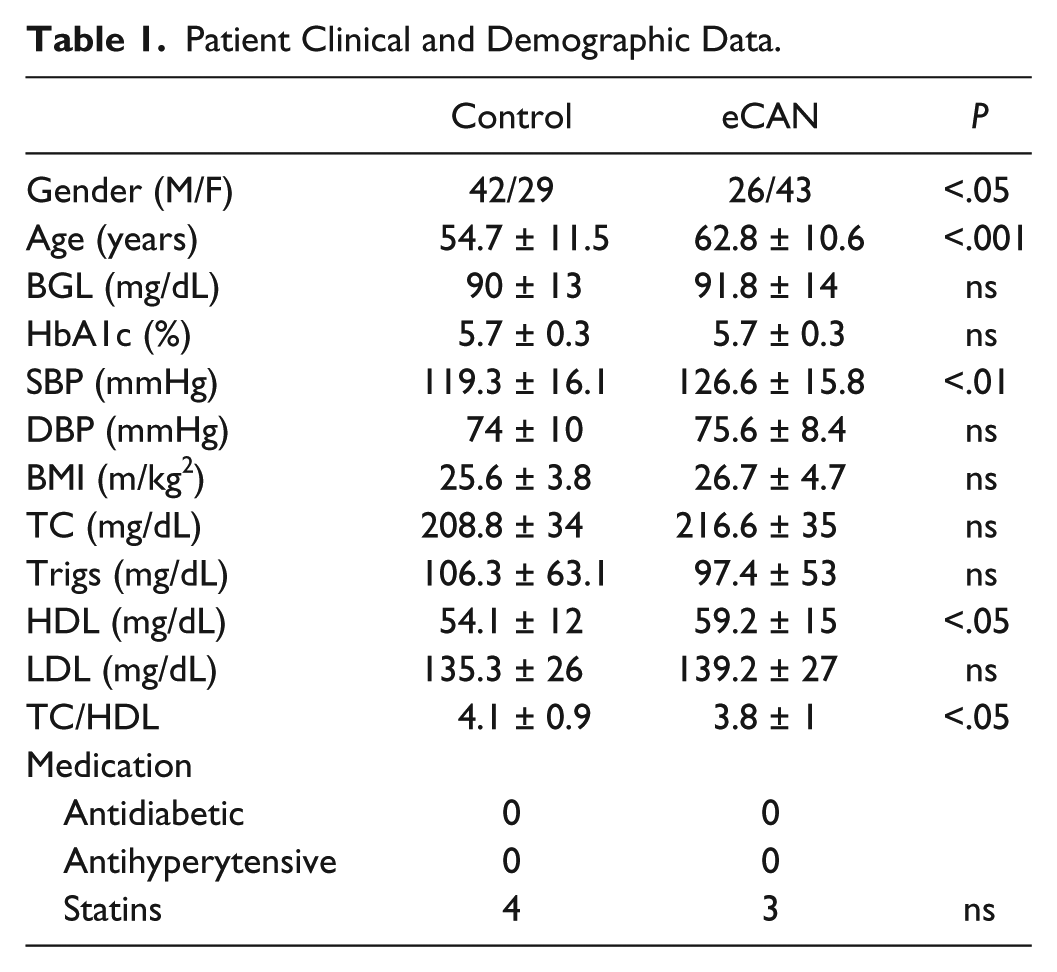
Gender, age SBP, HDL, and TC/HDL were significantly different between the two groups. However clinical findings were either normal or borderline in both groups as determined by the primary health care physician. High-density lipoprotein (HDL) was higher in the early CAN group but low-density lipoprotein (LDL) and triglycerides were not significantly different between the two groups.
For HRV analysis, start-up artifacts and movement artifacts at the end of the recording were removed by using the middle 15-minute segment. Raw heart rate periodograms had their baseline removed by subtracting the mean value of the RR interval from the RR data as part of the preprocessing step. Experiments made use of both clean (preprocessed) data, and raw data (without preprocessing).
To assess the power spectral densities for different window sizes (length of recording) across the overall recording length of 15 minutes (900 seconds), the recording was divided into a set of time windows with different window sizes and offsets. The window sizes analyzed in this study are 10, 20, 30, 60, 90, 150, 300, and 600 seconds. The offset starts at 0 seconds and then moves across the 900-second recording in steps of 2 seconds. The division of the recording into time windows is illustrated in Figure 1.
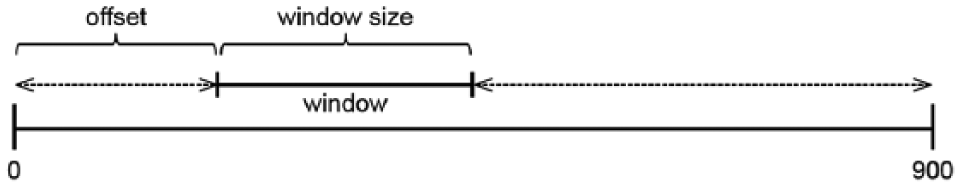
Division of the recording into time windows with different window sizes and offsets.
Power Spectral Analysis
The Lomb frequency domain analysis was conducted with the Physionet HRV toolkit (http://physionet.org/tutorials/hrv-toolkit). FFT frequency domain were obtained using the Matlab HRV toolbox by Kaplan and Staffin (http://www.macalester.edu/~kaplan/hrv/doc/). For both FFT and LSP frequency domain analysis, the power spectrum of interbeat intervals was separated into two bands: low frequency (LF) between 0.04 and 0.15 Hz and high frequency (HF) between 0.15 and 0.40 Hz as recommended by the HRV Task Force. 28
After the spectral power in the LF and HF domain was computed for both FFT and LSP, results were analyzed using a nonparametric area under the ROC curve approach (roctab) for each of the time windows. This analysis enabled determination of how accurate the LF and HF spectral powers classified early CAN. The points on the nonparametric ROC curve are determined by applying each possible outcome of the diagnostic test as a classification cutoff point and computed the corresponding sensitivity and specificity. Points are connected and the AUC determined using the trapezoidal rule. From this analysis the standard error can also be determined. P-values for group comparisons are also provided from the average values of the results of the bilateral Mann-Whitney U tests between the LF and HF values for control and early CAN groups. Finally the results were corrected for heart rate and the variation between successive HRV analyses with the differing time windows assessed.
Results
The power spectral density results for both LSP and FFT are shown in Figure 2. Early CAN showed lower FFT and LSP spectral powers compared to the control group. Although not significant, the LSP was more sensitive than FFT for discriminating early CAN in the low frequency spectral power range.
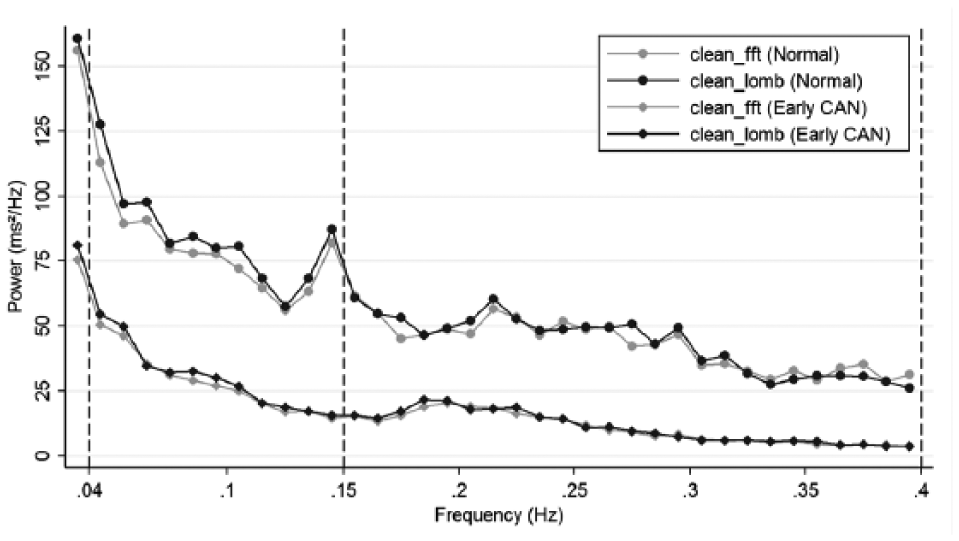
Power spectrum plot of heart rate from clean (preprocessed) data using LSP and FFT, for normal and early CAN groups. The vertical lines indicate the extent of the LF spectrum (left) and the HF spectrum (right).
Figures 3 and 4 show the average values, standard deviations and P values of the actual LF and HF values for increasing recording lengths.
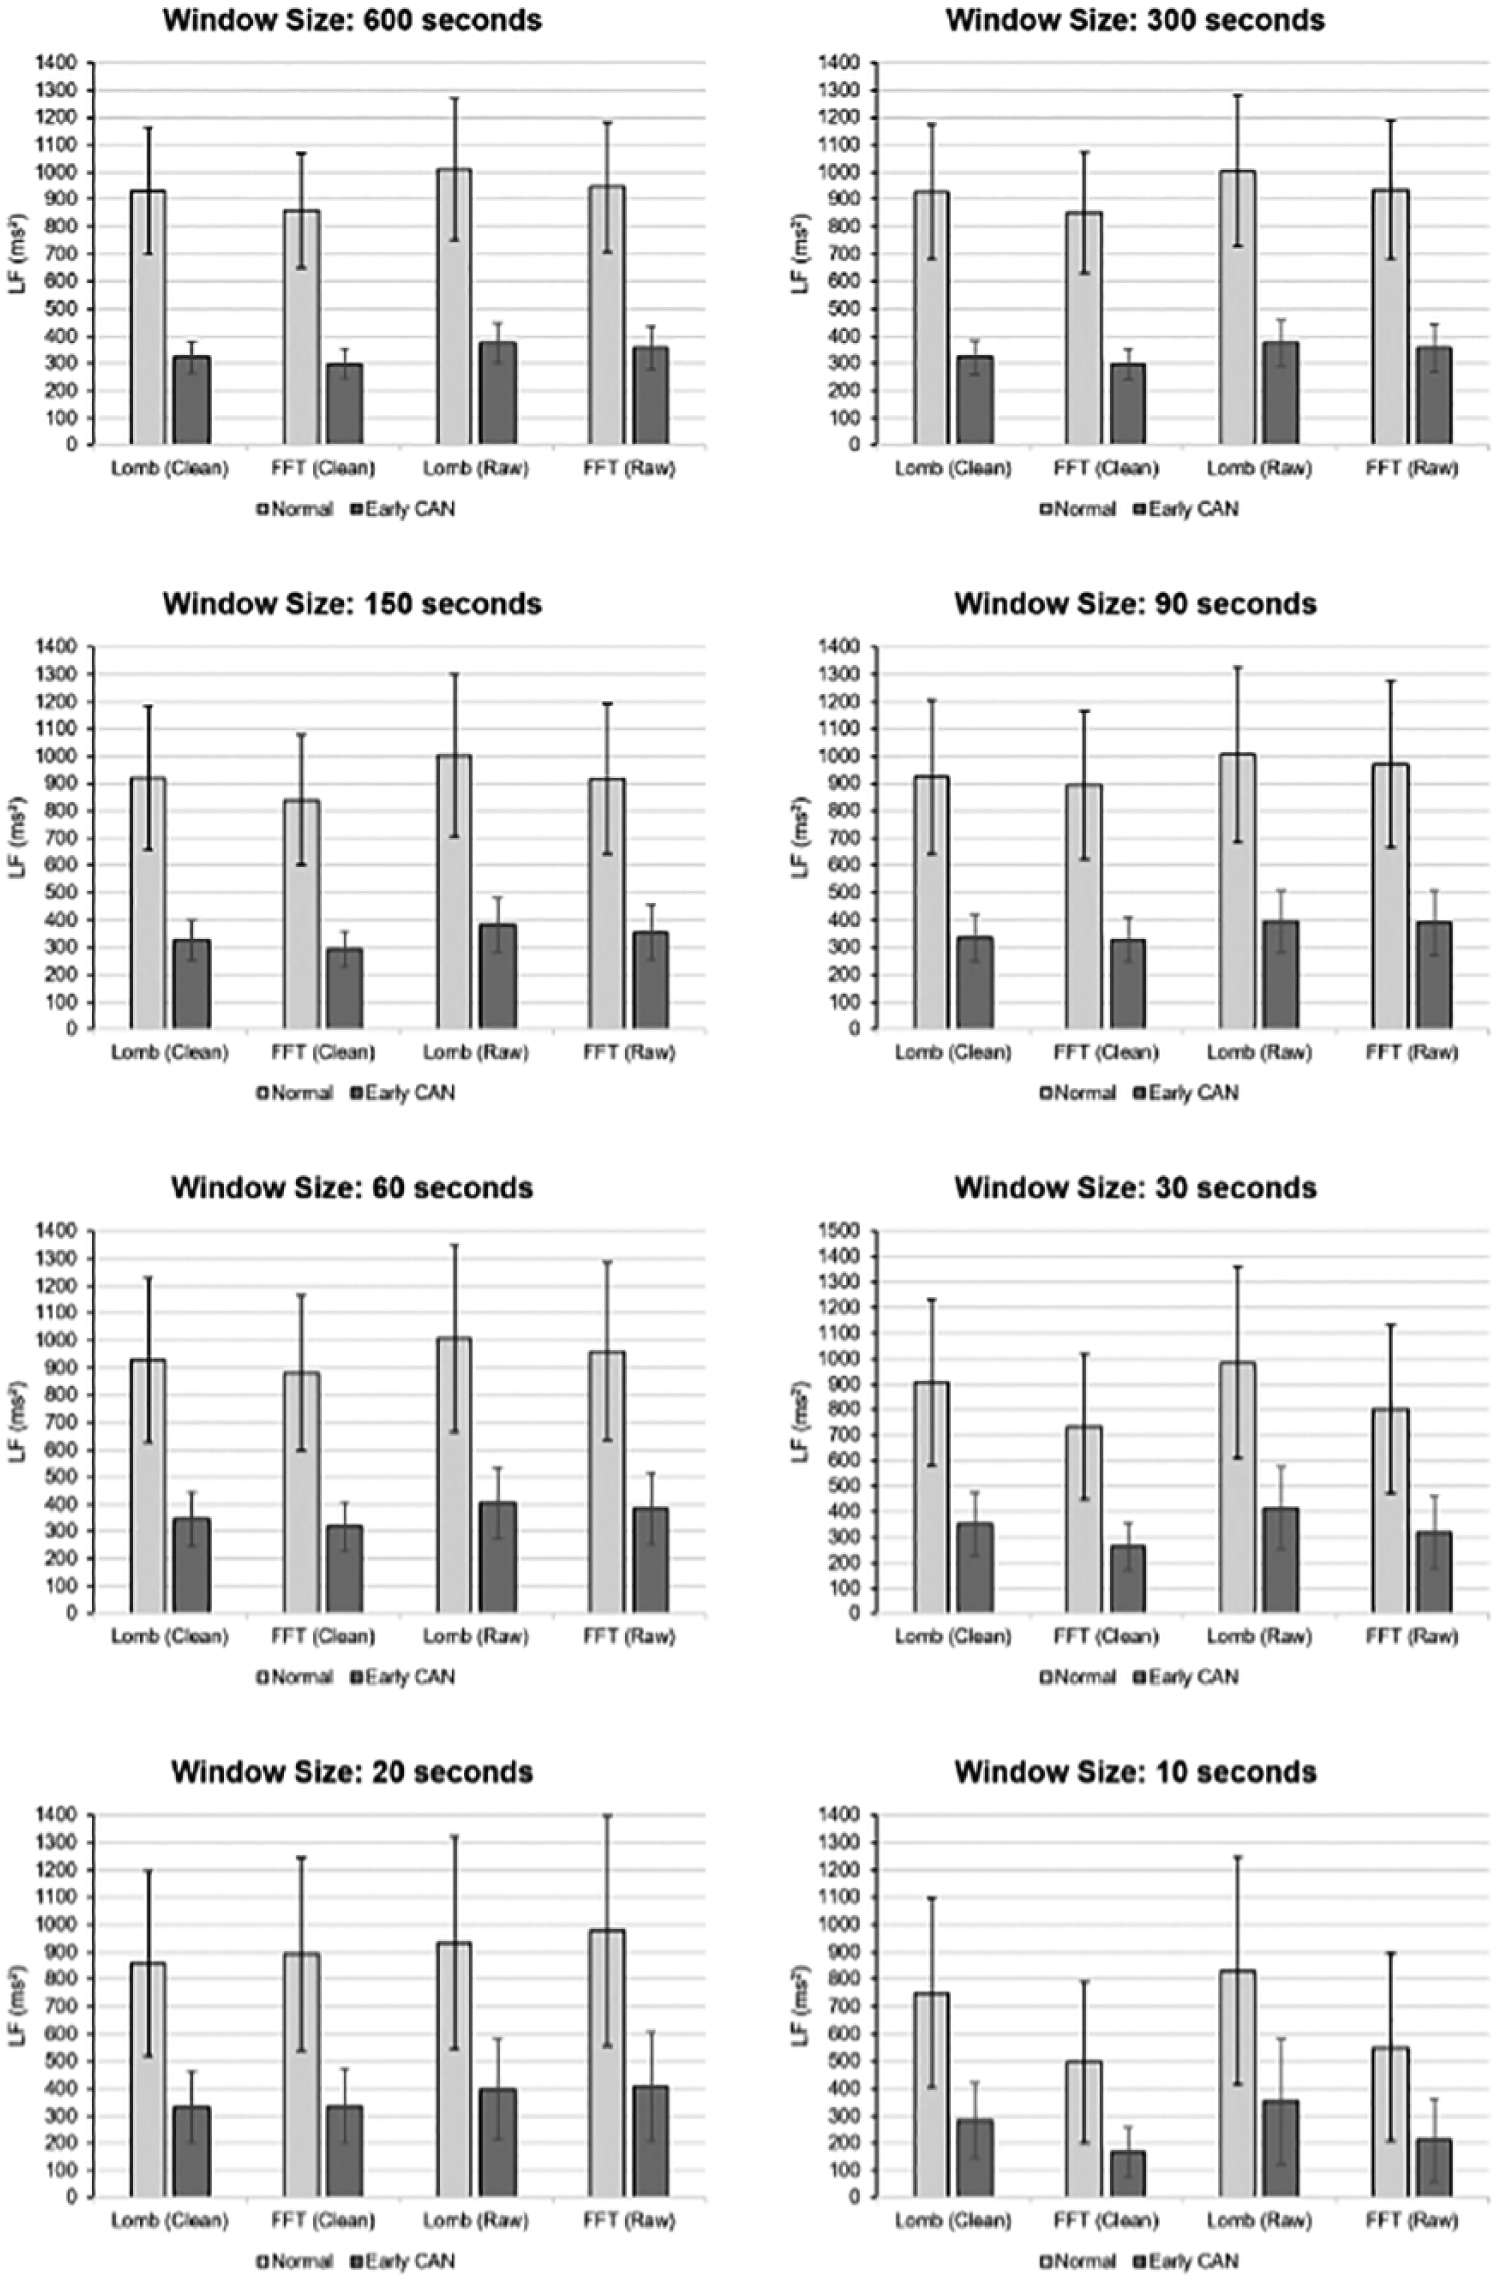
Average values and standard deviations of the actual LF values for increasing recording lengths.
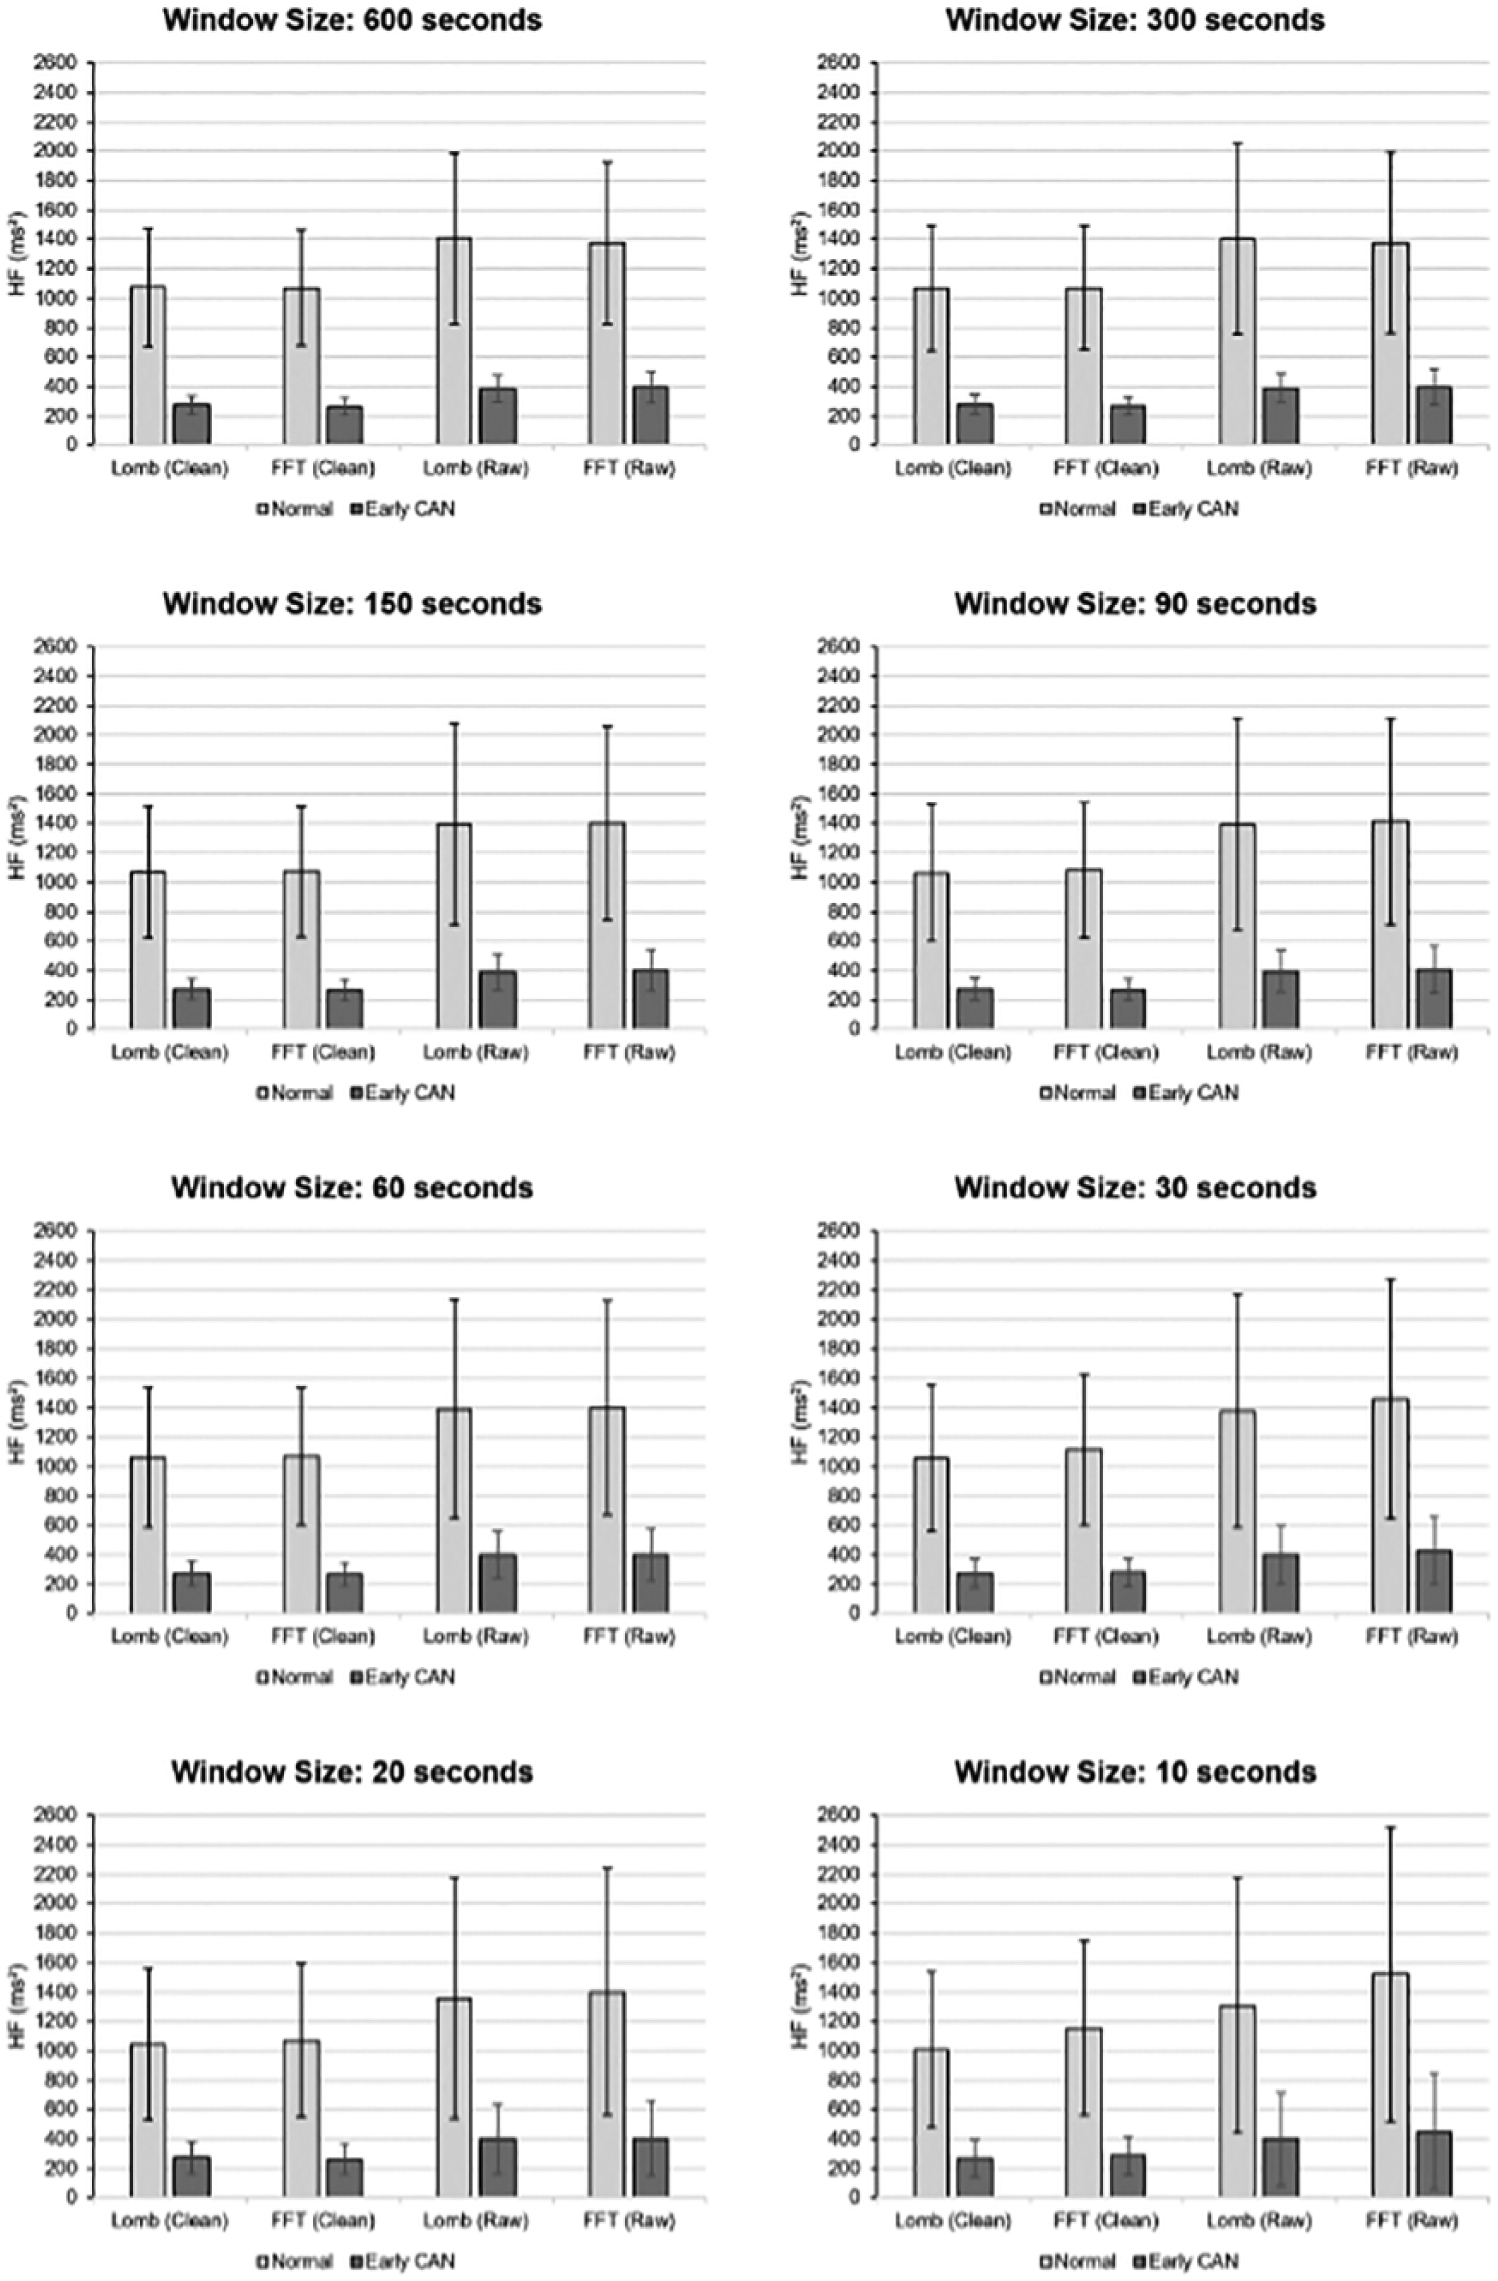
Average values and standard deviations of the actual HF values for increasing recording lengths.
Mean LF power was higher for normal than early CAN. The difference between control and early CAN remained significant regardless of whether FFT or LSP was used on either cleaned or raw data from 600 seconds down to 10-second recordings. For recording lengths down to 30 seconds P values were below .01 and for recording lengths of 20 and 10 seconds P values were still less than .05.
Furthermore, the mean of the PSDs decreased while SD increased as the recording window decreased to 10 seconds. This is one reason why the shorter recordings do not provide the same accuracy compared to longer recordings as indicated later in the article, where more outliers are apparent below 90-second lengths recording.
Results for the area under the ROC obtained when comparing FFT with LSP, and LF with HF power for participants without CAN to those with early CAN are illustrated in Figure 5. A higher value for the area under the curve (AUC) indicates more separation between these categories. The horizontal axis is the window size in seconds of recording time, for various combinations of the processing method. The boxes show upper quartile, median and lower quartile, with the whiskers indicating the 95 percentile interval. Heavy dots show outliers. Looking first at the right hand side, the results for recording length of 600 seconds (10 minutes) have values for AUC between 0.65 and 0.75. LF power provided better discrimination between normal and early CAN with no difference seen between FFT and LSP. The differences in accuracy between LF and HF power was mainly affected by the recording length down to 60 seconds (AUC of 0.6 to 0.75), although the difference between LF and HF decreased with decreasing recording length. Below a recording length of 60 seconds, the HF power provided better discrimination. No significant difference for LF power nor between FFT and LSP was noted with an AUC of 0.65. Figure 5 also shows that HF power for both FFT and LSP has less outliers down to 30 seconds but a lower accuracy (ROC).
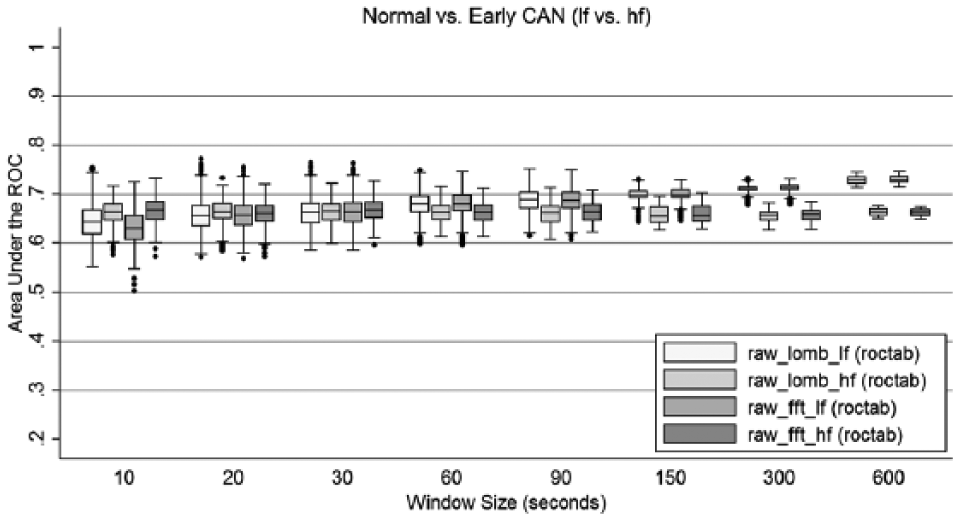
Area under the ROC curve for FFT and LSP of low frequency power analysis of raw RR interval recordings.
An advantage of LSP is that it is robust against ectopic beats and noise in the recording. We investigated this and show the results in Figure 6, which compares FFT with LSP, but also compares raw data with cleaned data. HF power was not included as it performed less well in our previous experiment.
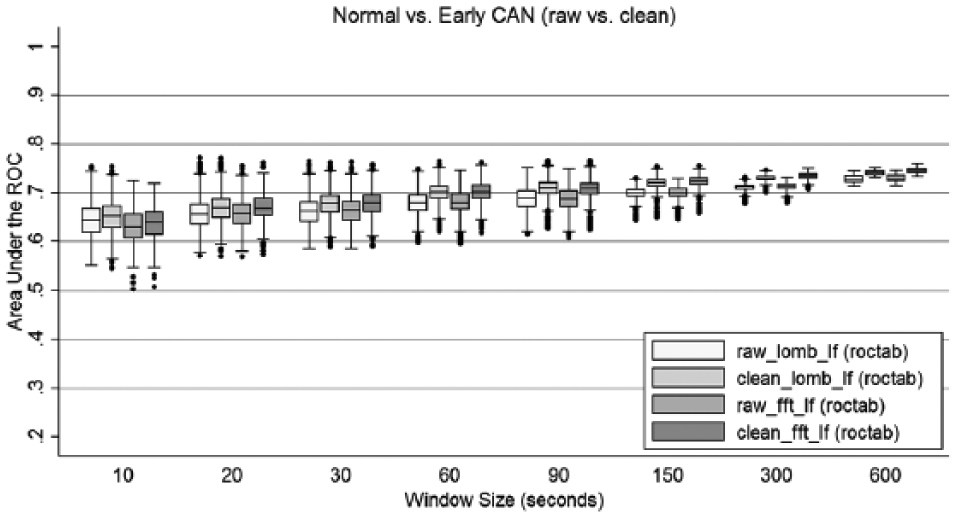
Comparison of area under the ROC curve for FFT and LSP frequency analysis of raw versus cleaned RR interval recordings.
As with Figure 5, there was little difference between results for FFT and LSP. Using preprocessed/cleaned signals provided a better AUC for both FFT and LSP and agrees with previous recommendations. 17 There was no significant difference with respect to outliers and hence accuracy of a random recording for identification of early CAN. Hence preprocessing to remove artifacts or noise, may improves AUC, but the effect is negligible.
Figure 7 compares raw data with cleaned data, and compares the receiver operating characteristics (ROC) result (roctab) with results corrected for mean heart rate using logistic regression (lroc) for early CAN versus normal from LF results. Cleaned data yielded an improvement in AUC values, indicating stronger discriminant function. The higher AUC results also show a consistent improvement obtained from correcting for heart rate using logistic regression, which is apparent down to 90 seconds. As expected for shorter recordings, correction for heart rate does not play a role in the observed results. Figure 7 also highlights that there was a reduction in outliers and therefore the likelihood of making the correct diagnoses improves with increasing length of recording and suggests a minimum length of 90 seconds.
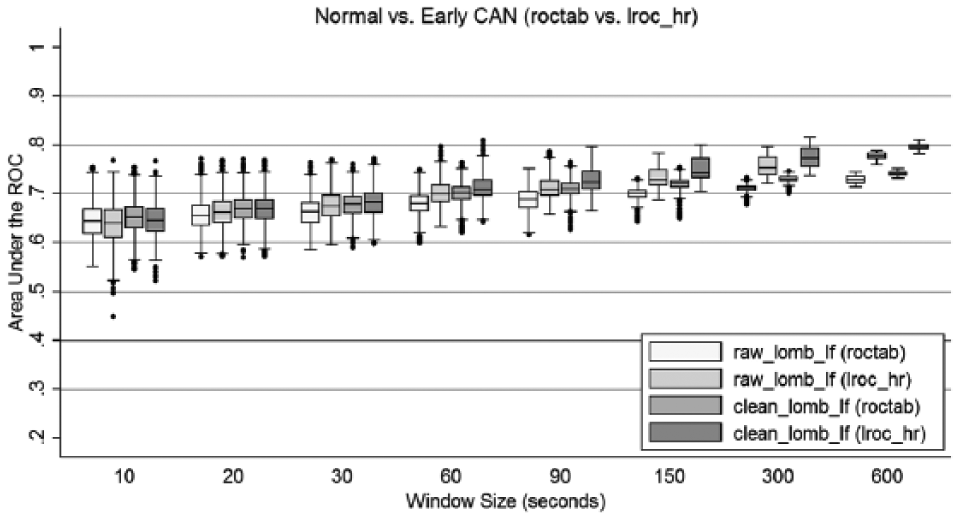
Area under the ROC curve compared to logistic regression results for FFT and LSP low frequency analysis of raw and cleaned RR interval recordings.
Certainty of correct diagnosis decreases gradually as seen in Figure 7, with data showing good results down to 30 seconds. The results for the logistic regression for heart rate correction are slightly better compared to no correction for heart rate and suggests that for the purposes of this study a conservative setting would be 90 seconds as the minimum recording length that should be considered when analyzing heart rate for the presence of early CAN. However 30-second recordings still have acceptable outcomes for heart rate corrected data (lroc). It is worthwhile to note that for the 10-second recordings the uncertainty was between 5% and 6%.
For clinical practice it is important to know the sensitivity and specificity of the methodology. Table 2 provides an overview of sensitivity and specificity at 600-second recording length. This allows a trade-off between of sensitivity and specificity.
Sensitivity and Specificity for a Specific Recording Length of 600 Seconds.
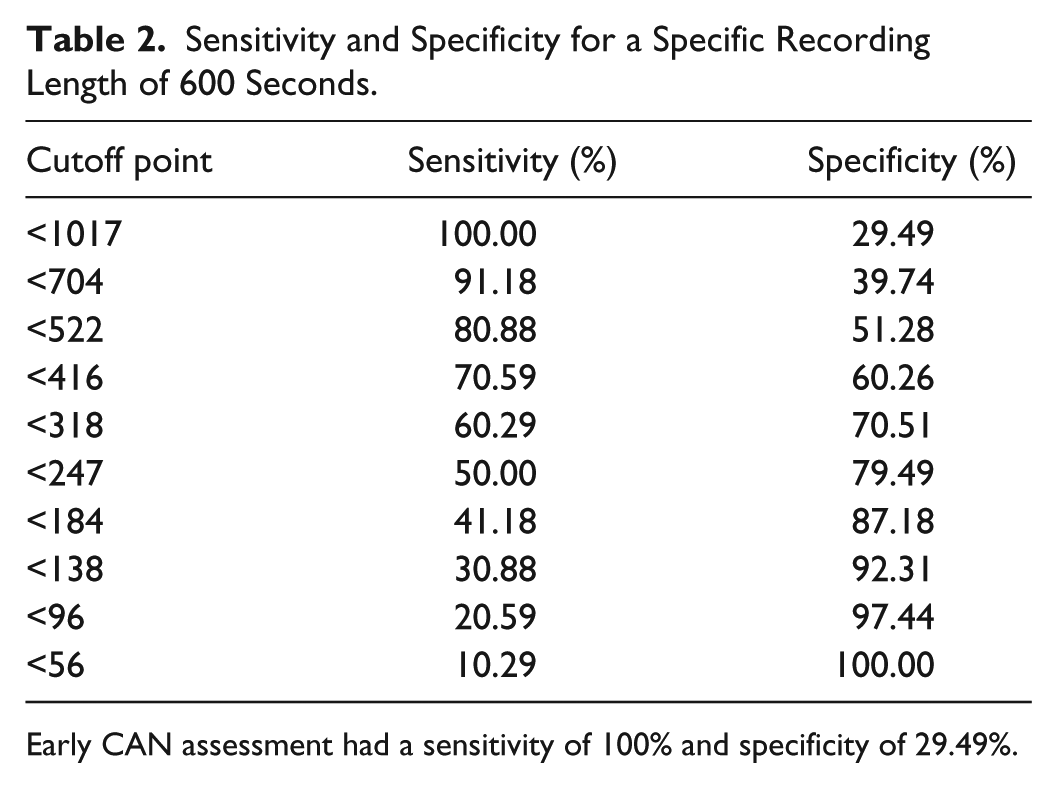
Early CAN assessment had a sensitivity of 100% and specificity of 29.49%.
Discussion
Recent studies have shown that consultation times in primary health care are decreasing.11,12 This decrease is in part driven by the increase in prevalence of chronic disease including diabetes leading to an increase in the number of patients attending general practice. Comorbidities associated with diabetes such as cardiac autonomic neuropathy require additional tests that increase consultation times and hence effective, short, and accurate tests are required to improve patient management and treatment outcomes in the current clinical environment. CARTs consist of three heart rate tests and two blood pressure tests that take approximately 40 minutes to complete and requires additional instrumentation to what is normally available in a primary care consulting room. Therefore it represents a substantial barrier for these tests to be offered. Determining CAN from ECG recordings utilize existing technology found in general practice, requires less time and can be delegated to practice nurses/technicians, freeing clinician time for interpretation and discussion of the results with the patient.
Recent reports have suggested that HRV is one of the most sensitive and specific diagnostic tests available for clinical decision making. 23 Both time domain and frequency domain analysis are useful indicators of cardiac autonomic neuropathy but require further investigation on the factors that influence reliability and robustness for repeated measures and interpatient variability. 29 LSP has emerged as the most reliable and sensitive method for HRV analysis in several previous studies, which agrees with our current findings.17,20,30-32 LSP is more computationally efficient and provides more accurate results. However automated removal of ectopic beats, noise and beat replacement may still be required for LSP in clinical practice. 17
An important adjunct to clinical decision-making is the knowledge that the test results are accurate and identify the condition with a low risk of error. Our current findings suggest that HRV using power spectral analysis has very good sensitivity but lacks specificity. Future work can address this by investigating different HRV measures or a combination of HRV measures. To avoid false positives patients should always undergo further testing regardless of the clinical tests. Combining a routine ECG review with HRV analysis derived from the recorded ECG provides a simple and cost effective way of identifying early, asymptomatic CAN. In clinical practice the 10-second ECG is the preferred test for identification of rhythm anomalies and cardiac ischemia. A significant difference between control and early CAN was found in the current study for recordings down to 10 seconds with an error between 5-6%. However for accurate diagnostics based on individual recordings, our results for detecting early, asymptomatic CAN indicate that recording lengths down to 90 seconds are optimal and possibly even 30 seconds are accurate enough for clinical decision-making.
For longer recording periods from 60 seconds to 600 seconds the LF power incrementally improved discrimination between control and early asymptomatic CAN, whereas a greater residual variance was observed when analyzing the HF component. In agreement with previous studies, the most sensitive measure in detecting abnormality in people with diabetes under resting conditions was the spectral power in the LF band. 33 This may be due to changes in the sympathetic contribution to HRV as LF power contains both sympathetic and parasympathetic components in this group of patients and disease modality.9,34
Length of recording is an important consideration but depends on what type of HRV analysis is applied. 16 Previous work analyzing synthetic, real and noise corrupted data concluded that FFT and LSP provide similar results when ideal inputs are available but LSP is better if noise was present in the recording. 20 Our data were recorded during visits to a diabetes screening clinic, while participants were in a supine position after a 5-minute rest with a steady respiration, which may have reduced the noise inherent in the ECG recording and brought the results for LSP and FFT closer together, compared to the synthetic noise included in previous work. 20 In addition, participants were grouped by presence of CAN according to the results of the five CARTs included in the study, in the absence of cardiovascular or renal complications. 10
Conclusions
Cardiac autonomic neuropathy and vagal impairment can lead to a relative predominance of sympathetic activity in the sympathovagal balance at an early stage of CAN progression. Frequency domain HRV features are suitable for clinical practice as random recordings have very minor variation and a good accuracy of predicting early, asymptomatic CAN if corrected for heart rate regardless of noise and ectopic beats.
Footnotes
Acknowledgements
The authors wish to thank Bev de Jong for technical assistance and Roche Australia for providing glucose measuring instruments and test strips.
Abbreviations
AUC, area under the curve; BGL, blood glucose level; BMI, body mass index; CAN, cardiac autonomic neuropathy; CARTs, cardiac autonomic reflex tests; CVD, cardiovascular disease; DBP, diastolic blood pressure; DCCT, Diabetes Control and Complications Trial; eCAN, early cardiac autonomic neuropathy; ECG, electrocardiogram; FFT, fast Fourier transform; HDL, high-density lipoprotein; HF, high frequency; HRV, heart rate variability; Hz, Hertz; LDL, low-density lipoprotein; LF, low frequency; lroc, logistic regression; LSP, Lomb-Scargle periodogram; PSD, power spectral density; QRS, electrical ventricular depolarization interval; ROC, receiver operating characteristic; roctab, ROC results; RR, R peak to R peak interval of ECG; SBP, systolic blood pressure; SD, standard deviation; TC, total cholesterol; Trigs, triglycerides; T2DM, type 2 diabetes mellitus.
Declaration of Conflicting Interests
The author(s) declared no potential conflicts of interest with respect to the research, authorship, and/or publication of this article.
Funding
The author(s) received no financial support for the research, authorship, and/or publication of this article.