
Abstract
Since the FDA requirement for cardiovascular safety of all new antihyperglycemic drugs to enter the market, the number and extent of phase 3 clinical trials has markedly increased. Unexpected trial results imply an enormous economic, personal and time cost and has deleterious effects over R&D. To prevent unforeseen developments in clinical trials, we recommend performing a comprehensive prospective outcome scenario analysis before launching the trial. In this commentary, we discuss the most important factors to take in consideration for prediction of clinical trial outcome scenarios and propose a theoretical model for decision making.
Phase 3 clinical trials constitute an essential requirement for licensing of new medical treatments. It represents the most expensive part of the developmental process for novel drugs and, especially in the case of chronic illnesses like diabetes, it involves the enrollment of great patient numbers as well as long duration studies. A 2012 report by the Manhattan Institute for Policy Research found that 93% of the total cost of a new drug’s developmental program is dedicated to performing phase 3 clinical trials. 1
Since the 2008 US Food and Drug Administration (FDA) 2 and subsequent European Medicines Agency (EMA) requirement 3 that all new therapies for diabetes undergo a rigorous assessment of cardiovascular (CV) safety through cardiovascular outcome trials (CVOTs), the number of large-scale medium/long-term trials on diabetes has experienced a substantial increment.
This increasing number of large-scale CVOTs in patients with diabetes raises several considerations. Among others, during the course of an ongoing trial it is increasingly important to keep in perspective outcomes of other CVOTs. In addition, it would be recommendable to address the likelihood of outcomes before the trial is completed. Since, for instance, a negative result in such a trial, be it inferiority in comparison to other drugs in the market, a low benefit/risk ratio or trial termination due to total lack of effects or increased health risks, entails an economic cost such that discourages innovation and investment and restricts the drug development field to the most powerful pharmaceutical players.
Unforeseen outcomes are a reality in the clinical practice. For instance, the ACCORD trial had to be prematurely stopped due to unexpected negative side effects, when intense glucose control was associated with an increase in patient mortality. 4 Another unexpected finding resulted from the SAVOR-TIMI trial, where treatment with saxagliptin increased hospitalization for heart failure, while being non-inferior to placebo in all other CV outcomes tested. 5 Even during trial execution, unanticipated side effects can introduce delays or even lead to trial termination. In the CANVAS study on CV risk of canagliflozin, shortly after trial initiation, treatment was found to increase the hazard ratio for stroke to 1.5 (95% CI, 0.8-2.6), 6 whereas an interim analysis 1 year after trial start showed an increased risk of foot and leg amputations for patients in the treatment arm. 7 Despite the fact that an independent data monitoring committee recommended trial continuation, safety is under question and regulatory agencies approval of drug prescription at stake. Obviously, the appearance of unexpectedly elevated adverse event rates does not necessarily imply that a trial must be stopped, the benefits of the treatment must be weighed against the risks, and a decision reached. So was the case for a trial of pioglitazone on patients with ischemic stroke or transient ischemic attack, where treatment produced significant weight gain, increased edema and bone fracture requiring surgery/hospitalization in comparison to placebo but significantly reduced the risk for stroke or myocardial infarction. 8
The result of such unexpected effects implied an enormous economic, personal and time cost. With the high stakes posed by phase 3 trials, it would be advisable to perform a prospective outcome analysis before launching the clinical trial. This strategy would help better quantify the risks associated to the trial and decide which actions to take for an effective design. Unforeseen trial results are not always negative. Quite on the contrary, the recent EMPA-REG outcome trial has uncovered beneficial results in terms of CV and renal outcomes in high-risk diabetic patients.9-12 Similar unexpected reductions of CV events were described for the recently terminated LEADER and SUSTAIN6 studies.13,14 Unexpected positive results can even lead to a premature end to the study as in the SPRINT trial on intensive blood pressure control in patients without diabetes. 15 In such cases, an outcome scenario analysis would have been advantageous since it might have introduced changes to study design, like reducing patient or study duration, which would have reduced the cost and allowed patients under the placebo arm to receive a better treatment alternative.
Given the relevance of clinical trials for both the scientific community and drug development, clinical trial management is of the utmost importance. Starting from plans to enhance patient recruitment and adherence rates 16 to electronic record keeping, and other strategies for faster and optimized trial management like critical path analysis, 17 or cost forecasting tools are in constant development. 18
Here we propose the introduction of an outcome scenario analysis to the aforementioned management strategies.
Recommended Analytic Strategies
There are several methodological alternatives and each particular study design should consider the strategies or tools more applicable to it. The most common instruments for predictive analysis in clinical studies are computer-based. For instance, there are countless examples of cross-trial outcome prediction by statistical model development based on clinical trial data mining.19,20 In this strategic approach, patient data are analyzed to detect the variables more predictive of treatment outcome and these variables fed to train a machine-learning model to predict clinical outcomes. A similar approach served to develop risk assessment models for diabetes-related complications based on the Diabetes Control and Complications Trial (DCCT) and the Epidemiology of Diabetes Interventions and Complications (EDIC) data. 21 This and similar models 22 would be especially useful for the modeling of outcome scenarios in diabetes since they contemplate the most common diabetes-related complications (CVD, microvascular complications, renal disease, etc) and point to specific patient groups. However, it would be necessary to adapt the model to each of the particular conditions of the trial in question. Population pharmacokinetic and pharmacodynamics models have also been successfully tested for prediction of phase 3 trial outcomes. 23
Obviously, a literature-based evaluation should also be included in the outcome analysis. A literature search on the specific topic pertaining the trial, considering factors related to adverse event (AE) incidence, possible molecular mechanism of action, reported side effects, and/or efficiency comparison to other therapies should be performed and rated.
This literature-based assessment should also include data from other predictive models. For a SGLT-2 inhibitor study, for example, that would mean including data from an Archimedes model predicting the long-term effect on CV outcomes of the addition of a certain SGLT-2 inhibitor to usual care. 24
A further dimension to be included in the modeling of trial outcomes refers to the time span of expected results (short, medium, long term). Different end points from a trial can return results after variable times, for instance, in EMPA-REG the positive effects of empagliflozin on renal function could be observed already within the first 12 months of the study, 25 while the beneficial CV effects took longer to be significant. 11 Introducing this variable might complicate the analysis, but also help determine the extent of follow-up needed for the various end points required in the study design.
Another aspect to be included in the prospective analysis refers to AEs. Depending on the nature of the drug under evaluation, a comprehensive list of possible AEs must be elaborated, and rated based on likelihood estimates. For that purpose, evidence-based computer models would be advantageous. A wide range of data regarding the compound under examination (from molecular/biochemical studies on model organisms or clinical trials) should be considered for inclusion in the predictive model.
In addition, when and where possible, an independent team of evaluators should perform the study to avoid bias. This team could be composed, on the one hand, by a technical team, in charge of performing the data search and primary analysis, as well as the prospective computer-based models. On the other, the team would count on the support of an independent expert panel, which would have the knowledge and experience to evaluate on the information provided by the technical team.
As an example, here we propose a theoretical framework for characterizing the likelihood of potential outcome scenarios by differential weighting of end points for trial success. The impact of superiority in each end point should be evaluated taking into account all the available data, even when a relativist approach might be sufficient to approximate likelihood estimations. For instance, in our model we would consider a single primary end point, whose satisfaction would provide the highest success rate of the intervention, and in most cases determine alone success of the intervention. In this case, given the lack of information for a closer estimate, we would arbitrarily consider the first end point to involve a 75% intervention success. In our model, we also consider several secondary end points (namely 2), with similar impact on success and assuming that satisfaction of all end points would return a 100% success rate, each secondary end point would represent a 12.5% success rate.
For an end point in which the result in the intervention group is better than in the control group (superiority), our model would add the entire success rate of the specific end point to the general analysis. If, however, the intervention group doesn’t achieve a better result than the control group (inferiority) there will be no further addition of success to the final quantification. An intermediate result (neutrality), that is, similarity of results under both interventions (control and treatment), would add half the success rate of each independent end point, assuming that a neutral result is not the pursued objective, as would be the case in non-inferiority trials.
In principle, all combinations of primary and secondary outcomes are possible, as shown in Figures 1 to 3. Further analysis of the conditions of specific trials would reduce the spectrum of possible scenarios, depending on likely/unlikely outcome combinations. For instance, under certain trial designs superiority or neutrality of a secondary end point would not be possible if primary end point is not satisfied and so forth. Furthermore, in case of a non-inferiority design, the neutral scenario would not be included in the analysis, since that would already involve trial success. For a consideration of the possible scenarios to contemplate in case of a non-inferiority design, see Figures 4 and 5.
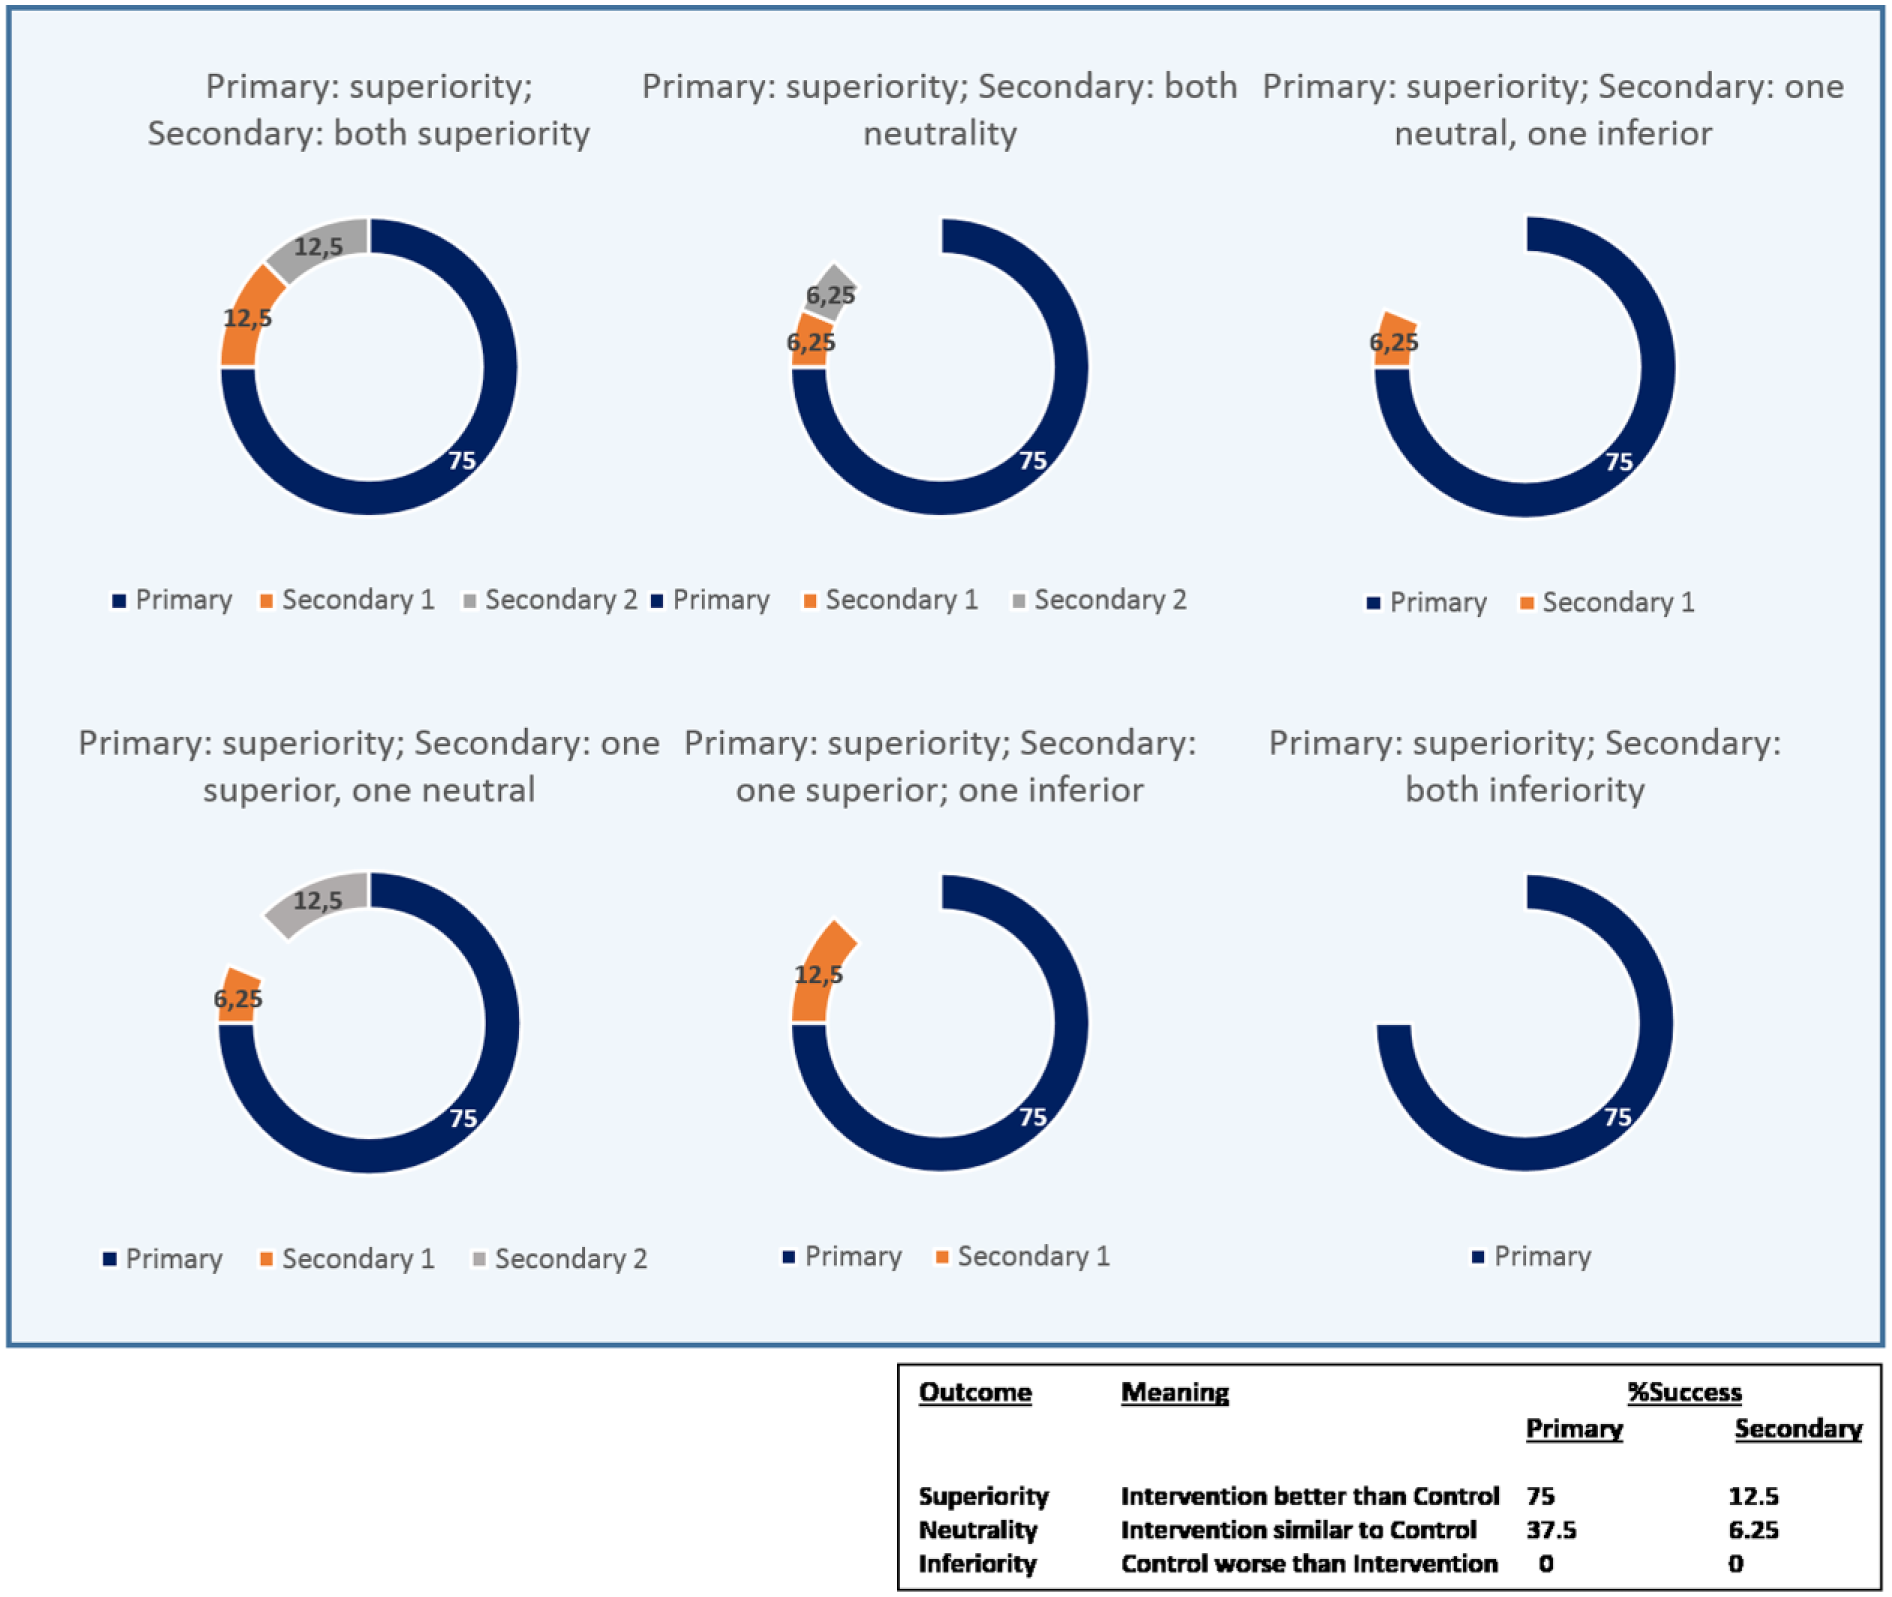
Success estimation under superiority of primary end point. A better result of intervention than control in any end point adds the full success rate (75% primary; 12.5% secondary). A similar result between control and intervention groups adds the half of the estimated success rate (6.25% secondary) and inferiority of the intervention with respect to control does not add value to the success estimation.
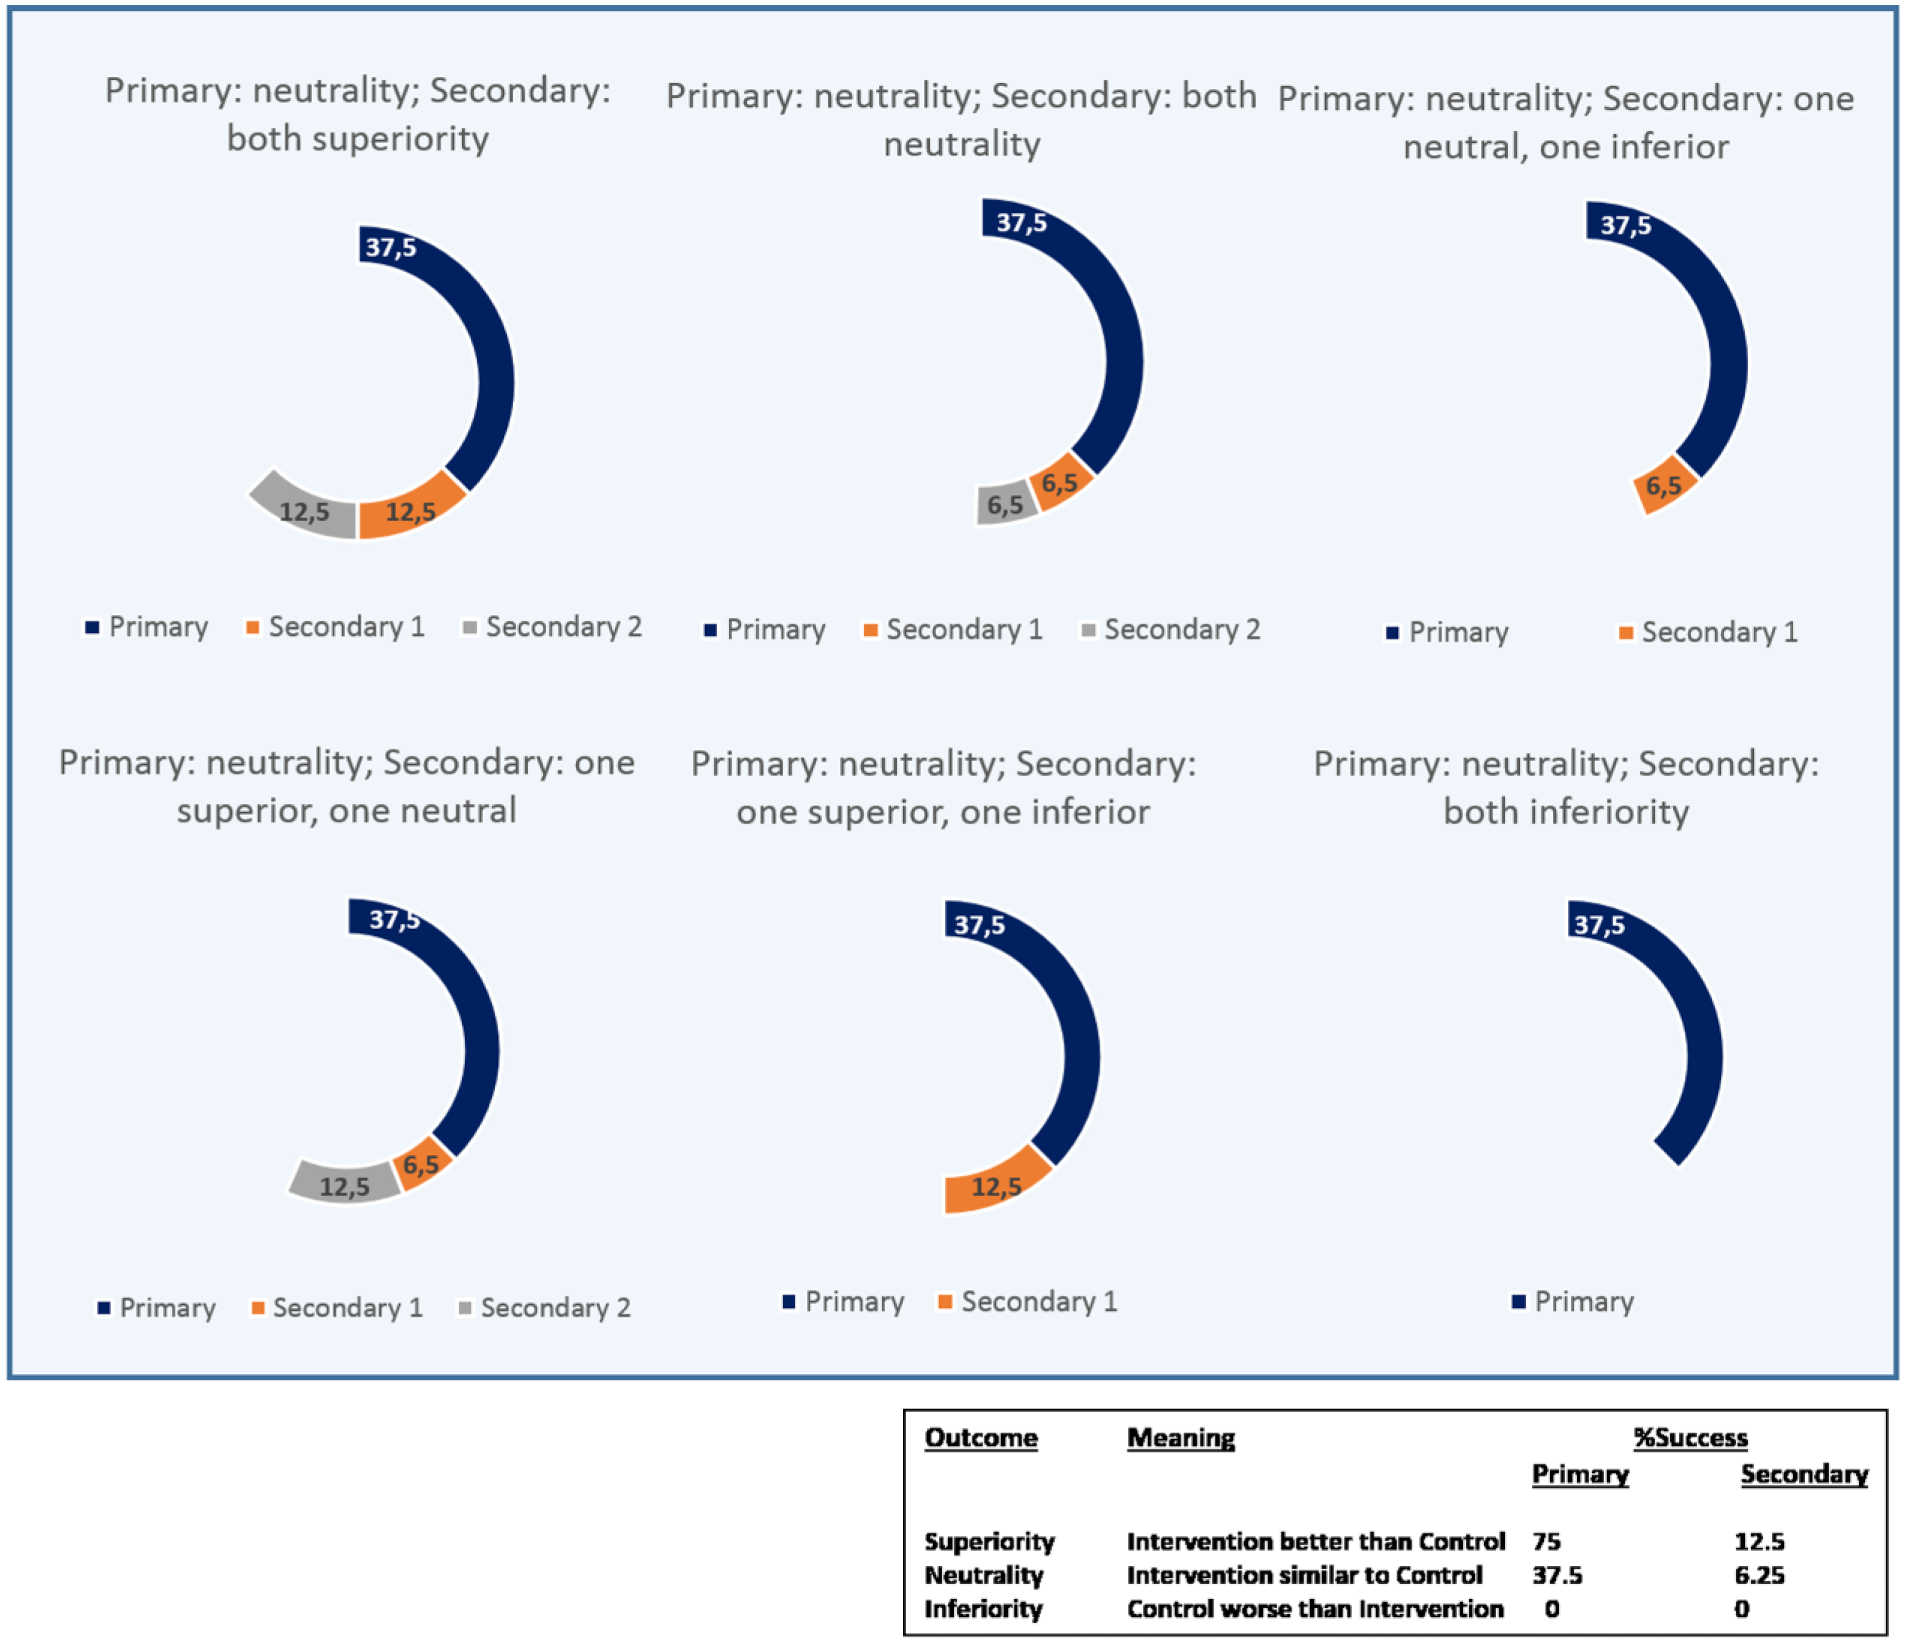
Success estimation under neutrality of primary end point. A better result of intervention than control in any end point adds the full success rate (12.5% secondary). A similar result between control and intervention groups adds the half of the estimated success rate (37.5% primary; 6.25% secondary) and inferiority of the intervention with respect to control does not add value to the success estimation.
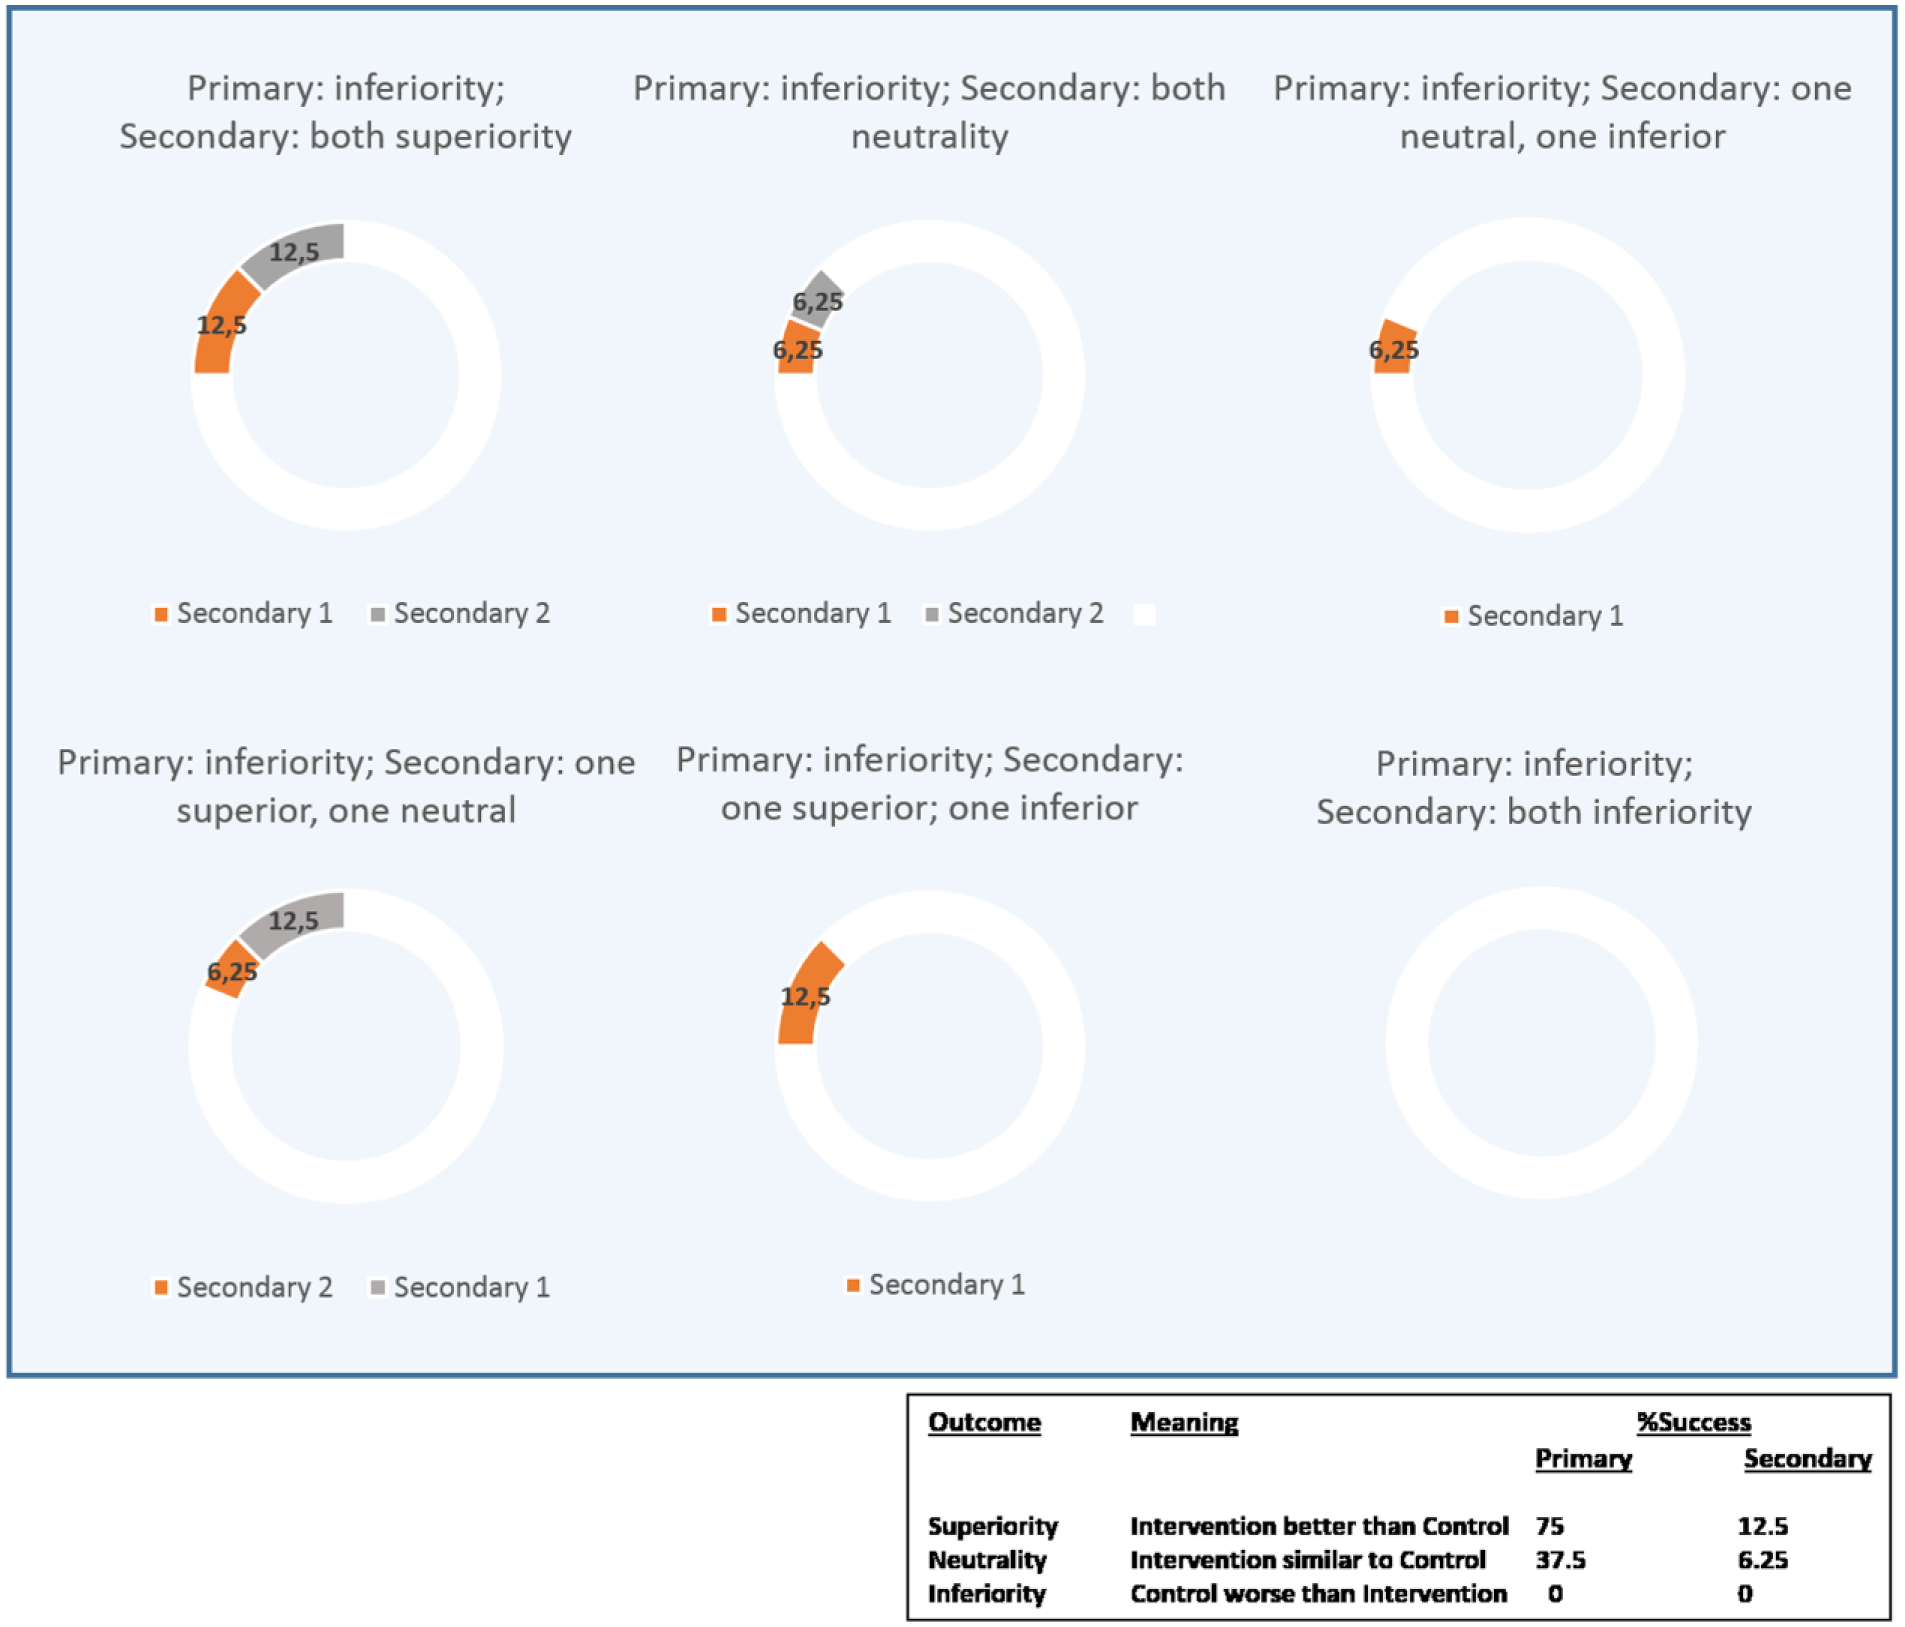
Success estimation under inferiority of primary end point. A better result of intervention than control in any end point adds the full success rate (12.5% secondary). A similar result between control and intervention groups adds the half of the estimated success rate (6.25% secondary) and inferiority of the intervention with respect to control does not add value to the success estimation.
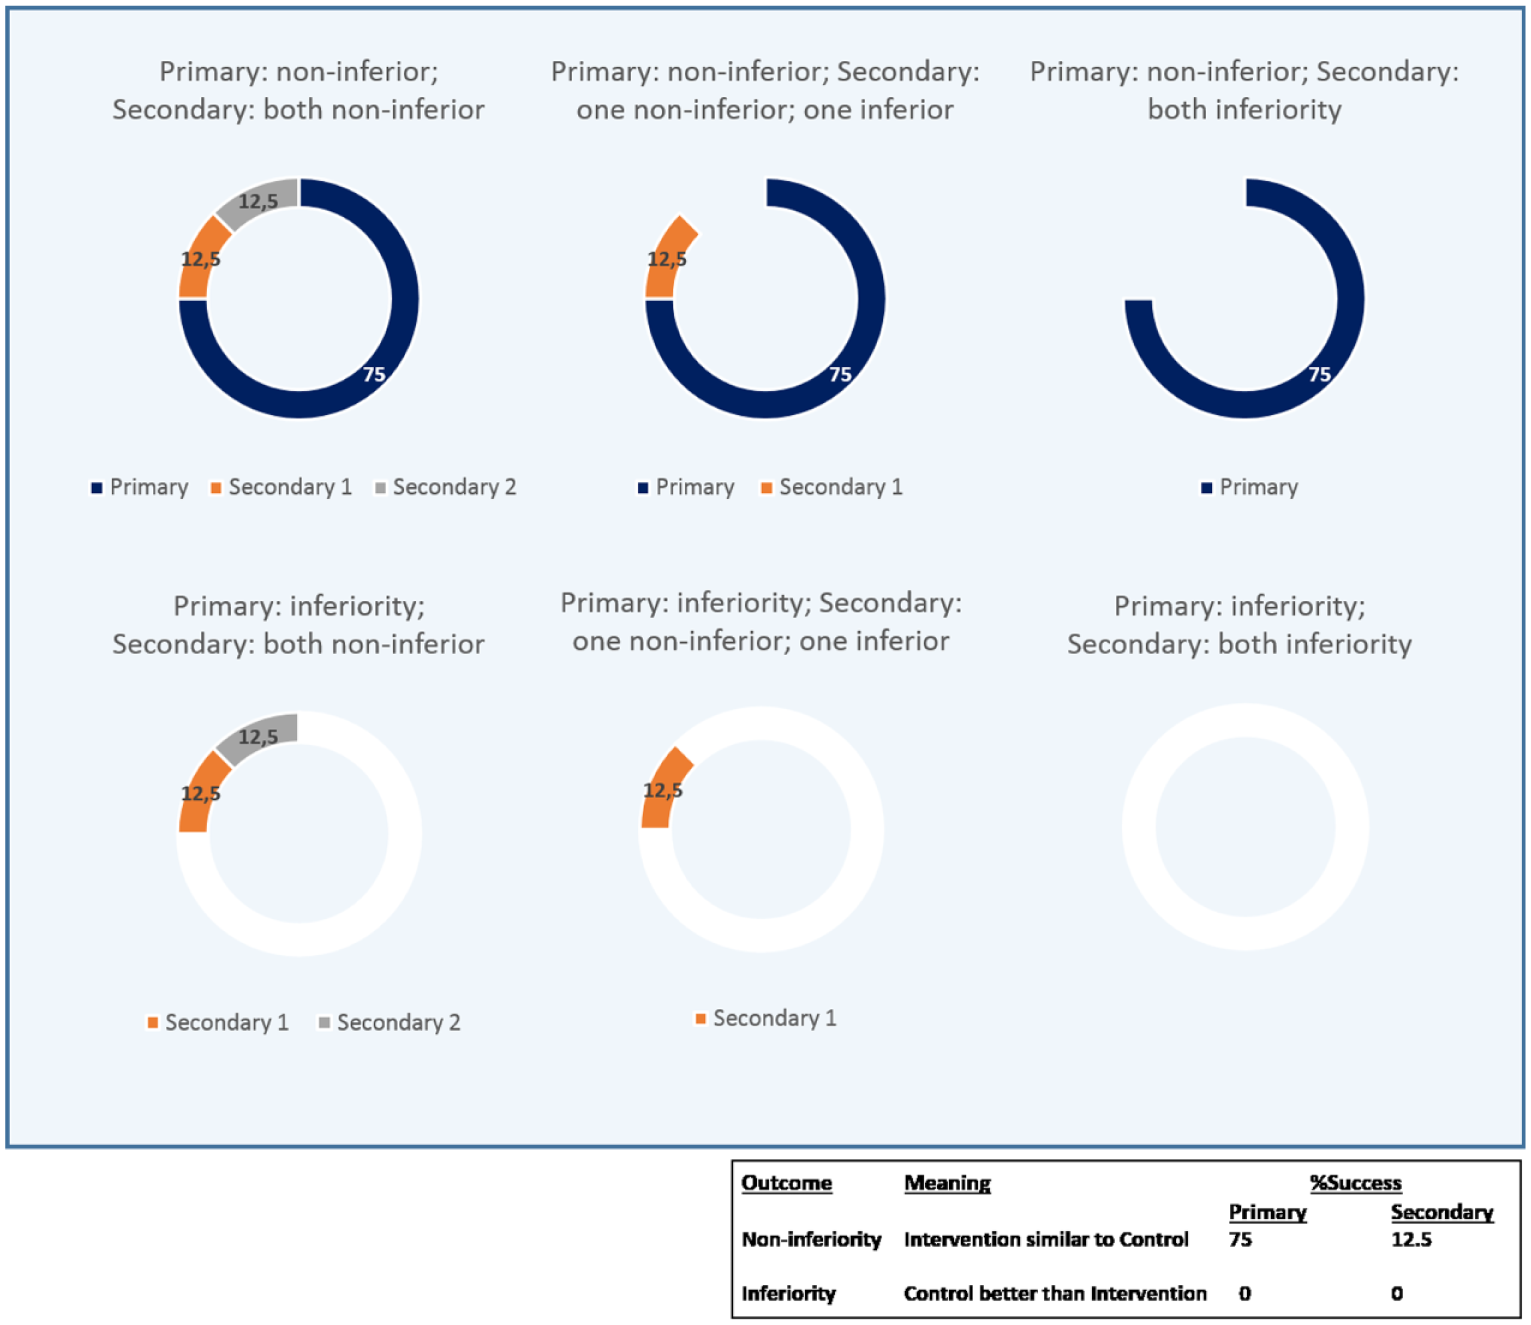
Non-inferiority design trials: success estimation under non-inferiority of primary end point. A similar result between control and intervention groups in any end point adds the full success rate (75% primary; 12.5% secondary), whereas inferiority of intervention with respect to control does not add value to the success estimation.
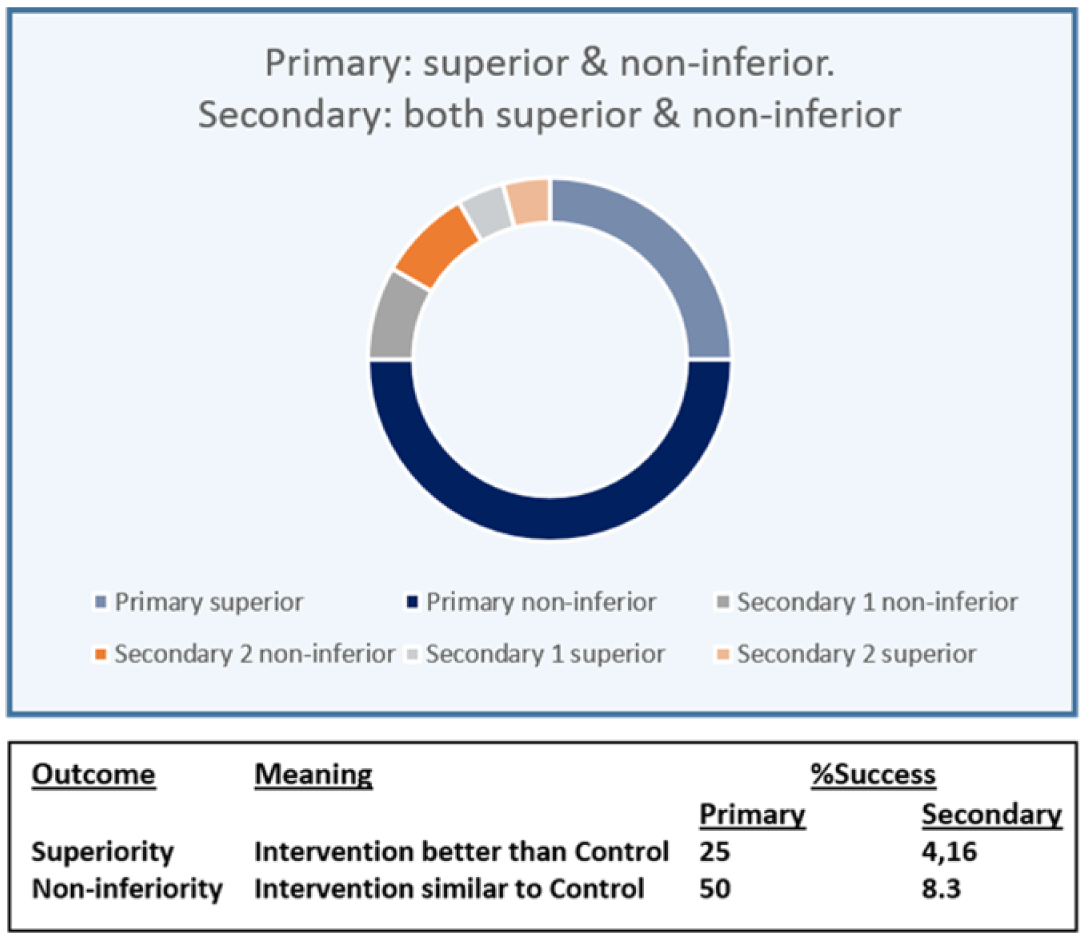
Non-inferiority design trials: success estimation under superiority of primary end point. Success rate for the primary end point is shared between non-inferiority, which in principle is the study’s aim (50% success rate) and superiority (25% extra success rate). Similarly, success rates for secondary end points are split between the 2 options.
The consideration of the effects of AEs on the final success of the intervention would depend on their type and significance. Clearly, a significantly high rate of treatment-associated serious AEs would limit or even call into question trial success (see Figure 6). For each trial and substance examined, a risk/benefit evaluation must be performed to determine the effect of AEs on trial success. For instance, in a CV safety trial, high occurrence of severe hypoglycemia or renal outcomes could be determinant for a trial failure.
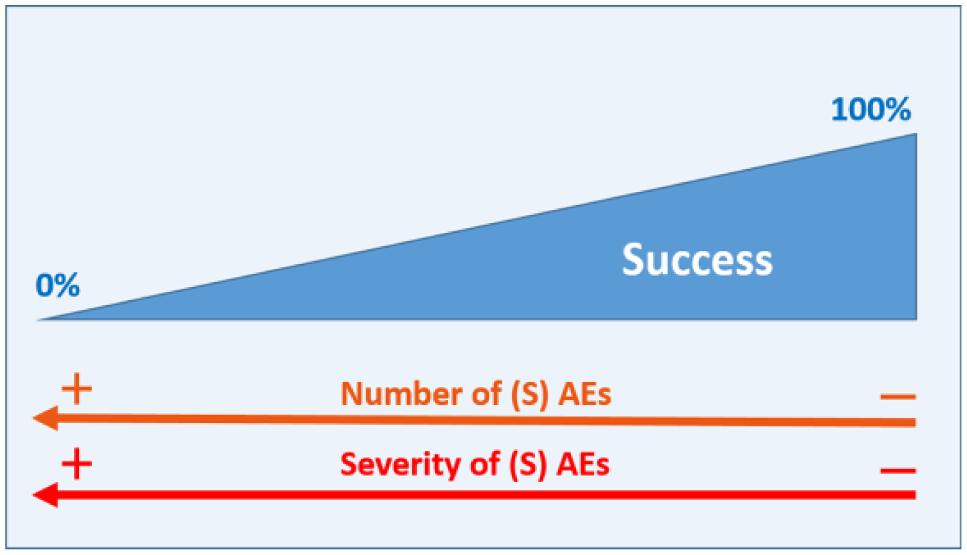
General success estimation considering the effect of (serious) adverse events ─(S)AE─. The more (S)AEs and the more serious, the bigger the negative effect on trial success. We have depicted the influence of (S)AEs as a continuum but in a real scenario with a discrete number of possible (S)AE, it would be possible to perform a concrete value assessment of the potential influence of (S)AEs on trial success.
As a general theoretical framework, this prospective analysis does not fit every study design. The existence of co-primary endpoints would require an adaptation of the theoretical approach or, as mentioned previously, in the case of non-inferiority trials such as CVOTs, the primary end point would already be satisfied by obtaining a neutral result (see Figure 4). However, when developing the outcome scenarios for the study it would be important to also consider the possibility of achieving a superiority result, which has been proven the case in studies like EMPA-REG, LEADER, or SUSTAIN6, as reflected in Figure 5.
Conclusion
Despite the effort associated with an outcome scenario analysis, we believe in its potential to facilitate clinical trial management as well as the evaluation, interpretation and communication of results. The enormous stakes posed by failure or unexpected result of a phase 3 clinical trial (loss of investment capital, failure to market newly developed drug, redefinition of marketing strategies, etc) justify the investment in such an analytic strategy.
Footnotes
Abbreviations
AE, adverse event; CI, confidence interval; CV, cardiovascular; CVOT, cardiovascular outcome trials; DCCT, Diabetes Control and Complications Trial; EDIC, Epidemiology of Diabetes Interventions and Complications; EMA, European Medicines Agency; FDA, Food and Drug Administration.
Declaration of Conflicting Interests
The author(s) declared the following potential conflicts of interest with respect to the research, authorship, and/or publication of this article: OS has worked as a consultant for several pharmaceutical and med-tech companies and is member of industry sponsored advisory boards. OS is CEO of Sciarc GmbH.
Funding
The author(s) received no financial support for the research, authorship, and/or publication of this article.