
Abstract
Background:
DM is associated with structural skin changes. However, few studies have investigated changes in dermal water and specifically its relationship to glucose control as measured by HbA1c. Our goal was to test the hypothesis that skin water, assessed by its tissue dielectric constant (TDC), is inversely related to HbA1c.
Methods:
Water content of 3 skin sites (forearm, lower leg, and foot dorsum) of 50 persons with DM was estimated by measuring TDC at 300 MHz. TDC is the ratio of tissue dielectric constant to vacuum and depends on free and bound water in the measured volume. TDC was measured in triplicate to 4 depths, 0.5. 1.5, 2.5, and 5.0 mm to include different skin components.
Results:
At each site increased measurement depth showed (1) a significant decrease in absolute TDC values and (2) a significant increase in foot-to-arm TDC ratios. TDC values at forearm were shown to be greater than at either leg or foot. However, testing of these 50 patients at 3 sites and 4 skin depths did not show any significant relationship between TDC and HbA1c or fasting glucose.
Conclusions:
The data indicate no relationship between TDC values, as indices for skin water, and HbA1c or fasting glucose. This implies that skin TDC values to assess skin property features and changes in persons with DM are not sensitive to recent glucose control. Furthermore, the results introduce a newly applied TDC technology useful to assess skin properties of persons with DM.
Keywords
Skin disorders are present in 79.2% of diabetes mellitus (DM) patients. 1 The overall prevalence of cutaneous manifestations in patients with DM do not differ much between type 1 and type 2. 2 Although prior research has shown that DM often entails changes in blood flow and blood vessels in the skin,3-6 full explanations for the associated biophysical changes in the skin remain unclear. Ultrasound data have shown that persons with DM have thinner skin (epidermis plus dermis) and less subcutaneous fat than age-matched people without diabetes. 7 These results suggest that structural changes within skin may directly or indirectly affect skin tissue water content. Prior literature suggests that hyperglycemia-induced nonenzymatic glycation of structural and regulatory proteins plays a major role in the pathogenesis of diabetic complications.8,9 Glycation occurs when an excess supply of glucose in blood plasma leads to a nonenzymatic chemical reaction between the carbonyl group of glucose and the amino acid of proteins. 10 Excess glycation of proteins tends to create and accumulate advanced glycation end products11,12 that occur in skin13,14 with levels that correlate with HbA1c. 15 However the effects of excess glucose on skin hydration is somewhat controversial with stratum corneum hydration reported as reduced 16 and unchanged. 17 Assessments of dermal water content suggest the presence of some DM-related changes 18 but further aspects of DM-related changes have not been extensively studied. We hypothesized that in persons with DM, dermal collagen glycation results in a reduced amount of skin water that could be detected by measuring skin’s tissue dielectric constant (TDC) at 300 MHz since TDC is largely dependent on skin free and bound water. If the hypothesis is true then an inverse relationship between TDC and HbA1c should be present. One study goal was to test this hypothesis. A second goal was to introduce the use of the TDC technology for the assessment of DM skin properties.
Methods
Subjects
A total of 50 persons with DM (32 female) participated in this study after signing an institutional review board (IRB) approved consent form. Patients were evaluated after their scheduled appointment time at the out-patient clinic. Of the 50 consecutive patients included in this study, 46 were type 2 DM patients and 4 were type 1 DM patients. All type 1 patients were females with an average DM duration (mean ± SD) of 39.0 ± 14.8 years. The DM duration for the type 2 patients was 8.0 ± 3.7 years. Male and females were similar in most parameters except for total body fat percentage which was greater for females as summarized in Table 1 along with other pertinent data corresponding to the studied patient group. BMI of the group ranged from 20.8 to 36.5 kg/m2 with 35 patients (70%) greater than 25 kg/m2 being either classed as overweight or obese. Entry requirements for participation were a clinical diagnosis of DM for at least 1 year and no skin condition on upper or lower extremities that would disallow measurements of skin water. Persons were excluded from participation if they had (1) any implanted wires or electronic devices or (2) any open wounds anywhere on the lower extremities.
Baseline Features of Subjects.
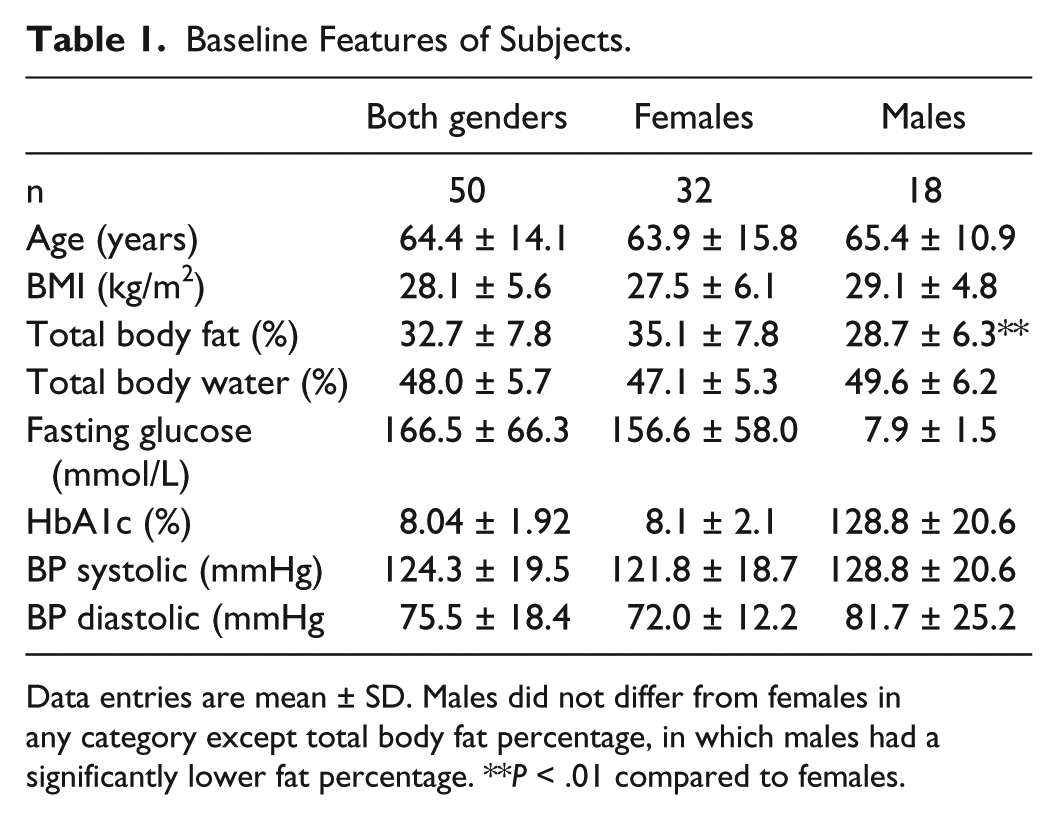
Data entries are mean ± SD. Males did not differ from females in any category except total body fat percentage, in which males had a significantly lower fat percentage. **P < .01 compared to females.
Measurements
Tissue Dielectric Constant (TDC)
The relative water content of 3 anatomical skin sites (forearm, lower leg and foot dorsum) was estimated by measuring TDC at a frequency of 300 MHz using the MoistureMeterD device manufactured by Delfin Technologies Ltd (Kuopio, Finland). The device (Figure 1) consists of cylindrical probes of different sizes that are connected to a control unit that displays the TDC value when the probe is placed in contact with the skin. The TDC value is a dimensionless quantity that is the ratio of the TDC to that of free space and has been used extensively for the estimation of skin water and its change.19-23 A single TDC measurement typically requires that the probe be in contact with the skin using light pressure for less than 10 seconds. Probe dimensions determine the effective measurement depth which, for the present study, was to depths of 0.5 mm, 1.5 mm, 2.5 mm, and 5.0 mm below the epidermis at all sites. The effective measurement depth is defined as the depth at which the 300 MHz electric field decreases to 1/e of its surface field. In general, TDC values depend largely on tissue water content and tissue composition in the region below the probe surface. The frequency of the probe, being 300 MHz, allows both free and bound water contributions to TDC to be determined. 24 For reference, pure water has a TDC value of about 76 at 32°C. The physics and principle of operation have been well described.25-28 The 300 MHz signal is generated within the control unit and is transmitted to the tissue via the probe that is in contact with the skin and acts as an open-ended coaxial transmission line. A portion of the incident electromagnetic wave is reflected in an amount that depends on the dielectric constant of the tissue, which itself depends on the amount of free and bound water in the tissue volume through which the wave passes. Reflected wave information is processed within a control unit, and the dielectric constant is displayed.
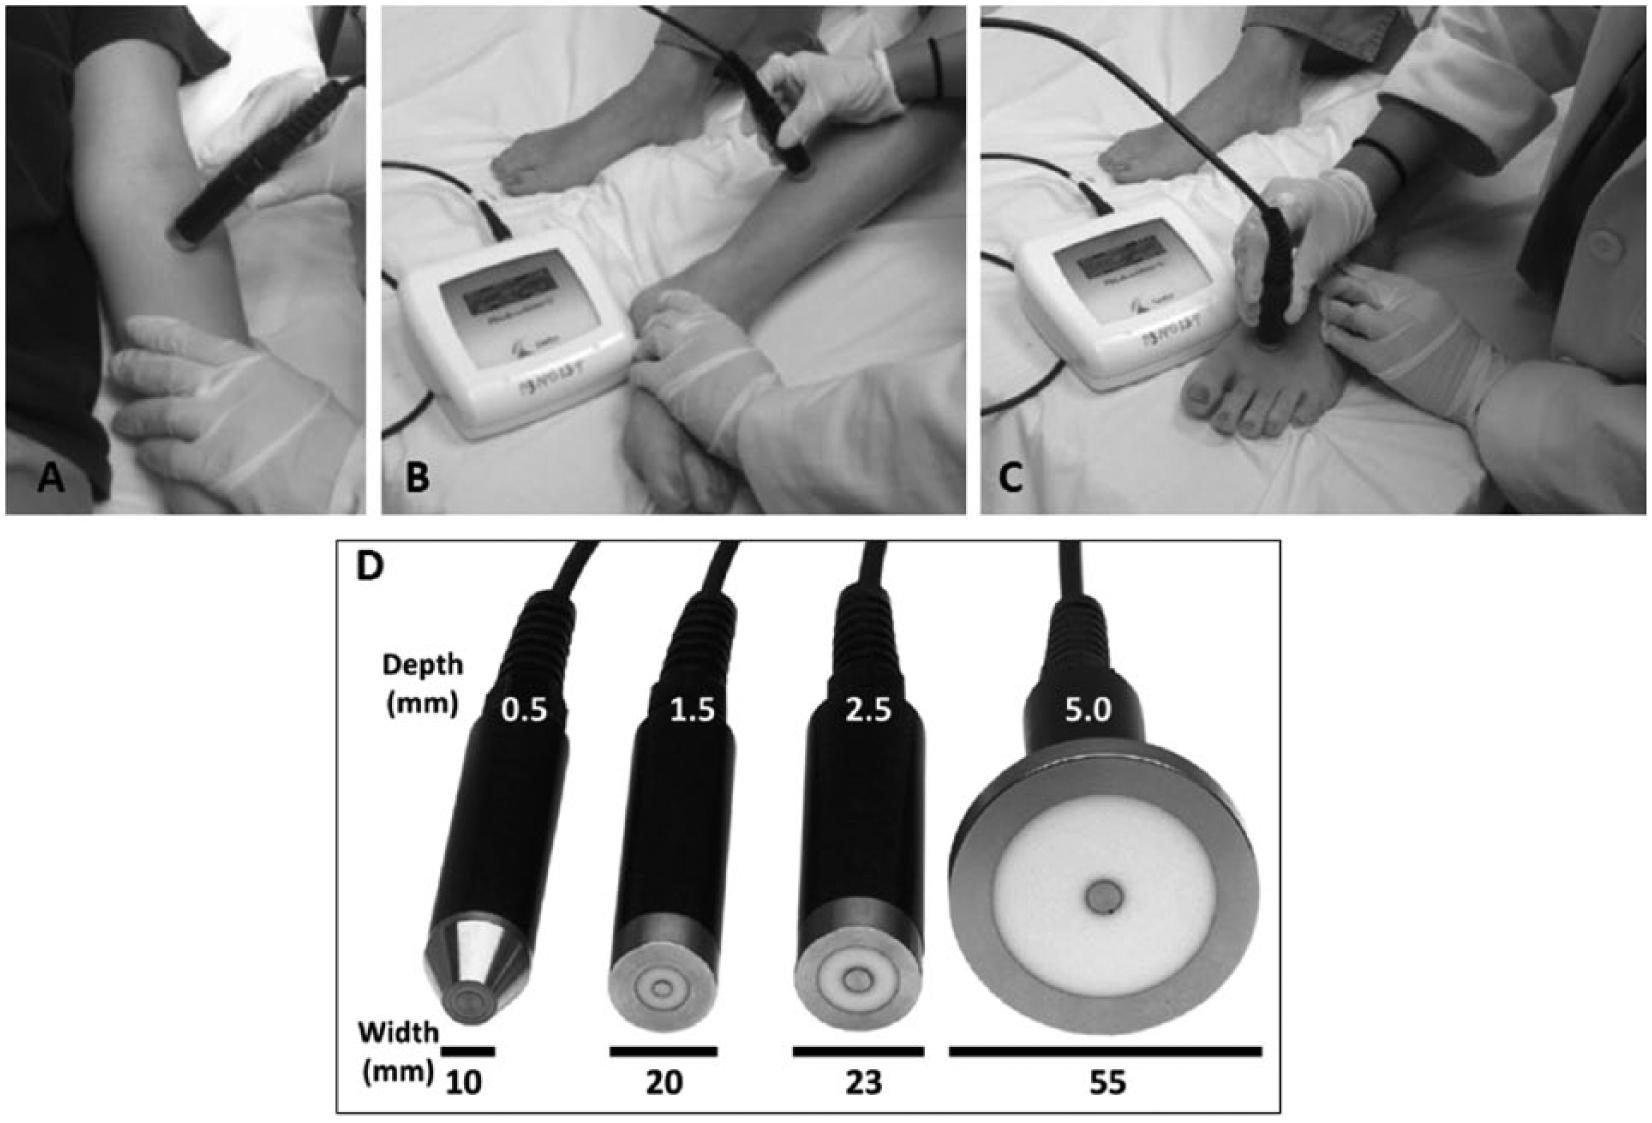
Tissue dielectric constant (TDC) measurements. Anatomical site measurements are illustrated using the 1.5 mm depth probe. Three sites were measured on 1 body side: (A) anterior forearm 6 cm distal to the antecubital fossa, (B) gaiter area 10 cm superior to the medial malleolus, and (C) foot dorsum slightly proximal to the junction of the 1st and 2nd toes. TDC values at each site were measured in triplicate and averaged. Actual measurements were to effective depths of 0.5, 1.5, 2.5, and 5.0 mm using the probes shown in (D).
Body Composition Parameters
Body composition parameters were estimated from bioimpedance measurements using the InnerScan Body Monitor (Tanita BC-558, Tokyo, Japan). This device measures body and segmental electrical impedances at 50 KHz while the subject stands and grips electrodes in each hand for about 20 seconds. Using gender, age, and height data as input, a company private algorithm based on impedance values is used to determine a percentages of total body fat, total body water, and limb segmental fat percentages based a model representation of the body components.
Analysis
Differences in TDC values among depths at each site were tested using a general linear model with repeated measures with effective measurement depth as the repeated measure and gender as the between subjects factor. If no gender differences were detected data were analyzed using combined gender data. Differences in TDC values among sites at each depth were tested using a general linear model with repeated measures with effective measurement depth as the repeated measure and site (forearm, leg, and foot) as the between subjects factor. Tests for differences between depths at any site and between sites were considered statistically significant with a P value < .01. Regression analysis was used to test for significant relationships between TDC values and HbA1c and related parameters.
Procedures
All research-related measurements were done within a closed area designated for experimental research with each patient lying supine on a padded examination table for TDC measurements. While supine, target measurement sites located on the patient’s self-expressed dominant body side were marked with a surgical pen. These sites were on the (1) anterior forearm 6 cm distal to the antecubital fossa, (2) the medial gaiter area located 10 cm proximal to the medial malleolus, and (3) slightly proximal to the junction of the first and second toes on a flat part of the foot dorsum. TDC measurements were then done in triplicate at each site. Forearm measurements were done first followed by leg site measurements and finally foot site measurements. TDC measurement order was using the 5 mm probe first and progressing to 2.5 mm, 1.5, and 0.5 mm depth probes. Whole-body and segmental bioimpedance was determined after completing all TDC measurements.
Results
TDC Values by Depth at Each Anatomical Site
General linear model analyses of TDC depth variation between genders among sites showed no gender differences but an overall decrease in TDC values with increasing depth as summarized in Table 2. At the forearm there was a monotonic decrease (P < .001) in TDC values with increasing depth with TDC values at 0.5 mm being 38.4 ± 5.5 and 25.8 ± 4.1 at a depth of 5.0 mm. At the leg site a similar directional decrease in TDC values was observed from 0.5 mm to 2.5 mm (P < .001) but values at 2.5 and 5.0 mm (34.1 ± 6.3 vs 33.0 ± 12.1) did not significantly differ from each other. At the foot dorsum site the shallower depths (0.5 and 1.5 mm) TDC values did not differ from each other but both were greater than values obtained at a depth of 2.5 and 5.0 mm (P < .01), which themselves differ between them (P < .01). Overall, forearm TDC values were less than for either the leg (P < .001) or foot (P < .001) with no overall difference between leg and foot TDC values. Foot/arm TDC ratios monotonically decreased with increasing depth (P < .001) and ranged from 1.028 ± 0.209 at 0.5 mm depth to 1.371 ± 0.395 at a depth of 5.0 mm with TDC values at each depth significantly different from each other (P < .01).
TDC Variations by Anatomical Site and Depth.
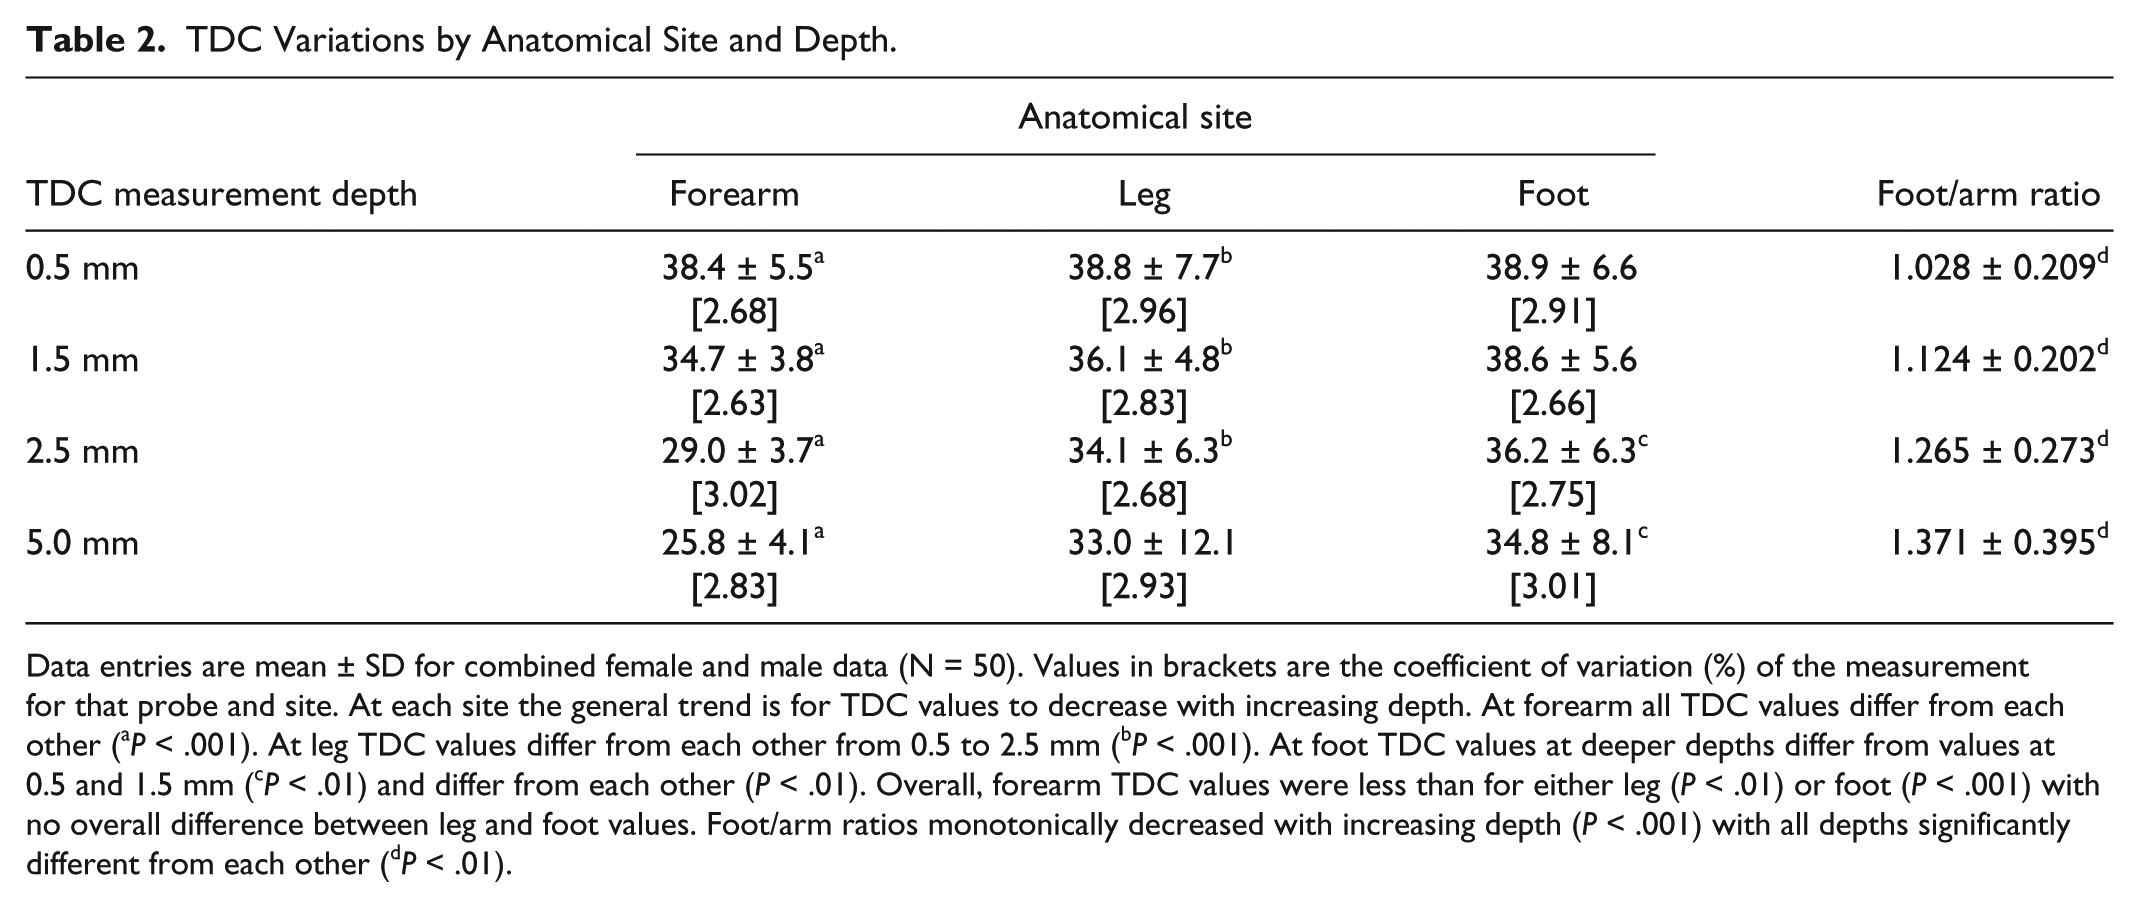
Data entries are mean ± SD for combined female and male data (N = 50). Values in brackets are the coefficient of variation (%) of the measurement for that probe and site. At each site the general trend is for TDC values to decrease with increasing depth. At forearm all TDC values differ from each other (aP < .001). At leg TDC values differ from each other from 0.5 to 2.5 mm (bP < .001). At foot TDC values at deeper depths differ from values at 0.5 and 1.5 mm (cP < .01) and differ from each other (P < .01). Overall, forearm TDC values were less than for either leg (P < .01) or foot (P < .001) with no overall difference between leg and foot values. Foot/arm ratios monotonically decreased with increasing depth (P < .001) with all depths significantly different from each other (dP < .01).
TDC Relationship to HbA1c
Regression analysis failed to show any significant relationship between TDC values measured at any site or depth with the patient’s HbA1c or with the patient’s fasting glucose on the day of the TDC measurements. This is well illustrated in Figure 2 that shows the variation in TDC values measured in the forearm at 0.5 mm and 5.0 mm versus HbA1c and the variation in TDC versus HbA1c as measured at the leg and foot sites to a depth of 1.5 mm. The resultant coefficient of determination (R2) values are not significantly different than zero thereby indicating essentially no detected correlation between any TDC value and HbA1c. Similar absence of relationships were found when fasting blood glucose was used as the independent variable.
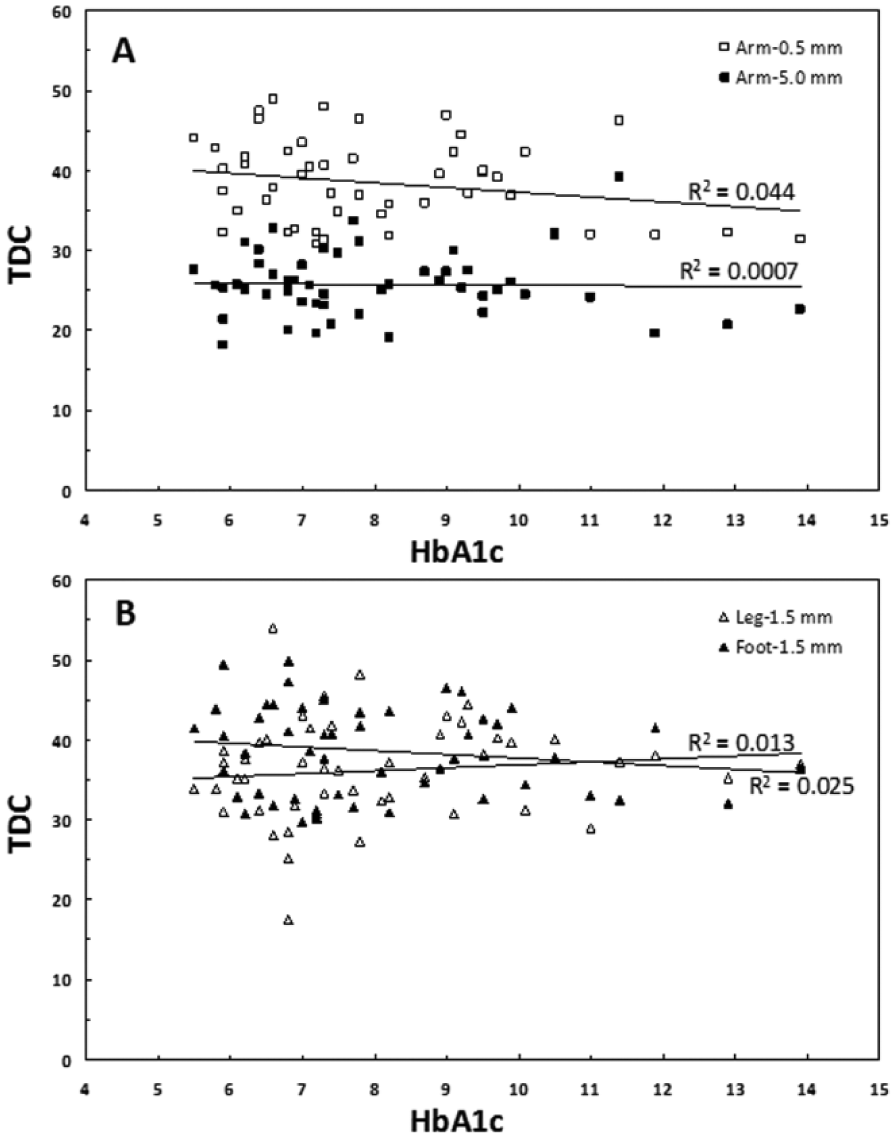
Absence of TDC-HbA1c relationship. Data points are TDC-HbA1c pairs for all 50 DM patients as measured on (A) forearm to depths of 0.5 mm and 5.0 mm and (B) leg and foot to 1.5 mm depths. R2 is the coefficient of determination showing essentially zero correlation between TDC and HbA1c.
Discussion
TDC Variation by Depth and Anatomical Site
Measurements of TDC in persons with DM have been used in only 1 study known to the authors to characterize DM skin tissue properties. 18 Therein TDC was measured bilaterally on forearm and foot dorsum to depths of 0.5, 1.5 and 2.5 mm in a group of 18 persons with and without DM. The authors reported that there was no difference in TDC values at forearm between groups but there was an approximately 15% greater TDC value of the DM group as measured on the foot dorsum. Subsequent calculations of TDC foot/arm ratios based on their data indicate the largest TDC ratio occurred at a measurement depth of 2.5 mm and this ratio was significantly larger than corresponding ratios of persons without DM (1.252 ± 0.039 vs 1.047 ± 0.053, P < .05). The foot/arm ratios of the present DM group measured to the same 2.5 mm depth was 1.265 ± 0.273, which is quite similar to the prior findings in persons with DM. The decreasing TDC values with increasing measurement depth herein observed are consistent with results obtained in several prior studies19,29 in which this monotonically decreasing pattern was attributed to the inclusion of increasing amounts of low water content fat with increasing measurement depth. The overall TDC data herein obtained at multiple depths and sites is a useful reference data set and as an aid to future assessments of DM skin features and changes that benefit from TDC measurements directly or as an index of skin tissue water changes.
TDC Variation by HbA1c
The main goal of this study was to test the hypothesis that in persons with DM, TDC values, used as index of skin tissue water, would be inversely related to their blood levels of glycosylated hemoglobin, HbA1c. This hypothesis was primarily based on considerations of interactions between interstitial water and enzymatic glycation processes. In addition however is the possibility that blood glucose concentration may through osmotic processes alter tissue water. An increase in blood glucose concentration tends to transiently reduce skin interstitial water content which would predict a decrease in measured TDC values associated with abrupt increases in glucose levels. However because of free diffusion from blood to interstitium an equilibrium between blood and interstitium is rapidly achieved. 30 This would suggest that the impact of this process on TDC measurements and variability would be small and would not alter the general findings. Testing of the hypothesis in 50 patients at 3 anatomical sites and to 4 skin depths has not demonstrated the hypothesized relationship. This runs counter to our expectation and in searching for explanations several come to mind.
First, in fact there is no meaningful relationship between HbA1c and skin tissue water. Literature data that might help resolve this issue are scarce. The TDC measurement always includes the entire epidermis in its measurement volume and depending on the probe used will include also the dermis with the 0.5 mm probe, the dermis and some of the hypodermis with 1.5 and 2.5 mm depth probes and the most hypodermis with the 5.0 mm depth probe. Yet almost all assessments of skin water to be found in the literature are restricted to measurements of stratum corneum (SC) water. SC water measurements of forearm and leg using capacitance methods in 38 persons with DM showed no significant difference as compared to a group of 40 persons without DM. 17 In that study the DM group had a similar age and DM duration as the presently studied group and the absence of a water content difference at forearm and leg sites would be consistent with prior findings using the TDC method that includes both epidermal and dermal water. 18 Contrastingly, measurements of forearm and leg SC water using high frequency conductance methods in 49 persons with DM 16 indicate significantly reduced SC water between DM patients grouped above and below fasting glucose levels of 110 mg/dl. However, nonsignificant reductions in SC water were found when patients were grouped by HbA1c values above and below 5.8%. 16 The absence of a difference in SC water between high and low levels of HbA1c would be consistent with our findings as measured by TDC but our data also indicate no differences attributable to fasting glucose level.
A second possibility is that the present measuring approach is not sensitive enough to detect such a relationship. Arguing against this possibility is the fact that the observed coefficients of determination between all TDC depths and sites and HbA1c and fasting glucose were essentially zero showing an effective absence of any correlation. If some unmeasured confounding factors masked the hypothesized relationship then a low but not zero correlation might be expected in some of the correlations. However, since such a possible confounding factor or factors are not known, then this possibility cannot be completely ruled out.
A third factor to possibly account for the absence of correlation between current glycemic control and tissue water content is the potential confounding effects of duration of control. Although HbA1c values do provide an index of the most immediate 3-month level of control it is conceivable that such values do not sufficiently characterize levels of control in the present context. However, as far as we are able to determine it would be the most applicable parameter readily available.
Finally it should be noted that a limitation of the present study is the fact that the possible effects of several copresent conditions that might have been confounders have not be assessed. These include the possible impact of microvascular deficits that might be present in skin in some of the studied patients and also the possible impact of copresent peripheral neuropathy.
Conclusions
The preponderance of the present data suggest the absence of a relationship between TDC values, as indices for skin tissue water, and either HbA1c or fasting glucose. This implies that skin TDC values to assess skin property features and changes in persons with DM are not sensitive to recent glucose control. Furthermore, the present results introduce a newly applied technology, TDC measurements to assess skin properties of persons with DM, and provide starting reference DM-related TDC reference data from which future studies may draw.
Footnotes
Abbreviations
DM, diabetes mellitus; HbA1c, glycosylated hemoglobin; IRB, institutional review board; SC, stratum corneum; TDC, tissue dielectric constant.
Declaration of Conflicting Interests
The author(s) declared no potential conflicts of interest with respect to the research, authorship, and/or publication of this article.
Funding
The author(s) received no financial support for the research, authorship, and/or publication of this article.