
Abstract
Introduction:
The accuracy of continuous glucose monitoring (CGM) systems is often assessed with respect to blood glucose (BG) readings. CGM readings are affected by a physiological and a technical time delay when compared to BG readings. In this analysis, the dependence of CGM performance parameters on the BG rate of change was investigated for 2 CGM systems.
Methods:
Data from a previously published study were retrospectively analyzed. An established CGM system (Dexcom G4, Dexcom, San Diego, CA; system A) and a prototype system (Roche Diagnostics GmbH, Mannheim, Germany; system B) with 2 sensors each were worn by 10 subjects in parallel. Glucose swings were induced to achieve rapidly changing BG concentrations. Mean absolute relative differences (MARD) were calculated in different BG rate-of-change categories. In addition, sensor-to-sensor precision was assessed.
Results:
At BG rates of change of –1 mg/dl/min to 0 mg/dl/min and 0 mg/dl/min to +1 mg/dl/min, MARD results were 12.6% and 11.3% for system A and 8.2% and 10.0% for system B. At rapidly changing BG concentrations (<–3 mg/dl/min and ≥+3 mg/dl/min), higher MARD results were found for both systems, but system B was less affected (system A: 24.9% and 29.6%, system B: 10.6% and 16.3%). The impact of rate of change on sensor-to-sensor precision was less pronounced.
Conclusions:
Both systems were affected by rapidly changing BG concentrations to some degree, although system B was mostly unaffected by decreasing BG concentrations. It would seem that technological advancements in CGM systems might allow for a more precise tracking of BG concentrations even at rapidly changing BG concentrations.
Proper diabetes management is a major requirement for people with diabetes to avoid late complications.1,2 People with diabetes typically use systems for self-monitoring of blood glucose (SMBG) to obtain information about their current blood glucose (BG) concentration. These measurements are often performed infrequently and thus cannot provide a comprehensive picture about the user’s glucose concentrations and, in consequence, the quality of their diabetes therapy.
Continuous glucose monitoring (CGM) systems can provide this kind of comprehensive picture. Currently available CGM systems have needle-type sensors that are inserted in the subcutaneous tissue and, depending on the model, remain there for several days. Many CGM systems provide real-time display of sensor glucose concentration values on a handheld receiver unit, giving the users information about their current glucose concentration at all times. One major disadvantage of CGM systems is their measurement inaccuracy. Published data show that the accuracy of CGM systems is not yet on a par with the accuracy of high-quality SMBG systems.3 -8
The accuracy of a specific CGM system depends on several factors, one of which is the rate of change in BG concentrations. Inaccuracy at rapidly changing BG concentrations is, in part, caused by the fact that CGM systems measure glucose concentrations in the interstitial tissue, while SMBG measurements are performed on capillary blood samples. A physiological time delay is thus expected under such conditions. The extent of this time delay was investigated by several different groups and, in general, found to be less than 10 minutes.9 -13 It appears as if this physiological time delay may work both ways, with BG changes preceding interstitial glucose changes as well as interstitial glucose changes preceding BG changes.11,14 Further research assessing this time delay on a large scale and in a systematic manner could help clarify this issue. An additional time delay is introduced through the sensor architecture because the glucose has to pass through the membranes surrounding the electrodes and, for sensors using a glucose oxidase enzyme, the hydrogen peroxide that is created through the glucose oxidase reaction has to move to the electrode. 15 The algorithm implemented in the CGM system for conversion of the raw sensor signal into glucose concentrations can also lead to an additional time delay, for example, when the raw data are smoothed for noise reduction. This time delay is introduced as soon as any filter algorithm is implemented and it increases with stronger filtering. A high-quality raw signal requires minimal filtering and data processing resulting in a cleaner sensor response and only little delay between the data shown and the raw signal. As a consequence, CGM and BG results that are paired according to their time stamp may be inadequately paired from the physiological point of view. However, high accuracy is crucial at fast BG rates of change, especially when the BG concentration is decreasing to allow for adequate reaction to impending hypoglycemia. The Clinical and Laboratory Standards Institute (CLSI) guideline POCT05-A addresses this issue by recommending data collection segments with BG rates of change below –3 mg/dl/min and above +3 mg/dl/min and the evaluation of the rate dependence. 16
There are many publications which present accuracy data for CGM systems, but only a few of these provide information about phases of rapidly changing glucose concentrations.4,6,8,17 -20 Detailed information about accuracy at specific BG rates of change are even scarcer.3,4,18
For the results presented here, data obtained in a clinical study8,20 were analyzed in a post hoc evaluation to investigate the rate-of-change dependence of 2 CGM systems.
Methods
The study was conducted in October 2012 at the Institut für Diabetes-Technologie GmbH an der Universität Ulm in Ulm, Germany in compliance with the German Medical Devices Act (MPG) and the Good Clinical Practice provisions of the Declaration of Helsinki. The competent authority (Bundesinstitut für Arzneimittel und Medizinprodukte; Federal Institute for Drugs and Medical Devices) and the responsible ethics committee (Landesärztekammer Baden-Württemberg; state board of physicians) approved the study protocol. Details about the study design were published recently.8,20
Continuous Glucose Monitoring Systems
In the study, 2 CGM systems were evaluated: the Dexcom G4 (Dexcom, San Diego, CA) stand-alone system, hereinafter referred to as “system A,” and a prototype system developed by Roche Diagnostics GmbH (Mannheim, Germany), hereinafter referred to as “system B.” 15 According to the distributor, the Dexcom G4 stand-alone system is identical to the Dexcom G4 Platinum system sold in the US at that time. Reportedly, the G4’s software algorithm has since been updated.17,21 System A was used according to the manufacturer’s labeling, including the wear time of the sensor (7 days), the calibration intervals and the sensor location on the body. System B was used according to the instructions in the Investigator’s Brochure provided by the manufacturer. It is currently not available on the market. Since system B did not have a real-time display, raw data were wirelessly downloaded onto a study computer multiple times per day. For technical reasons, a prospective online calibration was not feasible with system B, but prospective calibration is an intended feature of the final product. Instead, the raw data were calibrated simulating a prospective calibration with 2 calibrations per day. This means that for the calibration of each 12-hour segment, the calibration algorithm was only provided with calibration BG values (and raw sensor signal) up to the beginning of the respective calibration segment. As the intended prospective calibration algorithm was used for the simulation, and the algorithm would under normal circumstances not ask for more BG values than 1 value every 12 hours after the initial calibration, a prospective calibration would have resulted in the same glucose readings as the simulated calibration did. The final product will have fail-safes that might request additional calibrations in between the 12-hour intervals under certain circumstances. However, these fail-safes were not active in this study.
Calibration BG values were obtained with a commercially available SMBG system (Accu-Chek® Aviva, Roche Diagnostics GmbH, Mannheim, Germany). This same meter was used throughout the study (see below).
Study Design and Population
The analysis presented here is based on data from a study that was published earlier.8,20 In total, there were 30 subjects who wore system B sensors; 20 10 of these subjects also wore system A sensors. 8 Detailed information about the study procedure and participants can be found in the respective publications.8,20 The analysis presented here is based on data of the 10 subjects who wore both systems in parallel. Each of these subjects wore 2 sensors of each system type simultaneously. The sensors were inserted into the periumbilical subcutaneous tissue with at least 5 cm to approximately 10 cm (depending on the size of the individual subject’s abdominal area) between each other. In 5 subjects, the 2 system A sensors were placed above the navel and the 2 system B sensors were placed below the navel and vice versa for the other 5 subjects.
Approximately 45 hours and 70 hours after sensor application, glucose swings were induced by serving high-glycemic-index breakfasts composed of approximately 80% carbohydrates, 10% protein and 10% fat and providing a maximum of 20% of the subject’s daily caloric requirement. The corresponding prandial insulin bolus was increased by approximately 15% and delayed for approximately 15 minutes. This procedure allowed for early postprandial hyperglycemia and late postprandial hypoglycemia. During these swings, the subjects were supervised by a physician to ensure subject safety. Hypoglycemia was defined as BG readings of ≤55 mg/dl or as the presence of hypoglycemia symptoms. In addition, study staff was on alert as soon as BG readings of ≤70 mg/dl were observed. As BG measurements were already obtained every 15 minutes during induced glucose swings, measurement frequency was not increased further as BG concentrations were already tracked closely. In the case of hypoglycemia, subjects were provided with fast-absorbing carbohydrates. Except for the prandial bolus adjustments, subjects followed their regular diabetes therapy. Figure 1 shows data from a representative induced glucose swing.
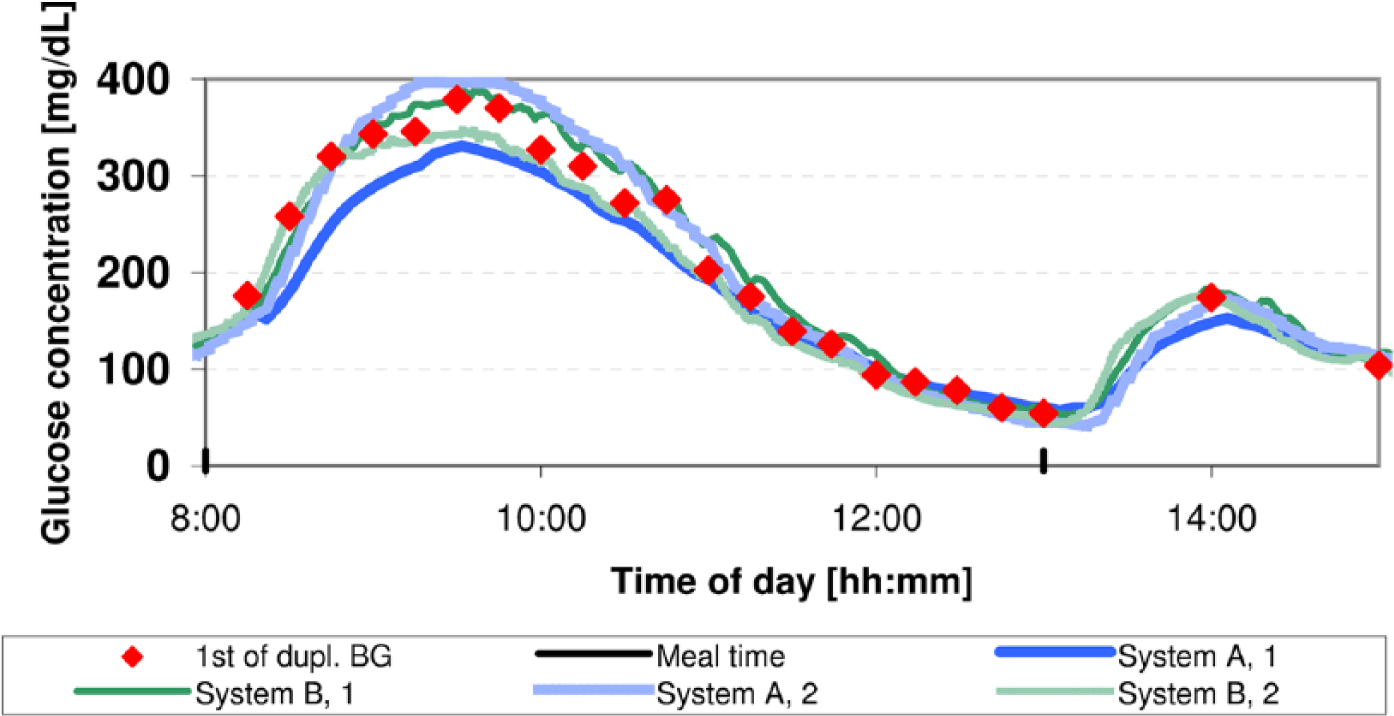
Example of a glucose trace obtained from 1 subject in 1 of 2 induced glucose swings. BG measurements are displayed by red diamonds. Light and dark traces (blue for system A and green for system B) show the CGM measurements obtained during the swing. Meals were served at 8:00 and at 13:00.
To allow for data analysis following some of the recommendations of the CLSI guideline POCT05-A, 16 capillary BG measurements were performed every 15 minutes for approximately 5 hours beginning at the time the meal was consumed. Outside of these induced glucose swings, capillary BG measurements were performed approximately once per hour between 7:00 and 23:00 and once at night. Additional measurements were performed at the attending physician’s discretion, especially in the case of BG readings of ≤70 mg/dl or in the presence of hypoglycemia symptoms.
Data Analysis
The accuracy of the CGM systems was assessed by mean absolute relative difference (MARD) and precision absolute relative difference (PARD). The MARD is the average of the absolute relative differences between individual BG readings and corresponding CGM readings, while the PARD is the average of the absolute relative differences between the readings of the 2 sensors of the same type in the same subject.22,23 The CGM systems recorded glucose readings every 5 minutes (system A) and every minute (system B), respectively. Since capillary BG measurements did not necessarily coincide with sensor readings from system A, readings from system A sensors were linearly interpolated to obtain 1 reading per minute.
The primary objective of this analysis was the assessment of the rate-of-change dependence of the CGM systems during induced glucose swings. Individual absolute relative differences were analyzed and distributed into one of 8 different rate-of-change categories ranging from < –3 mg/dl/min to ≥ +3 mg/dl/min in steps of 1 mg/dl/min. Rates of change were calculated based on the capillary BG readings:
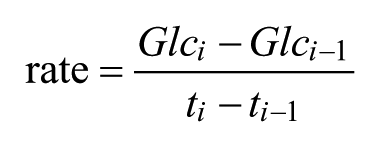
in which ti and ti-1 are the timestamps of the i-th and (i-1)-th capillary BG readings, respectively, and Glci and Glci-1 are the capillary BG readings corresponding to these capillary BG timestamps.
P values given in this article were calculated using 2-sided Wilcoxon rank sum tests. Adjustment of P values was not performed.
In an additional analysis, the distribution of MARD results of individual complete sensor experiments (approximately 7 days, each) was investigated. For this additional analysis, only 1 measurement per hour was included during the induced glucose swings so that these swings were not overrepresented in the overall results. Since the study participants wore all sensors in parallel, SMBG readings and calibration readings were the same for both systems throughout the entire study.
Results
Out of 20 sensor experiments started with each type of CGM system, 20 sensor experiments were included in the analyses for system A and 19 sensor experiments for system B; 1 sensor experiment had to be excluded because of a sensor malfunction on day 2.
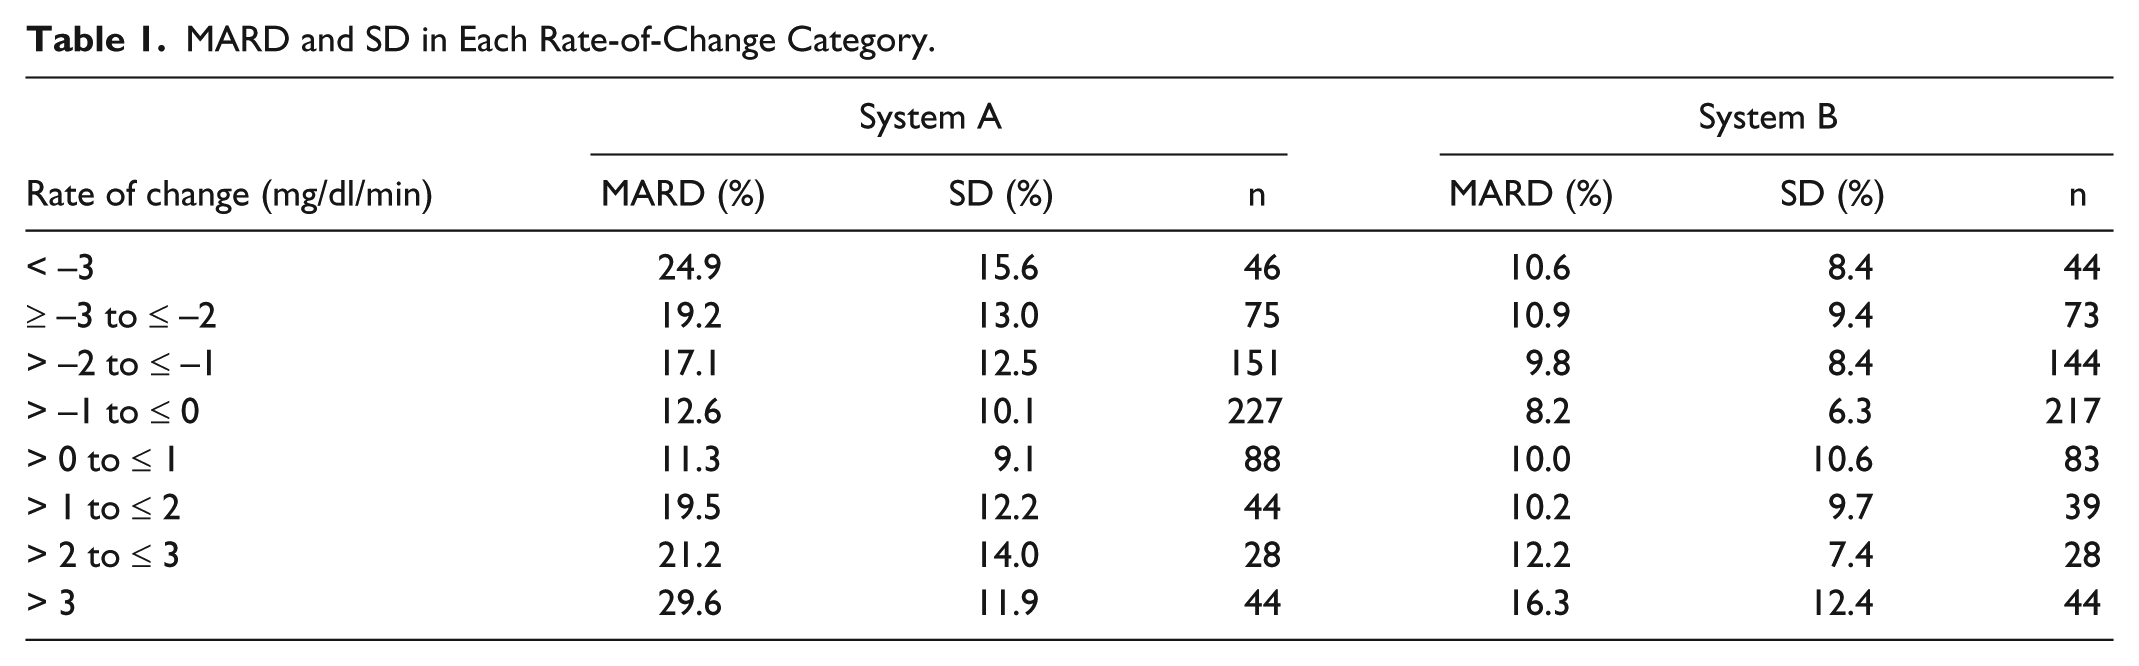
Both CGM systems showed a rate-of-change dependence to a certain degree. System A showed MARD results of 12.6% and 11.3% in the categories –1 mg/dl/min to 0 mg/dl/min and 0 mg/dl/min to +1 mg/dl/min, respectively, while MARD was 24.9% and 29.6% at rates below –3 mg/dl/min and above +3 mg/dl/min, respectively. The corresponding MARD results for system B were 8.2%, 10.0%, 10.6%, and 16.3%, respectively (see Table 1, Figure 2). Except for the category 0 mg/dl/min to +1 mg/dl/min, the MARD results between system A and system B were statistically significantly different (P < .05). In a subanalysis, MARD was stratified by both rate-of-change category and glucose concentration category (<70 mg/dl, ≥70 mg/dl to <180 mg/dl, and ≥180 mg/dl). In this subanalysis, system B showed similar to lower MARD results than system A. Detailed results can be found in the supplemental data (available at dst.sagepub.com/supplemental).
MARD and SD in Each Rate-of-Change Category.
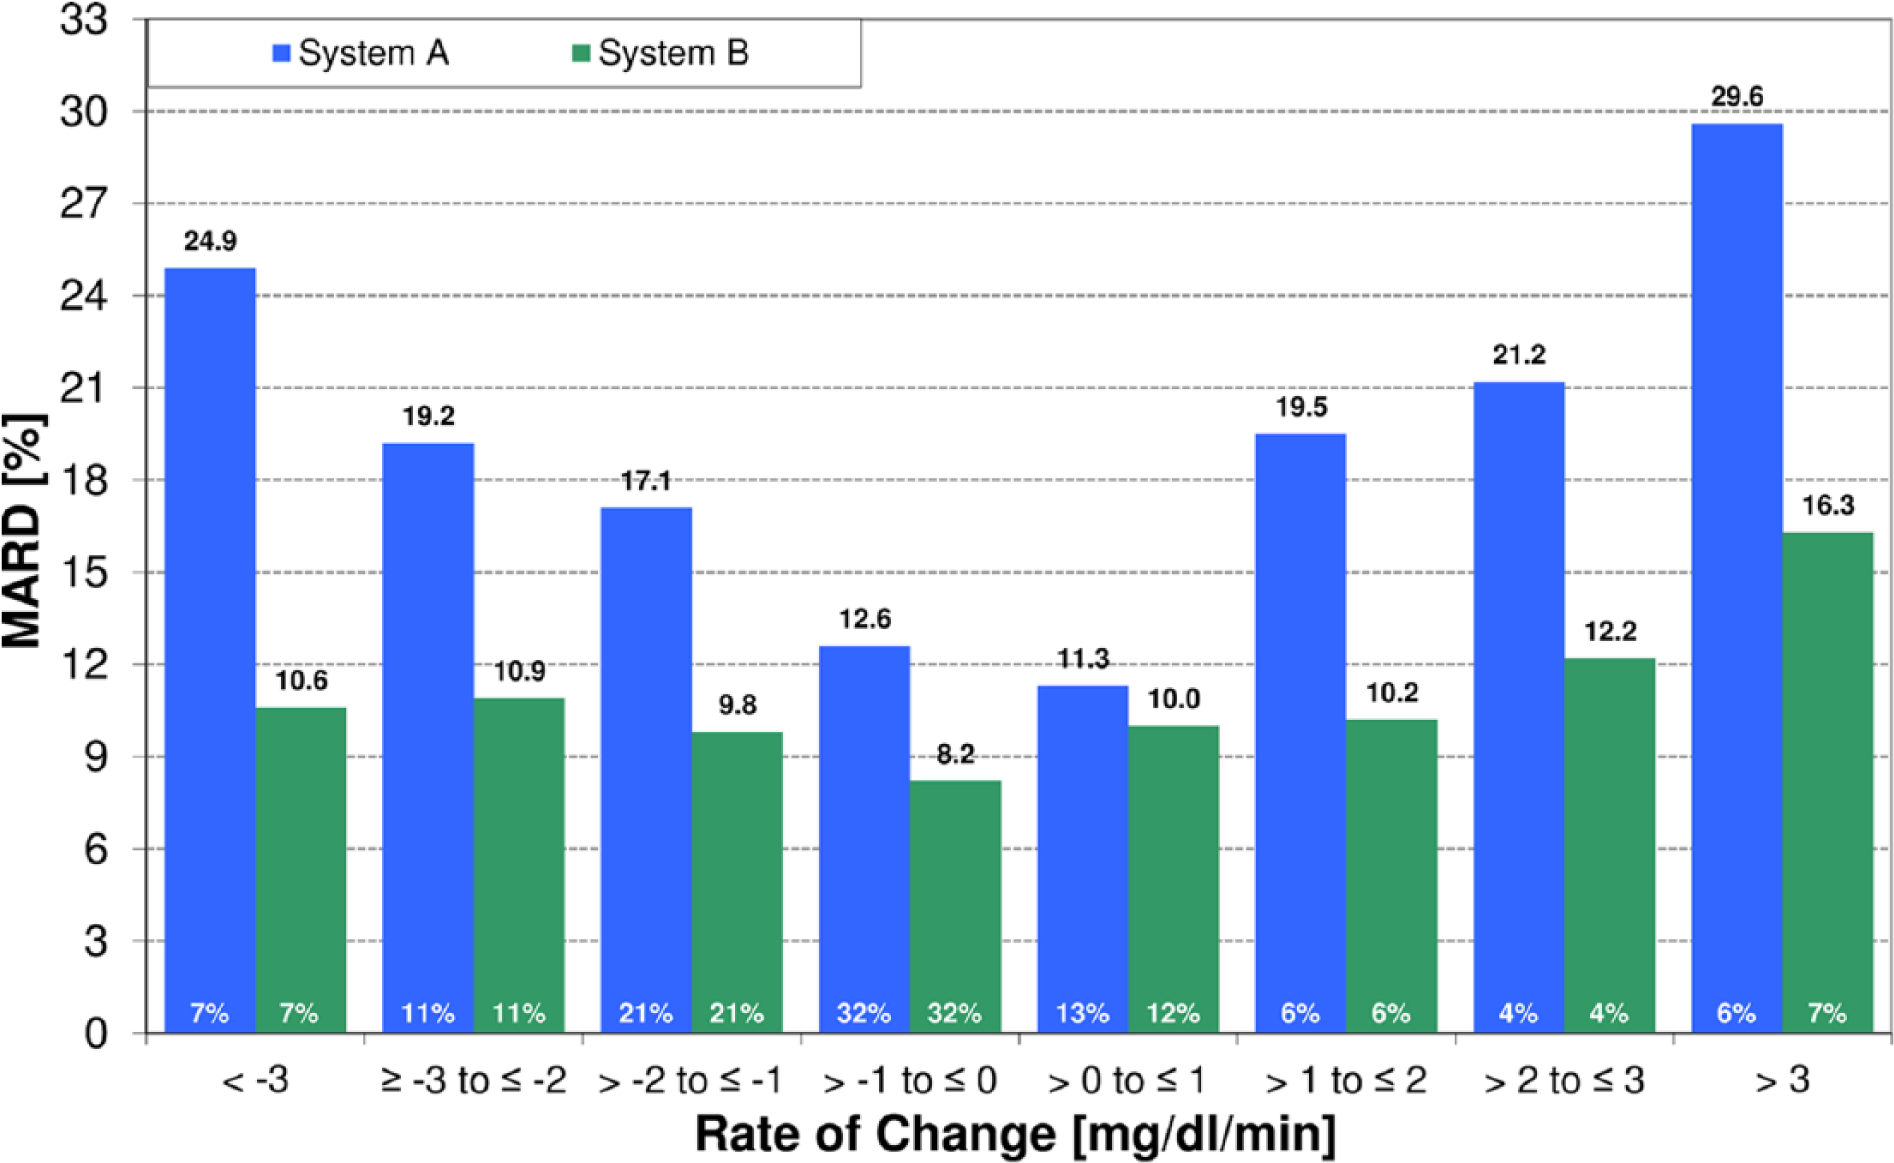
MARD over rate-of-change category; white numbers in bars are percentages of results within that category.
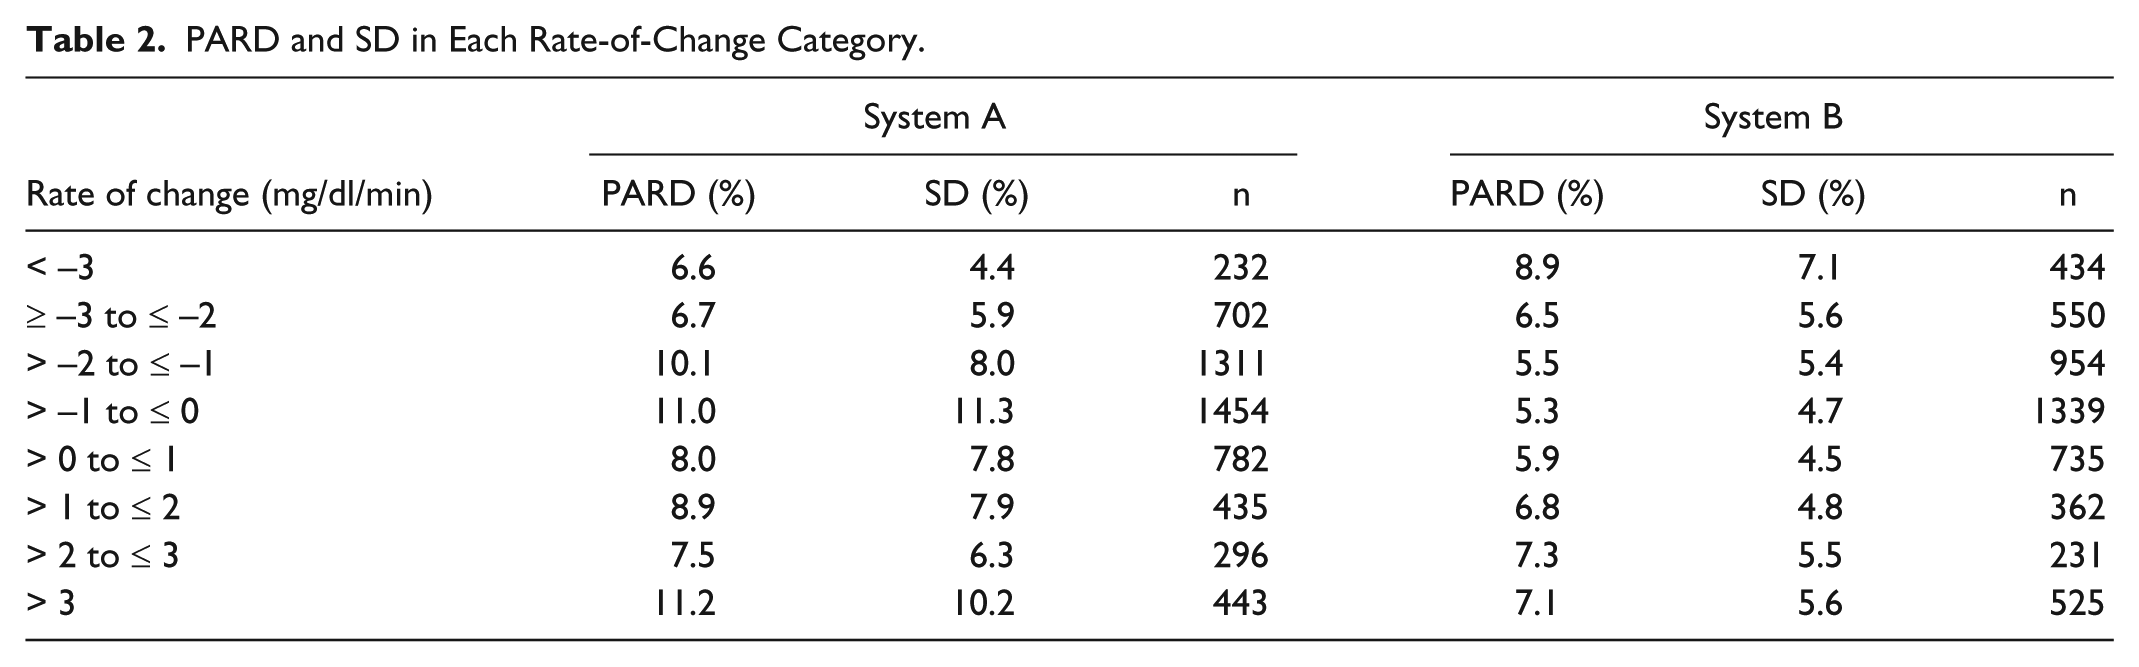
PARD results in these categories were similar between both CGM systems with 11.0%, 8.0%, 6.6%, and 11.2%, respectively, for system A and 5.3%, 5.9%, 8.9%, and 7.1%, respectively, for system B (see Table 2).
PARD and SD in Each Rate-of-Change Category.
The mean overall MARD results of the individual complete sensor experiments were 10.9% for system A and 8.6% for system B. As shown in Figure 3, the cumulative distribution of individual MARD results for system B runs to the left (ie, toward lower MARD/higher accuracy) of the distribution for system A, so that a higher percentage of system B MARD results is below any given MARD threshold than system A MARD results. For example, more than 80% of individual complete sensor experiments for system B had MARD results below 10%, as opposed to 20% for system A (see Figure 3).
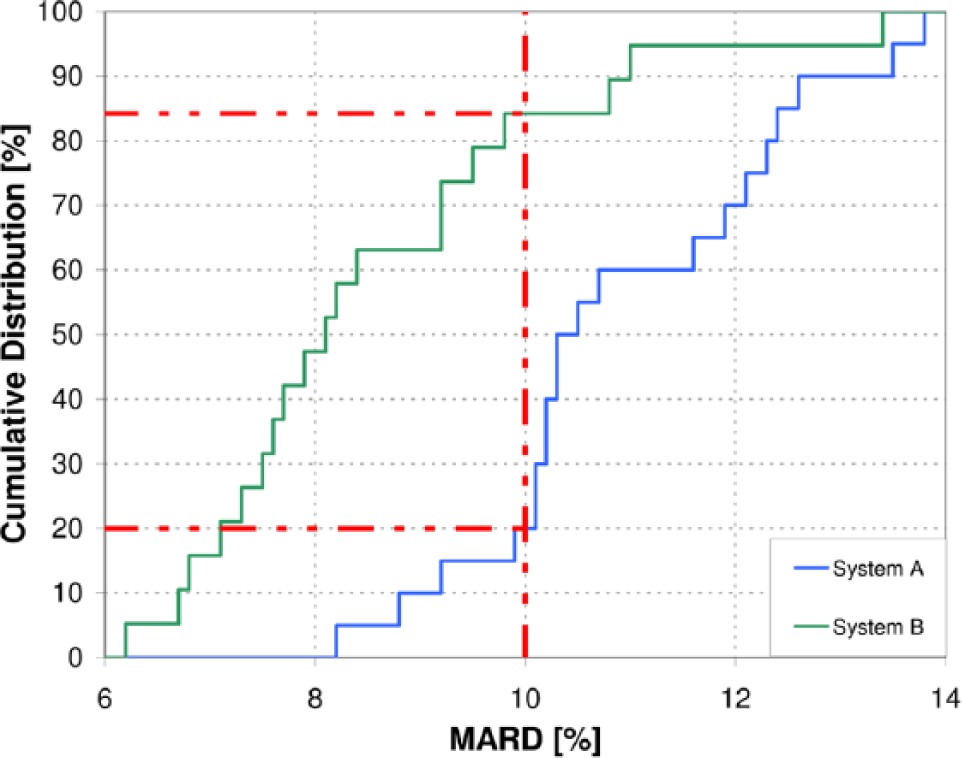
Distribution of individual sensor experiment MARD results. Overall MARD was 10.9% for system A and 8.6% for system B.
The mean overall PARD was, as previously reported, 8 7.3% for system A and 6.2% for system B.
Discussion
CGM systems report glucose concentrations with a time delay for physiological and technical reasons. This time delay can lead to apparently decreased measurement accuracy at rapidly changing glucose concentrations and it is likely that faster glucose concentration changes result in a more pronounced apparent decrease in accuracy. In the analysis presented here, data from a clinical trial were used to assess the rate-of-change dependence of the accuracy of CGM systems. Study procedures were performed implementing recommendations of the CLSI guideline POCT05-A. 16 Both CGM systems showed rate-of-change dependence to a certain degree. While system A was affected by both rapidly increasing and rapidly decreasing glucose concentrations, system B seemed mostly unaffected by decreasing glucose concentrations as shown in Table 1. System A showed statistically significantly higher (ie, worse) MARD than system B in 7 out of 8 rate-of-change categories, whereas the difference did not reach statistical significance in 1 category. Its rate-of-change dependence, that is, the relative increase in MARD, seemed to be more pronounced. Bailey and colleagues recently presented MARD results for another CGM system. 3 While they also investigated the rate-of-change dependence of MARD, their results are hardly comparable since their distribution of absolute rate of change was very different (approx. 78% within 0 to <1 mg/dl/min and only 5% ≥2 mg/dl/min). 3
The PARD of the 2 systems differed moderately between the rate-of-change categories. This indicates that the rate-of-change dependence of the 2 sensors of the same system is similar.
Although the overall MARD of the systems was somewhat comparable (10.9% for system A vs 8.6% for system B), system B showed lower MARDs in the individual experiments (see Figure 3). This suggests that overall MARD may not reflect all information relevant to the accuracy of the CGM system and that additional parameters or subanalyses are required for a comprehensive accuracy evaluation. The overall MARD result obtained from all 30 subjects who wore system B was 9.2%. 20 This indicates that interpatient variability, and thus the selection of subpopulations, may affect performance parameters. The overall PARD results corroborate this finding (7.6% for all 30 subjects, 20 6.2% for the 9 pairs evaluated in this analysis).
The reason for system B being less affected by decreasing glucose concentrations than system A is not necessarily clear. Since both types of CGM system were worn by the same subjects, the physiological time delay should presumably have had no impact on these differences in accuracy. It is therefore much more likely that these differences were caused by the system-inherent technical time delay, that is, the time delay introduced through noise filtering or data smoothing algorithms. 15 However, without in-depth knowledge of the architecture and software of both investigated CGM systems, the specific source(s) cannot be determined.
The accuracy in the low glycemic range obviously plays a vital role in avoiding the negative effects of hypoglycemia.24 -29 However, the rate-of-change dependence of CGM accuracy is also very important. High accuracy, even at rapidly changing BG concentrations, helps users react properly to impending hypoglycemia—possibly even enabling the prevention of hypoglycemia.
There are some limitations that must be considered when interpreting the results. First, the absolute number of individual paired readings in the extreme rate-of-change categories was relatively small, which might limit the representativeness of the data. While the percentage of results in the extreme rate-of-change categories (>10% in total) seems acceptable with respect to CLSI POCT05-A recommendations, 16 a larger-scale study would be necessary to provide the necessary data pool. Second, it is unclear how often extreme rates of change are actually encountered in the hands of end-users. 30
In conclusion, the data presented here, as well as data published over the last years, indicates that both technological advances in CGM sensors as well as usage of optimized algorithms for the conversion of sensor signals to BG readings might enable future CGM systems to provide more precise tracking of rapid BG swings than current CGM systems do. Higher accuracy at decreasing glucose concentrations could allow for earlier detection of impending hypoglycemia and thus improve the quality of diabetes therapy.
Footnotes
Acknowledgements
We would like to thank Lutz Heinemann, Luigi del Re, Oliver Schnell, and Volker Lodwig for their valuable input in the discussion of the data and review of the manuscript.
Abbreviations
BG, blood glucose; CLSI, Clinical and Laboratory Standards Institute; CGM, continuous glucose monitoring; MARD, mean absolute relative difference; PARD, precision absolute relative difference; SD, standard deviation; SMBG, self-monitoring of blood glucose.
Declaration of Conflicting Interests
The author(s) declared the following potential conflicts of interest with respect to the research, authorship, and/or publication of this article: SP, CH, ML, and EZ have no conflict of interest to disclose. MS, KM, and GSR are employees of Roche Diagnostics GmbH, Germany. GF is general manager of the IDT (Institut für Diabetes-Technologie Forschungs- und Entwicklungsgesellschaft mbH an der Universität Ulm, Ulm, Germany), which carries out studies on the evaluation of BG meters and medical devices for diabetes therapy on behalf of various companies. GF/IDT have received speakers’ honoraria or consulting fees from Abbott, Bayer, Berlin-Chemie, Becton-Dickinson, Dexcom, Menarini Diagnostics, Novo Nordisk, Roche Diagnostics, Sanofi, and Ypsomed.
Funding
The author(s) disclosed receipt of the following financial support for the research, authorship, and/or publication of this article: The study on which the analysis presented here is based was funded by Roche Diagnostics GmbH, Germany. The medical writing was supported by Roche Diagnostics GmbH, Germany.
References
Supplementary Material
Please find the following supplemental material available below.
For Open Access articles published under a Creative Commons License, all supplemental material carries the same license as the article it is associated with.
For non-Open Access articles published, all supplemental material carries a non-exclusive license, and permission requests for re-use of supplemental material or any part of supplemental material shall be sent directly to the copyright owner as specified in the copyright notice associated with the article.