
Abstract
The measuring method for glycated albumin (GA) has been developed as a new glycemic control marker since the beginning of the 21st century. Since GA has an advantage in reflecting glycemic status over a shorter period than hemoglobin A1c (HbA1c), much research and many reviews have been reported. However, so far there have been few reports on glycation sites based on the tertiary structure of human serum albumin (HSA) and the comparison of glycation rates between GA and HbA1c in detail. The present review discusses how the glycation sites of lysine residues in HSA are modified with glucose, whereas the glycation sites of lysine residues are located inside of HSA as well as the direct comparison of glycation rates between GA and HbA1c using human blood. Moreover, the most recent clinical researches on GA are described.
Diabetes currently occurs in about 382 million people worldwide, the majority of whom live in developing countries. 1 Long-term hyperglycemia can produce complications such as retinopathy, nephropathy, neuropathy and macroangiopathy, increasing the risk of blindness, the need for dialysis, the necessity for lower-limb amputation, and the occurrence of heart disease and stroke.2-4 Diabetes tests include measurement of blood glucose level, which is easily influenced by diet and the patient’s condition. Therefore, recently hemoglobin A1c (HbA1c) and glycated albumin (GA) have been employed as glycemic markers,5-7 because early-stage glycation involves the reaction of amino groups on the protein molecule with a reducing sugar such as glucose to form a Schiff base, which then forms a stable Amadori compound through Amadori rearrangement. As for GA assay methods, while the boronate affinity assay, 8 high-performance liquid chromatography (HPLC),9,10 and immunoassays 11 were reported, an enzymatic reagent was developed for measuring GA in 2002, making it possible to easily measure GA with enzymatic specificity.12,13 GA has an advantage in reflecting glycemic status over a shorter period than HbA1c. 14 HbA1c does not accurately reflect glycemic status in diseases that influence the erythrocyte life span.15,16 Moreover, in late pregnancy, iron-deficiency anemia has the effect of raising HbA1c levels but does not affect GA levels.17,18 Thus, original researches on GA in vitro19-23 or clinical usage24-27 and review articles of GA28-31 have recently increased whereas HbA1c has a long history of research.
So far, there have been reports on the identification of glycated sites in human serum albumin (HSA)19,20,32 and the tertiary structure of HSA in the absence 33 or presence of fatty acids 34 were determined. However, there have been few reports of reactivity of lysine residues in HSA with glucose based on its tertiary structure. On the other hand, while GA has an advantage in reflecting glycemic status over a shorter period than HbA1c, there have been few reports on the direct comparison of glycation rates between GA and HbA1c. In this review, we discuss why glycated lysine residues in HSA are modified with glucose whereas the glycation sites of lysine residues are located inside of HSA molecule, as well as the direct comparison of glycation rates between GA and HbA1c using human blood.
Glycated Sites in Glycation of HSA
HSA is a globular protein with a molecular weight of 66 438 and is composed of 585 amino acid residues. This protein occurs at high concentrations (3.0 to 5.0 g/dl) in serum and accounts for about 60% of protein content in serum. It aids in the regulation of osmotic pressure and pH, and functions as an antioxidant.35,36 It also acts as a transport protein, binding to hormones, lipids, drugs, and ions. 35
As was shown in the introduction, HSA is the notable protein to evaluate human glycemic status. In nonenzymatic reaction of HSA with glucose in human blood, early-stage glycation involves the reaction of amino groups on the protein molecule with glucose to form a Schiff base resulting in forming a stable Amadori compound through Amadori rearrangement. Advanced-stage glycation after Amadori rearrangement has been widely examined in HSA because the N-terminal amino group except for the side chains of lysine residues and those of arginine residues in HSA involve as glycated amino groups in this glycation process. 30 Moreover, it was suggested that advanced glycation end products formed as a result of oxidation or dehydrogenation of early-stage glycation products or by direct modification of amino groups by compounds such as methylglyoxal.37,38 Therefore, since HSA is thought to have various reaction sites with glucose or its derivatives even in its recommended glycoalbumin assay method, the Committee on Diabetes Mellitus Indices, Japan Society of Clinical Chemistry 39 defined GA as albumin having glucose bonded to a lysine residue in HSA. While a standard assay method using isotope dilution mass spectrometry (ID/MS) for GA has been already proposed, the enzymatic method for GA have shown good correlation with ID/MS. Thus, standardization of GA came a step closer
In 2013, Anguizola et al published a review article that summarized HSA glycation sites. 30 To date, analyses of the 59 lysine residues in HSA using reversed-phase HPLC, 32 liquid chromatography mass spectrometry (LC/MS), 19 and LC/MS/MS 20 have confirmed that glycation occurs frequently at the following residues: Lys525, Lys439, Lys199, Lys51, Lys378, Lys545, Lys12, Lys233, Lys276, Lys281, Lys317, Lys323. In addition to in vitro experiments, in vivo research also indicates that glycation readily occurs at Lys525, Lys439, and Lys199. 32
However, Marashi et al have raised questions about Lys525 being the main glycation site given its low accessibility. 40 Figure 1 shows the solvent accessibility of the epsilon-amino group on lysine residues calculated from the results of X-ray crystallography of recombinant HSA (PDB ID: 1A06). These results indicate that solvent accessibility is low at the epsilon-amino group on Ly199 as well as the epsilon-amino group on Lys525 in recombinant HSA.
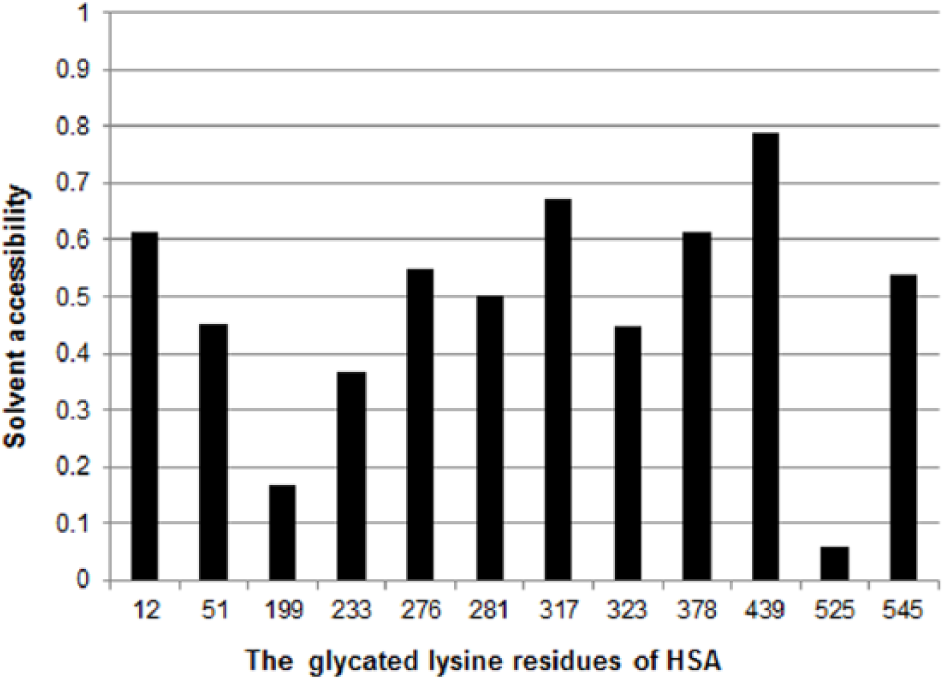
Solvent accessibility of amino groups on highly reactive lysine residues in HSA. This chart shows the solvent accessibility of the epsilon-amino group on HSA lysine residues calculated from X-ray crystallography (PDB ID: 1A06) of recombinant HSA. Solvent accessibility was calculated using ASA view. 53
In 2013 Wang et al performed X-ray crystallography on recombinant HSA crystallized in the presence of glucose. 21 As a result, they reported that glucose bonded at site 1, the binding site of many drugs, and also formed a covalent bond with Lys195 at site 1. This result suggests that glucose readily reacts with lysine residues after directly bonding with HSA at glucose affinity sites (in vitro glycation). The reactivity of glucose with Lys199 also suggests that the reactivity of glucose toward Lys195 plays a role. However, this article by Wang et al does not discuss the reactivity of Lys525, which is located in domains other than site 1, and which shows a high binding rate with glucose in vitro.
HSA functions in vivo as a transport protein for fatty acids. Petitpas et al have reported the X-ray crystal structure of HSA complexed with the unsaturated fatty acids oleic acid and arachidonic acid, which frequently bind to HSA in the body. 34 Fatty acids bind to 7 sites, primarily sites 1 and 2, and it has been shown that the epsilon-amino groups on Lys525 and Lys199 contribute to this binding. This is supported by the result using nuclear magnetic resonance (NMR) analysis, which showed that reactivity with fatty acids is greatly reduced by alanine substitution of Lys525. 41 Figure 2 shows the overlapping structure of Lys525 side chains in the presence and absence of fatty acids. It is evident from this result that the structure of Lys525 side chains is altered by the binding of fatty acids. This shows the possibility that under in vivo conditions in the presence of fatty acids, the structure surrounding the Lys525 side chains changes as a result of fatty acids binding to HSA, solvent accessibility increases, and Lys525 undergoes glycation more readily. By understanding how glucose reacts with HSA on this kind of underlying structure, it should be possible to improve the reliability of GA as a marker of glycemic control.
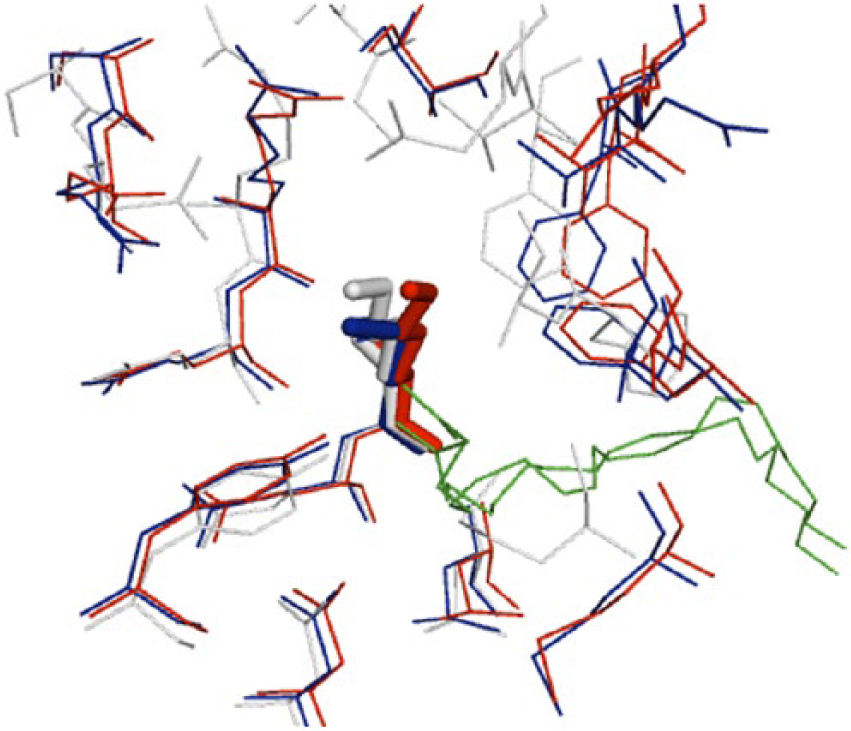
Overlapping structures around Lys525 in HSA. The X-ray crystal structure is shown in white for recombinant HSA (PDB ID: 1AO6), blue for HSA containing oleic acid (PDB ID: 1GNI), and red for HSA containing arachidonic acid (PDB ID: 1GNJ). The fatty acids are shown in green. This illustration was created using PyMOL (www.pymol.org).
Glycated Rates in Glycation of HSA
There were a few reports on nonenzymatic glycation rates of HSA.22,23 A recent study using matrix-assisted laser desorption/ionization-time of flight-mass spectrometry (MALDI-TOF-MS) analysis has shown that in vitro glycation rates differ for each amino group in HSA. Specifically, the glycation rates at Lys199, Lys439, Lys525, and the N-terminal amino acid are faster than at other glycation sites. 23 Glycation rates have also been reported for hemoglobin (Hb), from which HbA1c is the glycation product of the beta-chain N-terminal valine (Val). 42 However, there are few studies comparing the glycation rates of HSA and Hb. Studies using radiolabeled glucose found albumin glycation rates about 10 times faster rat albumin 43 and 5 times faster (HSA) 44 than Hb, but equal glycation rates have also been reported. 45 The reason for these variations could be that the GA assay methods used in these studies were not enzymatic: Day et al 43 and Baynes et al 44 used a radiolabeled glucose assay, and Cohen et al 45 used a GA antibody assay. In addition, the samples used were not standardized with rat blood, human pooled blood, or purified HSA, and comparison studies of HSA and Hb isolated from the same human blood were not performed.
Against this background, we investigated the glycation rates in healthy human HSA and Hb under identical glycation conditions (in vitro) using commercial enzymatic reagents (GA: Lucica® GA-L, Asahi Kasei Pharma, Tokyo, Japan; HbA1c: NORUDIA®N HbA1c, Sekisui Medical, Tokyo, Japan) (Figure 3; in-house data). Briefly, blood taken from 3 healthy volunteers was centrifugally separated into plasma and erythrocyte fractions. HSA samples were prepared by ultrafiltration to remove glucose from the plasma, and Hb samples were prepared by hemolysis of the erythrocyte fraction. The respective amount of GA in the resulting HSA samples was evaluated using commercial enzymatic reagents (Lucica®).
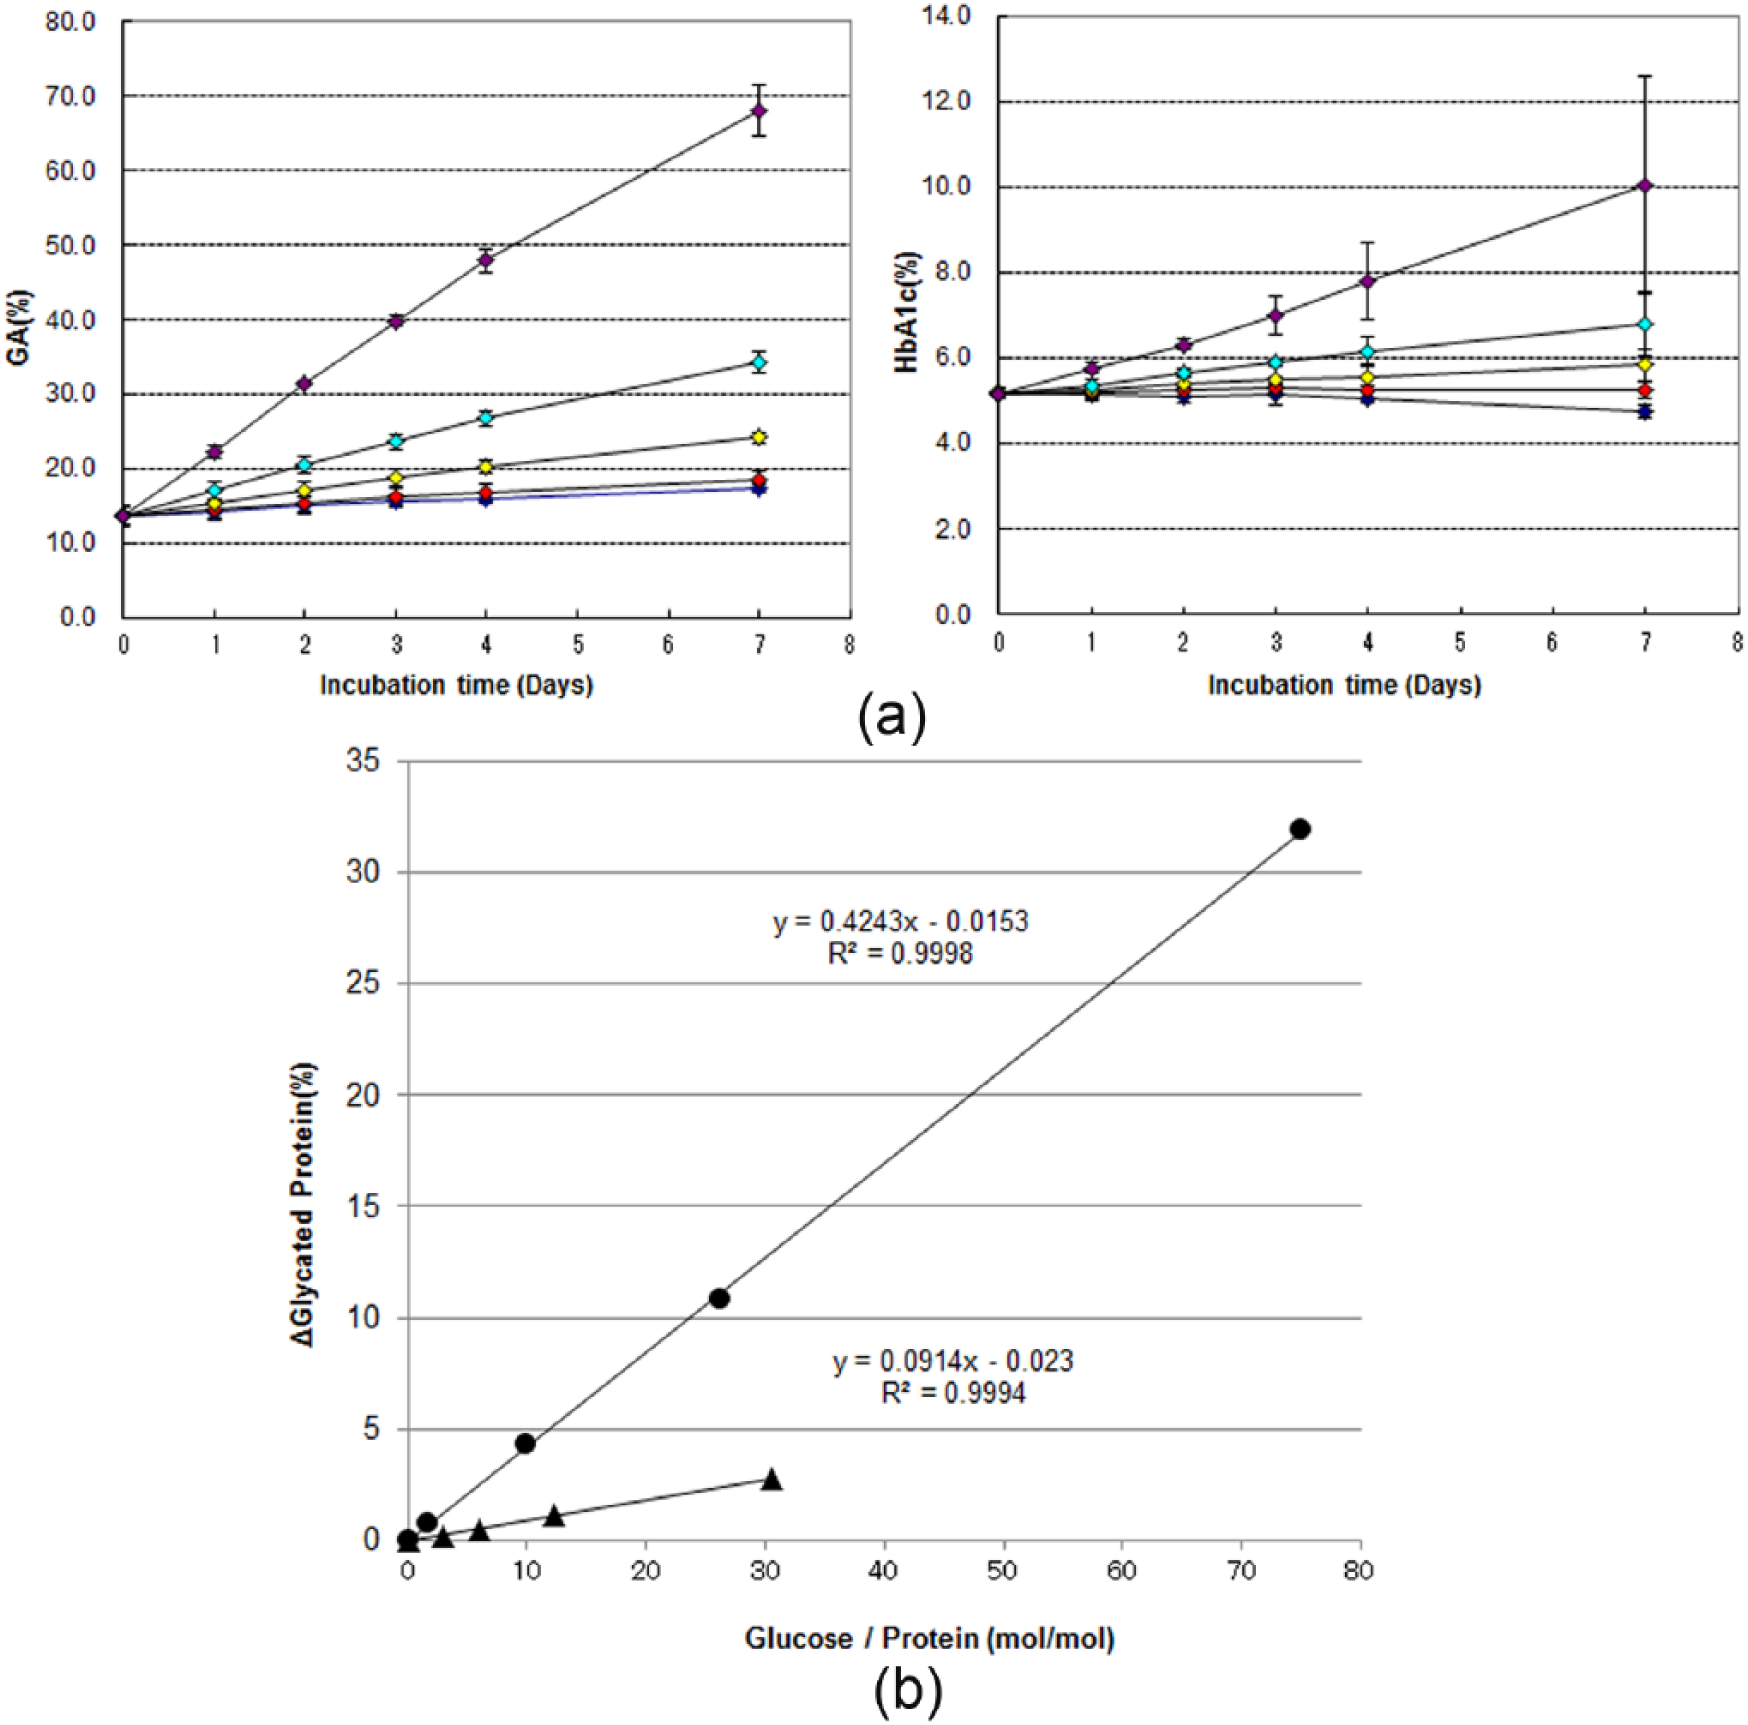
(a) Chronological changes in GA and HbA1c values by glucose concentration in the absence of glucose addition (diamonds in blue) or in the presence of 100 mg/dl (diamonds in red), 200 mg/dl (diamonds in yellow), 400 mg/dl (diamonds in cyan), and 1000 mg/dl (diamonds in purple). (b) Correlation between change in molar ratio of glucose and protein and changes in GA and HbA1c values analyzed using data from day 4. Closed circles (GA) and closed triangles (HbA1c) indicate the glycated protein percentages after subtracting the glycated protein percentage in the absence of glucose addition from that in the presence of respective concentrations of glucose on day 4 in (a). The cross axel is expressed as the ratio of molar concentration of glucose used in the experiment to that of each protein. Blood taken from 3 healthy volunteers was centrifugally separated into plasma and erythrocyte fractions. HSA samples were prepared by ultrafiltration to remove glucose from the plasma, and Hb samples were prepared by hemolysis of the erythrocyte fraction. The solutions for glycation (containing 1.3% NaN3) were prepared with phosphate buffered saline (pH7.4) so that the final concentrations were 4.5 g/dl for HSA and 11.7 g/dl for Hb. Glycation reaction solutions were prepared either without the addition of glucose or with a glucose solution being added to give final glucose concentrations of 100, 200, 400, and 1000 mg/dl. Glycation reaction solutions were incubated at 37ºC, and samples of fixed volume were collected for measurement on days 1, 2, 3, 4, and 7. Collected samples were stored at −80ºC until the final day of sampling. Lucica® GA-L was used for measuring GA and NORUDIA®N HbA1c was used for measuring HbA1c. The Hitachi 7180 automatic biochemical analyzer was used as the measuring device. All samples were measured twice in batches. Error bars indicate 1 standard deviation of the mean.
We found that there was greater glucose binding over time in GA than HbA1c for all glucose concentrations (Figure 3a). To compare fixed amounts of added glucose per protein, we calculated the mole ratios of the amount of added glucose and proteins and analyzed the correlation between GA and HbA1c values. Namely, when we plotted the difference in the amount of the glycated protein between in the absence and presence of glucose, in which the glycated protein were evaluated using Lucica® for GA or NORUDIA®N for HbA1c, against the mole ratios of the amount of added glucose and proteins during the present experiments. The gradient of the correlation equation for GA was found to be about 4.5 times that for HbA1c (Figure 3b). This shows that approximately 4.5 times more GA than HbA1c is produced when equal amounts of glucose are added. It is thus evident that HSA has a faster glycation rate than Hb in vitro when evaluated using an enzymatic reagent. It should be noted that Lucica® GA-L measured all glycated lysine residues in HSA, whereas NORUDIA®N HbA1c only measured glycated valine residue on the N-terminal of Hb in the present study. The results nevertheless indicate that as a marker of glycemic control, GA can capture increases in blood glucose concentrations more rapidly than HbA1c when using an enzymatic reagent.
Recent Clinical Research on Glycated Albumin
The last part describes the most recent clinical researches on GA to show that GA assay can be used in evaluating glycemic status similar to HbA1c assay, which is widely known in the world.
The analysis of stored GA from past large-scale cohort studies are also starting to be published, 24 after confirmation that GA can be measured in stored samples.25,26 An analysis of stored samples from the Diabetes Control and Complications Trial (DCCT) published in 2014 25 showed that GA was associated with diabetic retinopathy and nephropathy to the same extent as HbA1c. Analysis of samples from the Atherosclerosis Risk in Communities (ARIC) study also showed that GA had the predictive power for risk of the onset of diabetes and diabetic complications was the same as that of HbA1c. 26 With regard to macroangiopathy, studies have looked at the relationship between GA and intima media thickness 46 and coronary artery disease,47,48 but there is not yet sufficient evidence to draw any conclusions.
The current diagnostic criteria for diabetes in Japan define an HbA1c (NGSP) value of 6.5% or more as diabetic type at the screening stage. A study in Hisayama, Japan, reported that GA with a cutoff of 17% had a diagnostic sensitivity of 86.5% and specificity of 89.0% for predicting diabetic retinopathy. 27 This result was similar to the results for HbA1c (86.5% sensitivity and 88.8% specificity) when analyzed with a cutoff of 6.1%.
As well as the patients with diseases that influence the erythrocyte life span15,16 and with iron-deficiency in late pregnancy17,18 as shown in introduction, recent studies have reported cases of underestimation of HbA1c among type 2 diabetes patients using dapsone, 49 and cases in which HbA1c could not be accurately evaluated due to the effects of CD4 cell counts in human immunodeficiency virus (HIV) patients treated with antiretroviral agents. 50 On the other hand, GA is an inaccurate marker in diseases affecting albumin metabolism. GA values are low in patients with increased albumin metabolism from hyperthyroidism and nephrotic syndrome.51,52 Conversely, patients with decreased albumin metabolism from low thyroid function or liver cirrhosis have high GA values. GA should therefore be used cautiously in such patients. 51
Conclusions
As for GA assay, we discussed the reactivity of side chains of lysine residues with glucose in blood based on the tertiary structure of HSA. As a result, it was suggested that the accessibility of the lysine residues to the solvent was altered in the presence of fatty acids in blood. Moreover, it was found that GA assay was more sensitive than HbA1c assay. Together with the most recent clinical researches, it was shown that GA assay could be used in evaluating glycemic status similar to HbA1c, which has been already widely used in clinical chemistry.
Footnotes
Acknowledgements
The English usage in this article was improved by Forte corporation.
Abbreviations
GA, glycated albumin; Hb, hemoglobin; HbA1c, hemoglobin A1c; HPLC, high-performance liquid chromatography; HSA, human serum albumin; ID/MS, isotope dilution mass spectrometry; LC/MS, liquid chromatography mass spectrometry; MS, mass spectrometry; NMR, nuclear magnetic resonance.
Declaration of Conflicting Interests
The author(s) declared the following potential conflicts of interest with respect to the research, authorship, and/or publication of this article: Yuki Ueda, Hideyuki Matsumoto are employees of Asahi Kasei Pharma Corporation.
Funding
The author(s) disclosed receipt of the following financial support for the research, authorship, and/or publication of this article: This work is funded by Asahi Kasei Pharma Corporation.