
Abstract
Background:
Self-monitoring of glucose is important for managing diabetes. Noninvasive glucose monitors are not yet available, but patients would benefit highly from such a device.
Methods:
We present results that may lead to a novel, point-of-care noninvasive system to measure blood glucose based on Raman spectroscopy. A hospitalized cohort of 111 subjects was measured using a custom-made Raman spectrometer system. Blood glucose reference samples were used to correlate Raman data to glucose levels, using advanced preprocessing and analysis algorithms.
Results:
A correlation coefficient (R2) of .83 was found correlating independent Raman-based predictions on reference blood glucose for the full cohort. Stratification of the cohort in gender-specific groups raised correlation levels to .88 (females) and .94 (males). Glucose could be measured noninvasively with average errors as low as 0.9 mM.
Conclusion:
We conclude that this novel system shows promising results for the advance of noninvasive, point-of-care glucose monitoring.
Diabetes mellitus is an increasing health burden. In 2013, worldwide, approximately 382 million people suffered from diabetes, and that figure is estimated to increase to 592 million in 2035 (+55%). 1 It is estimated that approximately $548 billion is currently spent on managing diabetes, which is 11% of total health expense. 1 To be able to manage diabetes patients in the future, there is a need for cheaper diagnostics for managing glucose in patients. Diabetes, if left untreated, may lead to common pathologies like cardiovascular problems, blindness, and renal failure. Regular measurement of blood glucose levels is a necessary step in managing glucose levels in patients together with administering the right amount of insulin. Normally blood glucose levels are measured invasively by a finger prick; a droplet of blood is applied to a glucometer that uses a disposable test strip to measure the glucose concentration in the blood. Patients suffering from so-called brittle fingers may have serious problems measuring blood glucose as frequently as needed. Therefore, the development of a noninvasive system for blood glucose measurement has long since been the holy grail. Often, noninvasive technologies are based on optical principles.2-5 More recently, new developments have been developed that, in the future, may lead to interesting innovations, but are as of yet quite preliminary. 6 Raman spectroscopy is an optical technique to measure the (bio)chemical composition of a sample. This is done by irradiating the sample with a monochromatic light source (typically a laser). Inelastic scattering occurs in the sample, meaning that a small fraction of the irradiating light is scattered with a shifted frequency. The amount of shift in the frequencies is a result of the different vibrational levels of the molecules in the sample, and the resulting spectrum is therefore able to provide information regarding the composition of the sample. In Figure 1, a typical Raman spectrum is displayed; specific regions can be attributed to specific groups (see Table 1). Although some regions can be designated, hardly no signals in the combined Raman spectrum can be attributed to 1 single component, as a result of the high complexity of biological tissue.
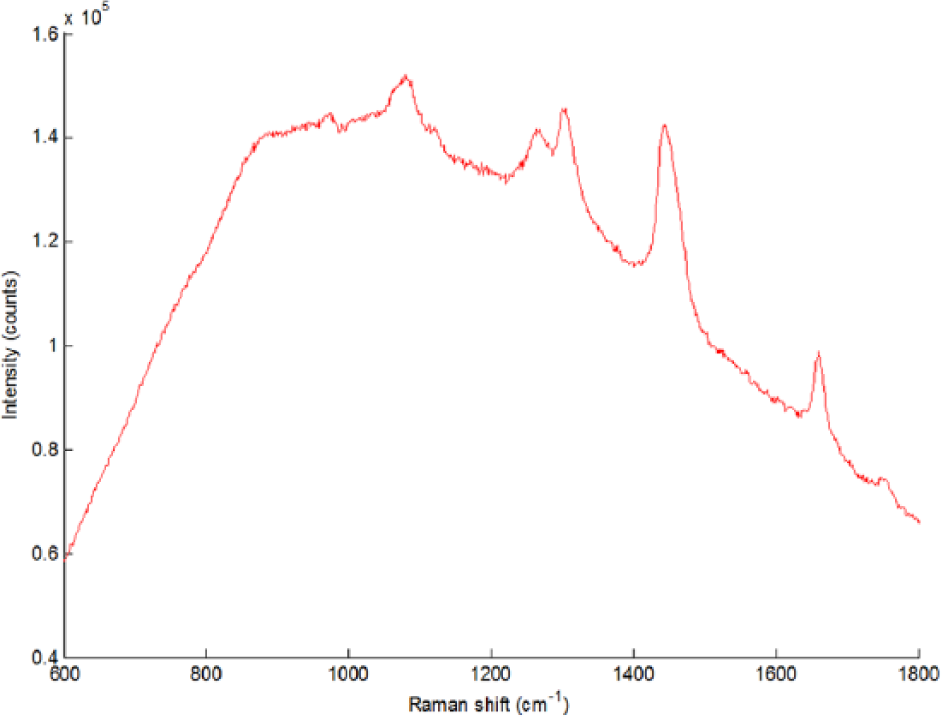
Typical Raman spectrum of human skin tissue.
Designation of Distinct Raman Signals.
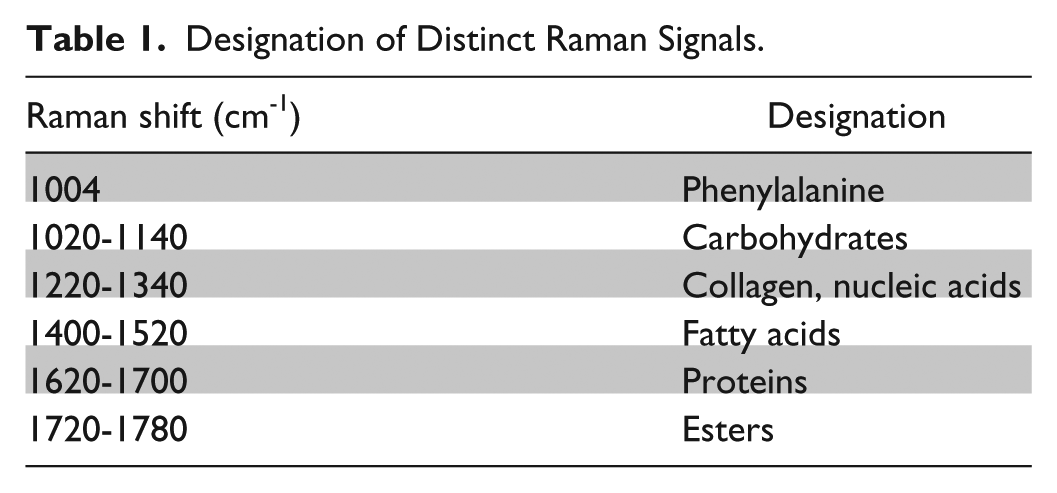
In the case of noninvasive glucose monitoring, the recorded Raman spectrum gives information on, for example, lipids, proteins, nucleic acids, salts, and carbohydrates (such as glucose). Although glucose itself is only a weak Raman scatterer (ie, the relative contribution to the total Raman spectrum is small with respect to its concentration in tissue), advanced data processing and analysis techniques mean that glucose can now be detected quantitatively in the combined Raman spectrum.
We propose a novel system, called noninvasive glucose assessment by Raman spectroscopic analysis (NiGARA), that employs a dedicated optical system to deliver Raman scattered light to a detector, as well as tailor-made computer algorithms to fully address the power that Raman spectroscopy offers. 7 We show in this article that especially a dedicated approach to data processing and analysis provides advantages for this method for measuring point-of-care noninvasive glucose.
Raman spectroscopy has been investigated previously for its applicability on noninvasive glucose measuring. 8 Our method differs in multiple ways from earlier work. First, our dedicated optical system is easier to work with, as it requires no focusing or location tracking. Second, improvements on instrumental issues (eg, detector sensitivity, laser availability, and power) as well as data processing issues (eg, background removal algorithms, variation filters, predictive modeling) raise the applicability of Raman spectroscopy.
Also, our technique does not need additional preparations/subcutaneous devices, as opposed to surface-enhanced Raman spectroscopy, 9 nor does it need complex laser systems as is the case with coherent anti-Stokes Raman spectroscopy. 10
Materials, Methods, and Experimental Setup
Raman Spectroscopy
Raman spectra were recorded using a TNO (Zeist, Netherlands) developed dedicated NiGARA measurement head optimized for measuring at a depth of 100-200 µm in the skin (see Figure 2), employing a measurement spot diameter of ~8 mm. This measurement head was coupled to a Shamrock SR-163 spectrograph (Andor Technology, Belfast, UK) equipped with 1200 lines/mm grating; detection was done using an iDus DU-401A BR-DD CCD detector cooled to −90°C (Andor). Excitation was done using a LASER-785-LAB-ADJ-S laser system (Ocean Optics, Duiven, Netherlands), capable of delivering up to 400 mW of continuous laser radiation at 785 nm. Calibration was done using the on-spectrograph micrometer, and was checked using a cuvette with cyclohexane (>99.5%, Biosolve, Valkenswaard, Netherlands) prior to each set of measurements. All spectra were recorded using SOLIS software, version 4.14 (Andor) at a range interval of 541 to 1818 cm-1. All experiments were performed using automatic background subtraction, and were recorded as 10 times accumulation of 10 seconds exposure each.
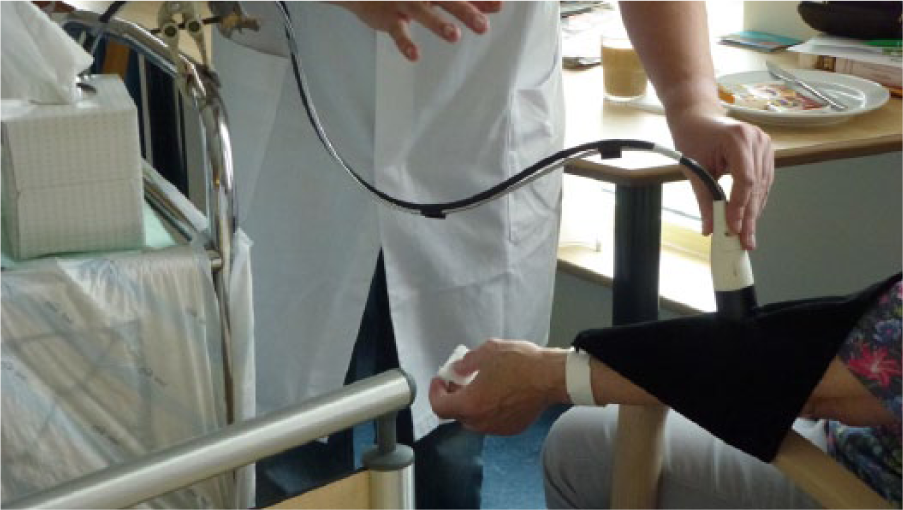
Measurement with the dedicated measurement head; the black cloth prevents stray light from entering the probe, and stray laser emission.
Clinical Measurements
Measurements were performed directly after the patient’s blood was drawn for glucose determination. Raman measurements were performed on the forearm, directly on the inside below the elbow joint, without any skin preconditioning. All measurements were performed on the same arm as capillary blood was drawn from. Care was taken to ensure no bruises or skin defects were at the measurement skin area, as it is expected that such abnormalities would influence the quality and information content of the Raman spectra.
During a 2-week measurement period, 186 spectra were measured on hospitalized patients. From this set, 20 poor-quality spectra, based on their aberrant signal-to-noise ratio, had to be omitted, leaving 166 spectra of sufficient quality.
All patients were asked for informed consent prior to this study in accordance to the rules of the local Medical Ethical Committee. The instrument was cleaned using 70% alcohol wipes in between patients to ensure no transfer of microbial species.
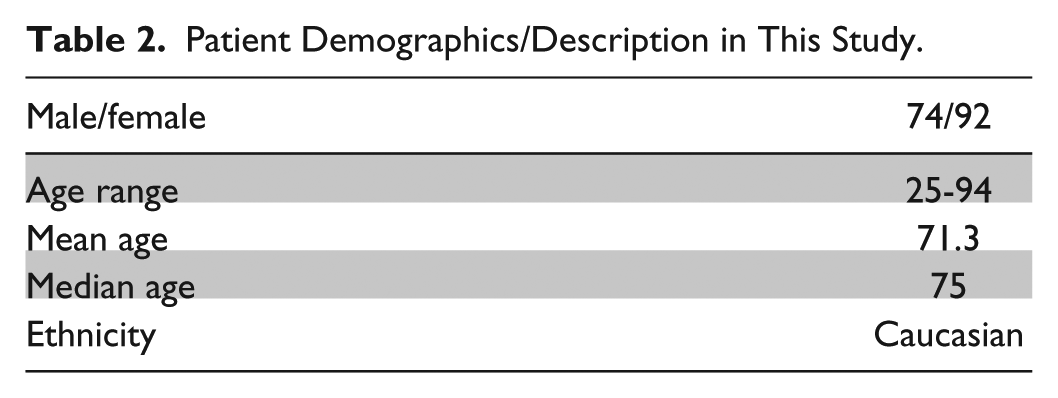
Only 1 accumulated spectrum per patient, defined as 1 measurement, was included in the final analysis. In those cases where multiple measurements were performed per unique patient, only the spectrum with the highest signal-to-noise ratio was included. This led to a final data set of 111 measurements, in which unique individual are included with only 1 measurement. Table 2 shows the cohort demographics of all subjects.
Patient Demographics/Description in This Study.
Glucose Levels
Plasma glucose concentrations in the patients/individuals were determined by measuring glucose in capillary whole blood samples. The samples were analyzed using the central laboratory glucose method, which is the isotope dilution gas chromatograph–mass spectrometer (ID-GCMS) traceable hexokinase method (GLUC2 reagent) with perchloric acid treatment performed on the Roche Cobas platform (Roche, Mannheim, Germany).
The whole blood values are calculated to equivalent plasma values with the Niels Fogh-Andersen equation, 11
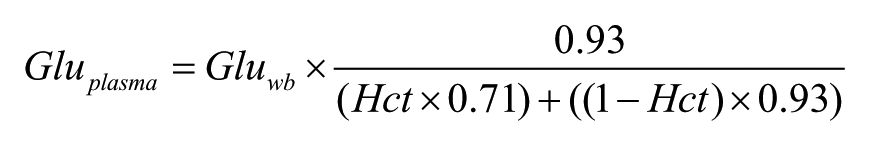
where Gluplasma and Gluwb are glucose levels in plasma and whole blood (as is measured above), respectively, and Hct is the hematocrit level, assuming water levels of 93 and 71% outside and inside cells, respectively. Plasma glucose levels varied in this study from 3.6 to 22.1 mM.
Spectral Data Preprocessing
After processing the spectra to equalized x-axes, spectra were corrected for non-glucose-specific spectral variations that were observed. These are variations in the spectra that are due to natural variability in the skin between subjects: as all biochemical compounds in the skin contribute to the Raman spectrum, spectra between different patients will show differences, although their respective glucose levels at set time points may be completely equal. Spectra are processed for varying intensities and backgrounds using extended multiplicative scatter correction (EMSC). 12 Glucose-induced changes are corrected for nonspecific spectral differences by EROS, an acronym for error removal by orthogonal subtraction. 13 An overview of the method is shown in the appendix.
Predictive Modeling
The Raman data were correlated to glucose values using the multivariate regression tool partial least squares (PLS) on mean-centered data. 14 By ordering the statistical importance of the weight factors of the Raman signals, signals that contribute most to glucose content could be identified. The validity of the PLS model was tested using a 10-fold double cross-validation (DCV) procedure, which makes it possible to estimate the model error independently of the model complexity. In cross-validation, measurements of a number of samples (here, 10%) are left out of the data set. Subsequently, the multivariate model is built using the remaining samples. Then, the model is used to predict the glucose values of the left-out samples. This is repeated until each of the samples have been predicted using the independently created models. Jackknifing was used for variable selection. 15 Using the aforementioned methodology, it was found that a total of 5 latent variables will give a stable PLS prediction model.
Results and Discussion
Because Raman spectroscopy, as opposed to conventional infrared spectroscopy, is amply limited by the presence of water, it is highly suitable to measure biological samples, and is very well suited for developing in vivo applications, as it does not require sample preparation. As all molecules in a sampling volume will, in some way, attribute to the total recorded Raman spectrum, multivariate statistics are needed to get the specifically requested information from the recorded signal.
An aspect of the experimental design that was not covered was the time lag between blood glucose levels and glucose levels in interstitial fluid, as has been described earlier in the literature. 16 The current design is not able to correct for such deviations, which is, however, the scope of future work.
Our approach led to a data set consisting of 111 Raman spectra of an equal number of patients. Subsequently, Clarke error grids were applied to compare the results of the traditional plasma glucose measurement with the NiGARA system (Figure 3).
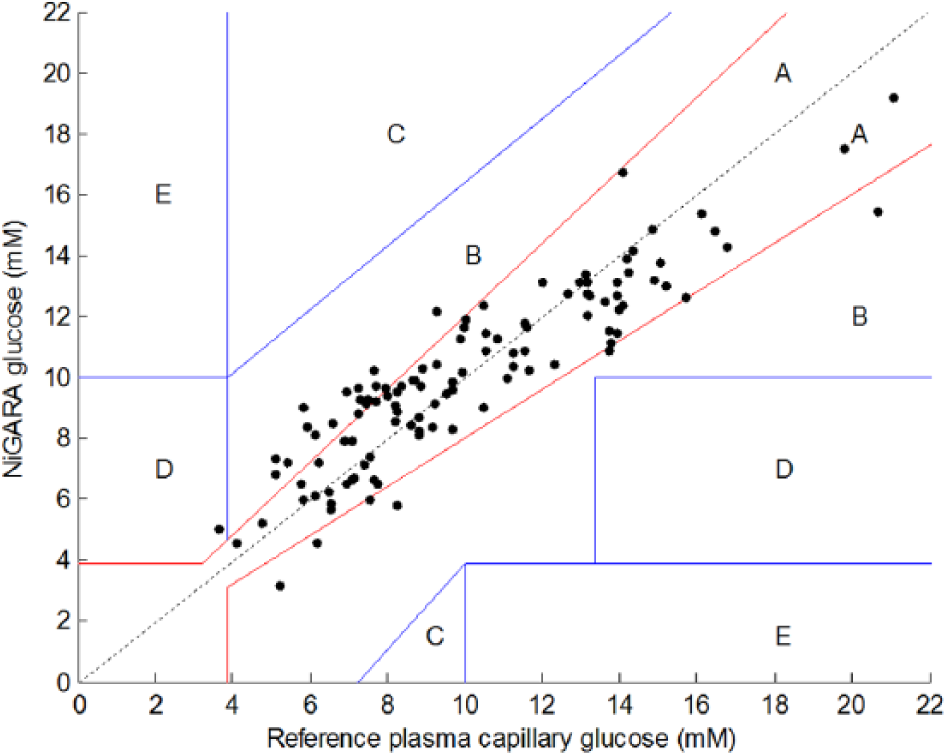
Results of glucose measurements using the noninvasive glucose assessment by Raman spectroscopic analysis (NiGARA) system, presented in a Clarke error grid versus the plasma capillary glucose values obtained with perchloric acid precipitation ID-GCMS traceable hexokinase method.
For the Clarke error grid in Figure 3, Table 3 shows the statistics.
Numerical Analysis.
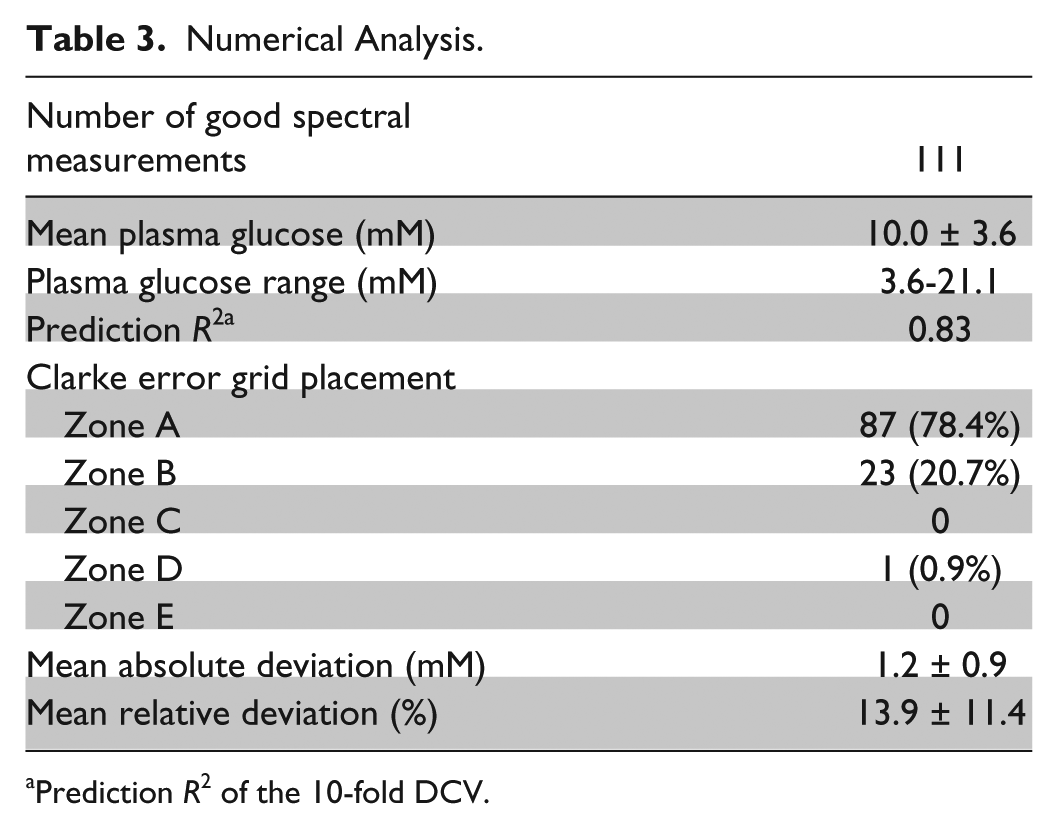
Prediction R2 of the 10-fold DCV.
In the above-described experiment with 111 individuals, 87 results are within the A zone and 23 are within the B zone. A 10-fold double cross-validated R2 of .83 is achieved, which is a good result. Nevertheless, the mean relative deviation of 13.9% ± 11.4% still leaves room for improvement.
As it was seen that the PLS model selected different spectral regions describing correlation with glucose concentrations for males and females, additional analysis was performed by stratification of the cohort by gender. The results of this stratification between males and females are shown in Clarke error grids for males and females, respectively, in Figures 4 and 5.
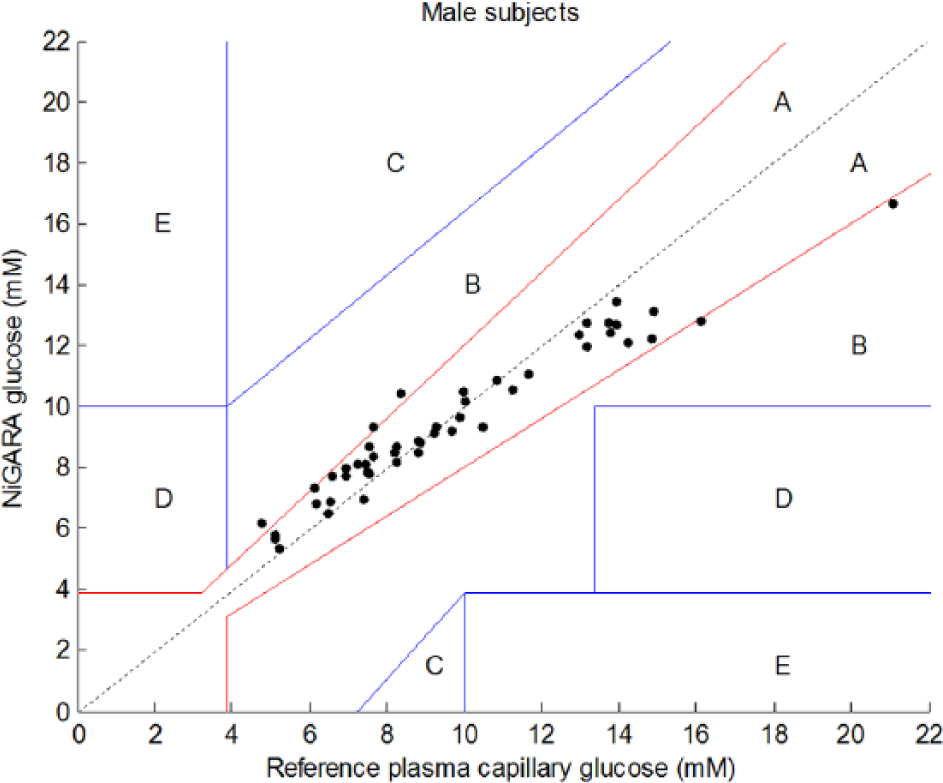
Results of glucose measurements using the NiGARA system versus the reference plasma capillary glucose values obtained with perchloric acid precipitation ID-GCMS traceable hexokinase method presented in a Clarke error grid for male subjects only.
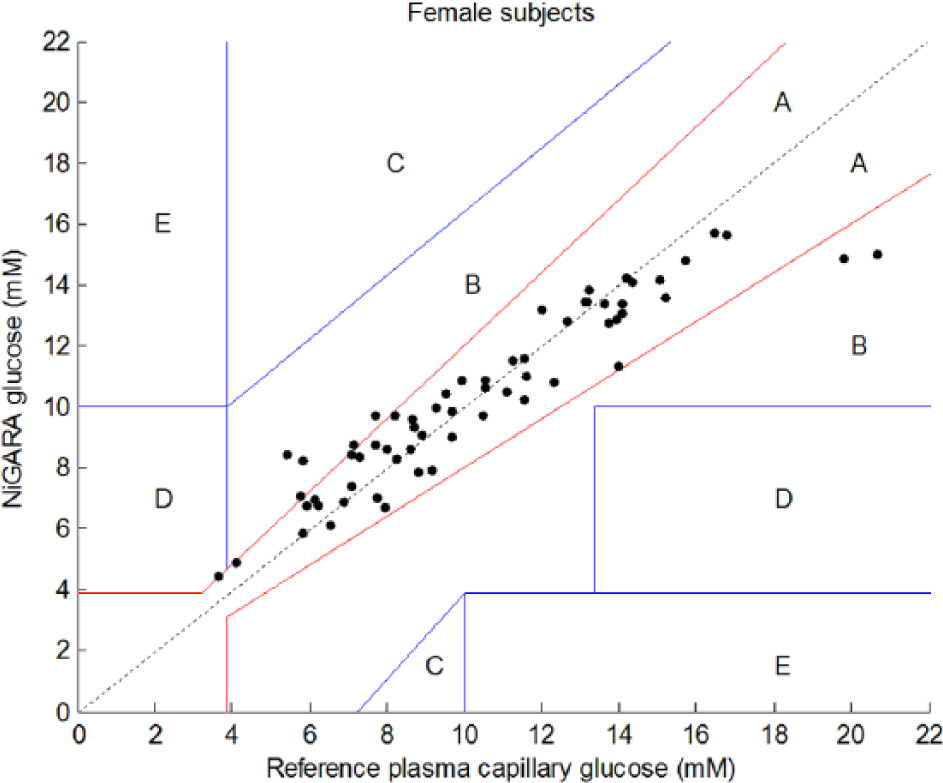
Results of glucose measurements using the NiGARA system versus the reference plasma capillary glucose values obtained with perchloric acid precipitation ID-GCMS traceable hexokinase method presented in a Clarke error grid for female subjects only.
The numerical analysis of the male/female subsets is provided in Table 4.
Numerical Analysis of the Cohort Stratified by Gender.
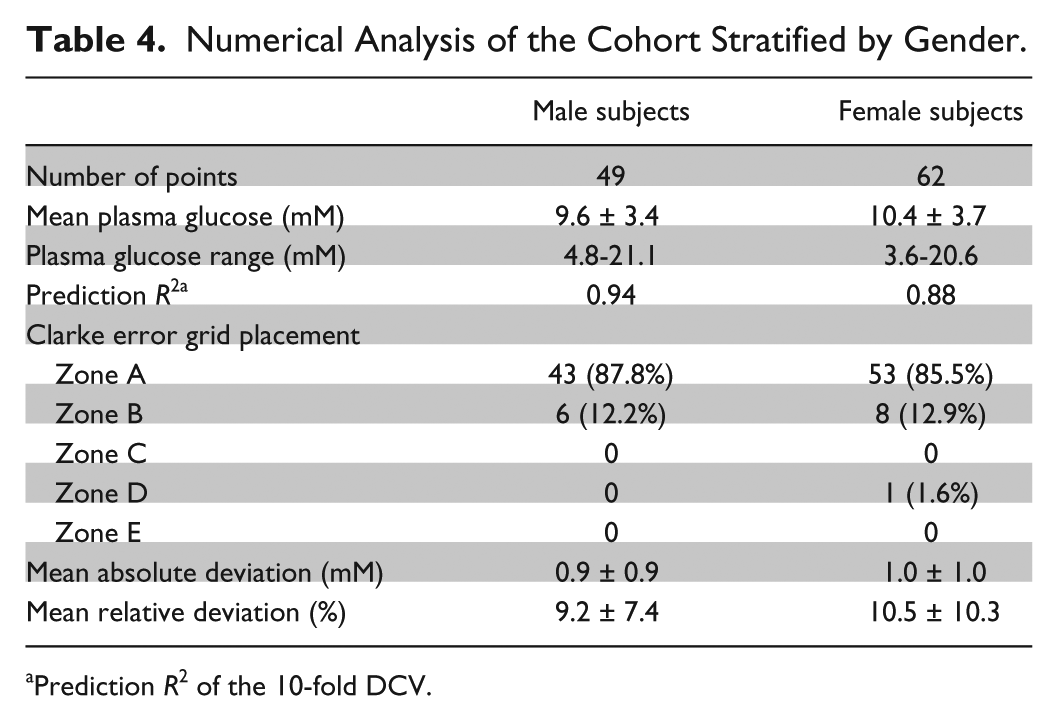
Prediction R2 of the 10-fold DCV.
Stratification of male and female patients revealed improved correlation coefficients (from .84 for the whole group to .94 for males and .88 for females), but also thoroughly improved the mean absolute and relative deviations. This indicates that, indeed, stratifying the cohort in separate gender-specific cohorts ameliorates the results obtained with this new glucose meter and creates a more robust method. Further stratification for skin type, skin color, age, body mass index, and so on of the patient cohort may improve NiGARA results in the future even further.
Conclusion
This study shows promising clinical results with the NiGARA system in combination with the PLS methodology of independent modeling, based on retrospective analysis. Future work will focus on extending the data set to perform prospective analysis and preparing the technique and method for future adaptation in a true point-of-care, disposable-free, easy-to-use, and cheap glucose monitor.
Footnotes
Appendix
Acknowledgements
The authors would like to thank Wim Muller, Rita Munnikhuis, and Rosie Dollahmoursid for their technical support in conducting the clinical study. Carina Rubingh is acknowledged for helpful statistical input.
Abbreviations
DCV, double cross-validation; EMSC, extended multiplicative scatter correction; EROS, error removal by orthogonal subtraction; ID-GCMS, isotope dilution gas chromatograph–mass spec-trometer; NiGARA, noninvasive glucose assessment by Raman spectroscopic analysis; PCA, principal component analysis; PLS, partial least squares.
Declaration of Conflicting Interests
The author(s) declared the following potential conflicts of interest with respect to the research, authorship, and/or publication of this article: Maarten Scholtes-Timmerman, Sabina Bijlsma, and Sjaak van Veen are employees of TNO. Marion Fokkert and Robbert Slingerland are employees of Isala Clinics.
Funding
The author(s) disclosed receipt of the following financial support for the research, authorship, and/or publication of this article: This research was funded by the Biomedical Innovation program of TNO.