
Abstract
Background:
In–intensive care unit (ICU) glucose variability (GV) is associated with increased mortality. However, the impact of GV on hospital survivors’ morbidity and associated changes in destination at time of hospital discharge are unknown.
Methods:
We studied a retrospective patient cohort in a medical/surgical ICU, requiring insulin infusion, using computer-guided insulin dosing software. Standard deviation (GluSD) and coefficient of variation (GluCV) were used as GV measures. We examined rates of home discharge (H) in the whole cohort and selected subgroups across GV quartiles, between patients with and without H, determinants of H, and determinants of GV and its association with patients’ ICU length of stay (LOS).
Results:
A total of 351 patients met study criteria. The association of GV and H varied among examined subgroups. H increased with GV quartile (GluSD; P = .004). GV was higher in patients with H than non-H (GluSD 36.1 vs 30.0 mg/dl, respectively; P = .002). Increased GV was not a predictor of reduced H on multivariate analysis. GV was inversely associated with patients’ ICU LOS in all examined subgroups. Increased number of hypoglycemic events and time to attain target glycemia were independent predictors of reduced H.
Conclusions:
GV was not associated with adverse impact on H in the present cohort, and its prognostic impact should be considered in the context of ICU LOS of examined patient populations. Further studies are needed to examine the morbidity effects of GV and other glycemia-related measures among hospital survivors of critical illness across varying ICU populations, glycemic control approaches, and glycemic targets.
Variability of blood glucose among critically ill patients has been associated with higher risk of death in most recent reports.1-3 It remains uncertain whether glucose variability (GV) in these patients is a cause of death or rather represents a marker of severity of illness. Only 1 study to date, with negative findings, has examined the association of GV and morbidity in adult critically ill patients. 4 However, GV was found to be a risk factor for nosocomial infections 5 and longer hospital length of stay5,6 in pediatric intensive care unit (ICU) patients. Thus, it is plausible to hypothesize that increased GV may be associated with increased morbidity and lingering adverse effects among adult critically ill patients. Such increased morbidity would be expected to adversely affect survivors of critical illness at the time of hospital discharge, leading to reduced rates of discharge home. The latter, as other hospital discharge destinations, is often used as a surrogate for patients’ residual morbidity.7,8 Because most adult critically ill patients survive hospitalization, lingering physical, cognitive, and mental health-related morbidity has been increasingly recognized following discharge, 9 while the underlying mechanisms remain elusive. Elucidating underlying reversible sources of residual morbidity among hospital survivors of critical illness may lead to preventive interventions. We examined whether increased GV is associated with reduced rates of home discharge among survivors of critical illness.
Methods
Setting and Study Population
We performed a retrospective cohort study of critically ill patients managed in the medical-surgical ICU at Medical Center Hospital, a 396-bed university-affiliated facility in Odessa, Texas. The study population included patients aged 18 years or older who received intravenous insulin infusions as part of their routine care between March 1, 2008, and June 30, 2009. We excluded patients with (1) a diagnosis of diabetic ketoacidosis or hyperosmolar hyperglycemic states or (2) less than 10 in-ICU glucose measurements. We chose this threshold to ensure (in combination with ICU LOS) more meaningful exposure to GV in the ICU, given prior reports either not specifying the minimal number of glucose measurements1,4,10,11 or using a minimal measurement threshold of at least 32,3,1-14 or 5 15 glucose values. We also excluded those with (3) ICU length of stay (ICU LOS) less than 1 day, (4) ICU and hospital readmissions, and (5) in-hospital mortality. The study was approved by the Texas Tech University Health Sciences Center Institutional Review Board.
Blood Glucose Management
Point-of-care glucometers and capillary blood were used for the majority of glucose assays guiding insulin dosing; reference laboratory glucose data were used infrequently for dosing decisions. Insulin dosing was targeted to achieve and maintain glucose range between 90 to 130 mg/dl, with insulin infusions initiated per individual physicians.
GlucoStabilizer™ (Alere, Orlando, FL) software was used for insulin dosing and has been described in detail elsewhere.16,17 Briefly, the dosing support tool is a menu-driven software system allowing clinicians to enter a glycemic target and measured glucose values and provides initial (and subsequent) patient data-driven changes in insulin dose and proposed time intervals for subsequent measurements of blood glucose.
Data Collection
The following data were collected from the medical records on patients meeting study criteria: age, gender, race/ethnicity, comorbid conditions, type of ICU admission, glucose at the time of hospital admission (Gluadm), in-ICU glucose values, time to achievement of blood glucose ≤ 130 mg/dl following initiation of insulin therapy, use of systemic steroids, ICU and hospital LOS, and patient’s destination at the time of hospital discharge. A diagnosis of diabetes was made based on medical record entries. The derived measures of glycemic control were: glucose at start of insulin infusion in the ICU (Glustrt), mean glucose (Gluave), development of hypoglycemia (defined as glucose values ≤ 70 mg/dl), number of hypoglycemic events, and GV. We chose the hypoglycemic threshold of ≤70 mg/dl in line with recent reports demonstrating that in addition to severe hypoglycemia (ie, ≤40 mg/dl), milder degrees of hypoglycemia (ie, 41-70 mg/dl) are also associated independently with adverse outcomes of critically ill patients,18-20 and as reflected in a recent guideline on management of hyperglycemia in the critically ill. 21 Because it is uncertain whether the adverse impact of GV is related to the absolute value of glucose fluctuations or their relative value in proportion to the mean, we used both standard deviation (GluSD) and coefficient of variation (GluCV; the ratio of standard deviation and the mean) of individual patients’ glucose values.
Outcomes
The primary outcome was home discharge of survivors of critical illness at the end of hospitalization.
Data Analysis
We examined the association between GV and rates of home discharge (including routine home discharge, home health service, or with a home provider of intravenous therapy) using 3 methods: (1) comparisons of rates of home discharge across quartiles of GV. The ranges of GV quartiles were based on findings of our local glycemic data (2) comparisons of GV between patients with and without home discharge and (3) using multivariate modeling. These associations were examined in the whole cohort, with further exploratory analyses in the following predetermined subgroups: diabetes status, gender, ethnicity, and type of ICU admission.
Because GV may vary with duration of exposure and was noted to have unexpectedly positive association with rates of home discharge on preliminary analyses, we examined the association between measures of GV and ICU length of stay in 3 ways: (1) across quartiles of GV, (2) between patients with and without home discharge, and (3) across ICU length of stay strata. In addition, we examined predictors of GV.
Group data are reported as numbers (percentages) for categorical variables and mean (standard deviation [SD]) or median (interquartile range [IQR]) for continuous variables, as appropriate. Distribution of normality was examined by Kolmogorov–Smirnov test. Categorical data were compared by 2-sided χ2. Mann-Whitney U tests, t tests, and Kruskal–Wallis tests were used to compare continuous data, as appropriate. Trends of categorical data were examined using the Cochran–Armitage test for trend. Also calculated were 95% confidence intervals (CIs).
We constructed multivariate logistic regression models to explore the association between GV and home discharge among survivors of critical illness as dependent variable. A backward data entry method was used, with insignificant variables removed when P > .1. We adjusted the analyses for the following confounders: age, gender, ethnicity, comorbid conditions, type of ICU admission, Gluadm, Glustrt, Gluave, time to achievement of blood glucose ≤ 130 mg/dl, presence of hypoglycemia, number of hypoglycemic events, use of systemic steroids, and ICU and hospital lengths of stay.
Explanatory variables for GV were examined using separate multivariate regression models for GluSD and GluCV using similar covariates as above, except the number of hypoglycemic events and hospital LOS.
All statistical analyses were performed using MedCalc version 12.7.0 (MedCalc Software, Ostend, Belgium). A 2-sided P value < .05 was considered significant.
Results
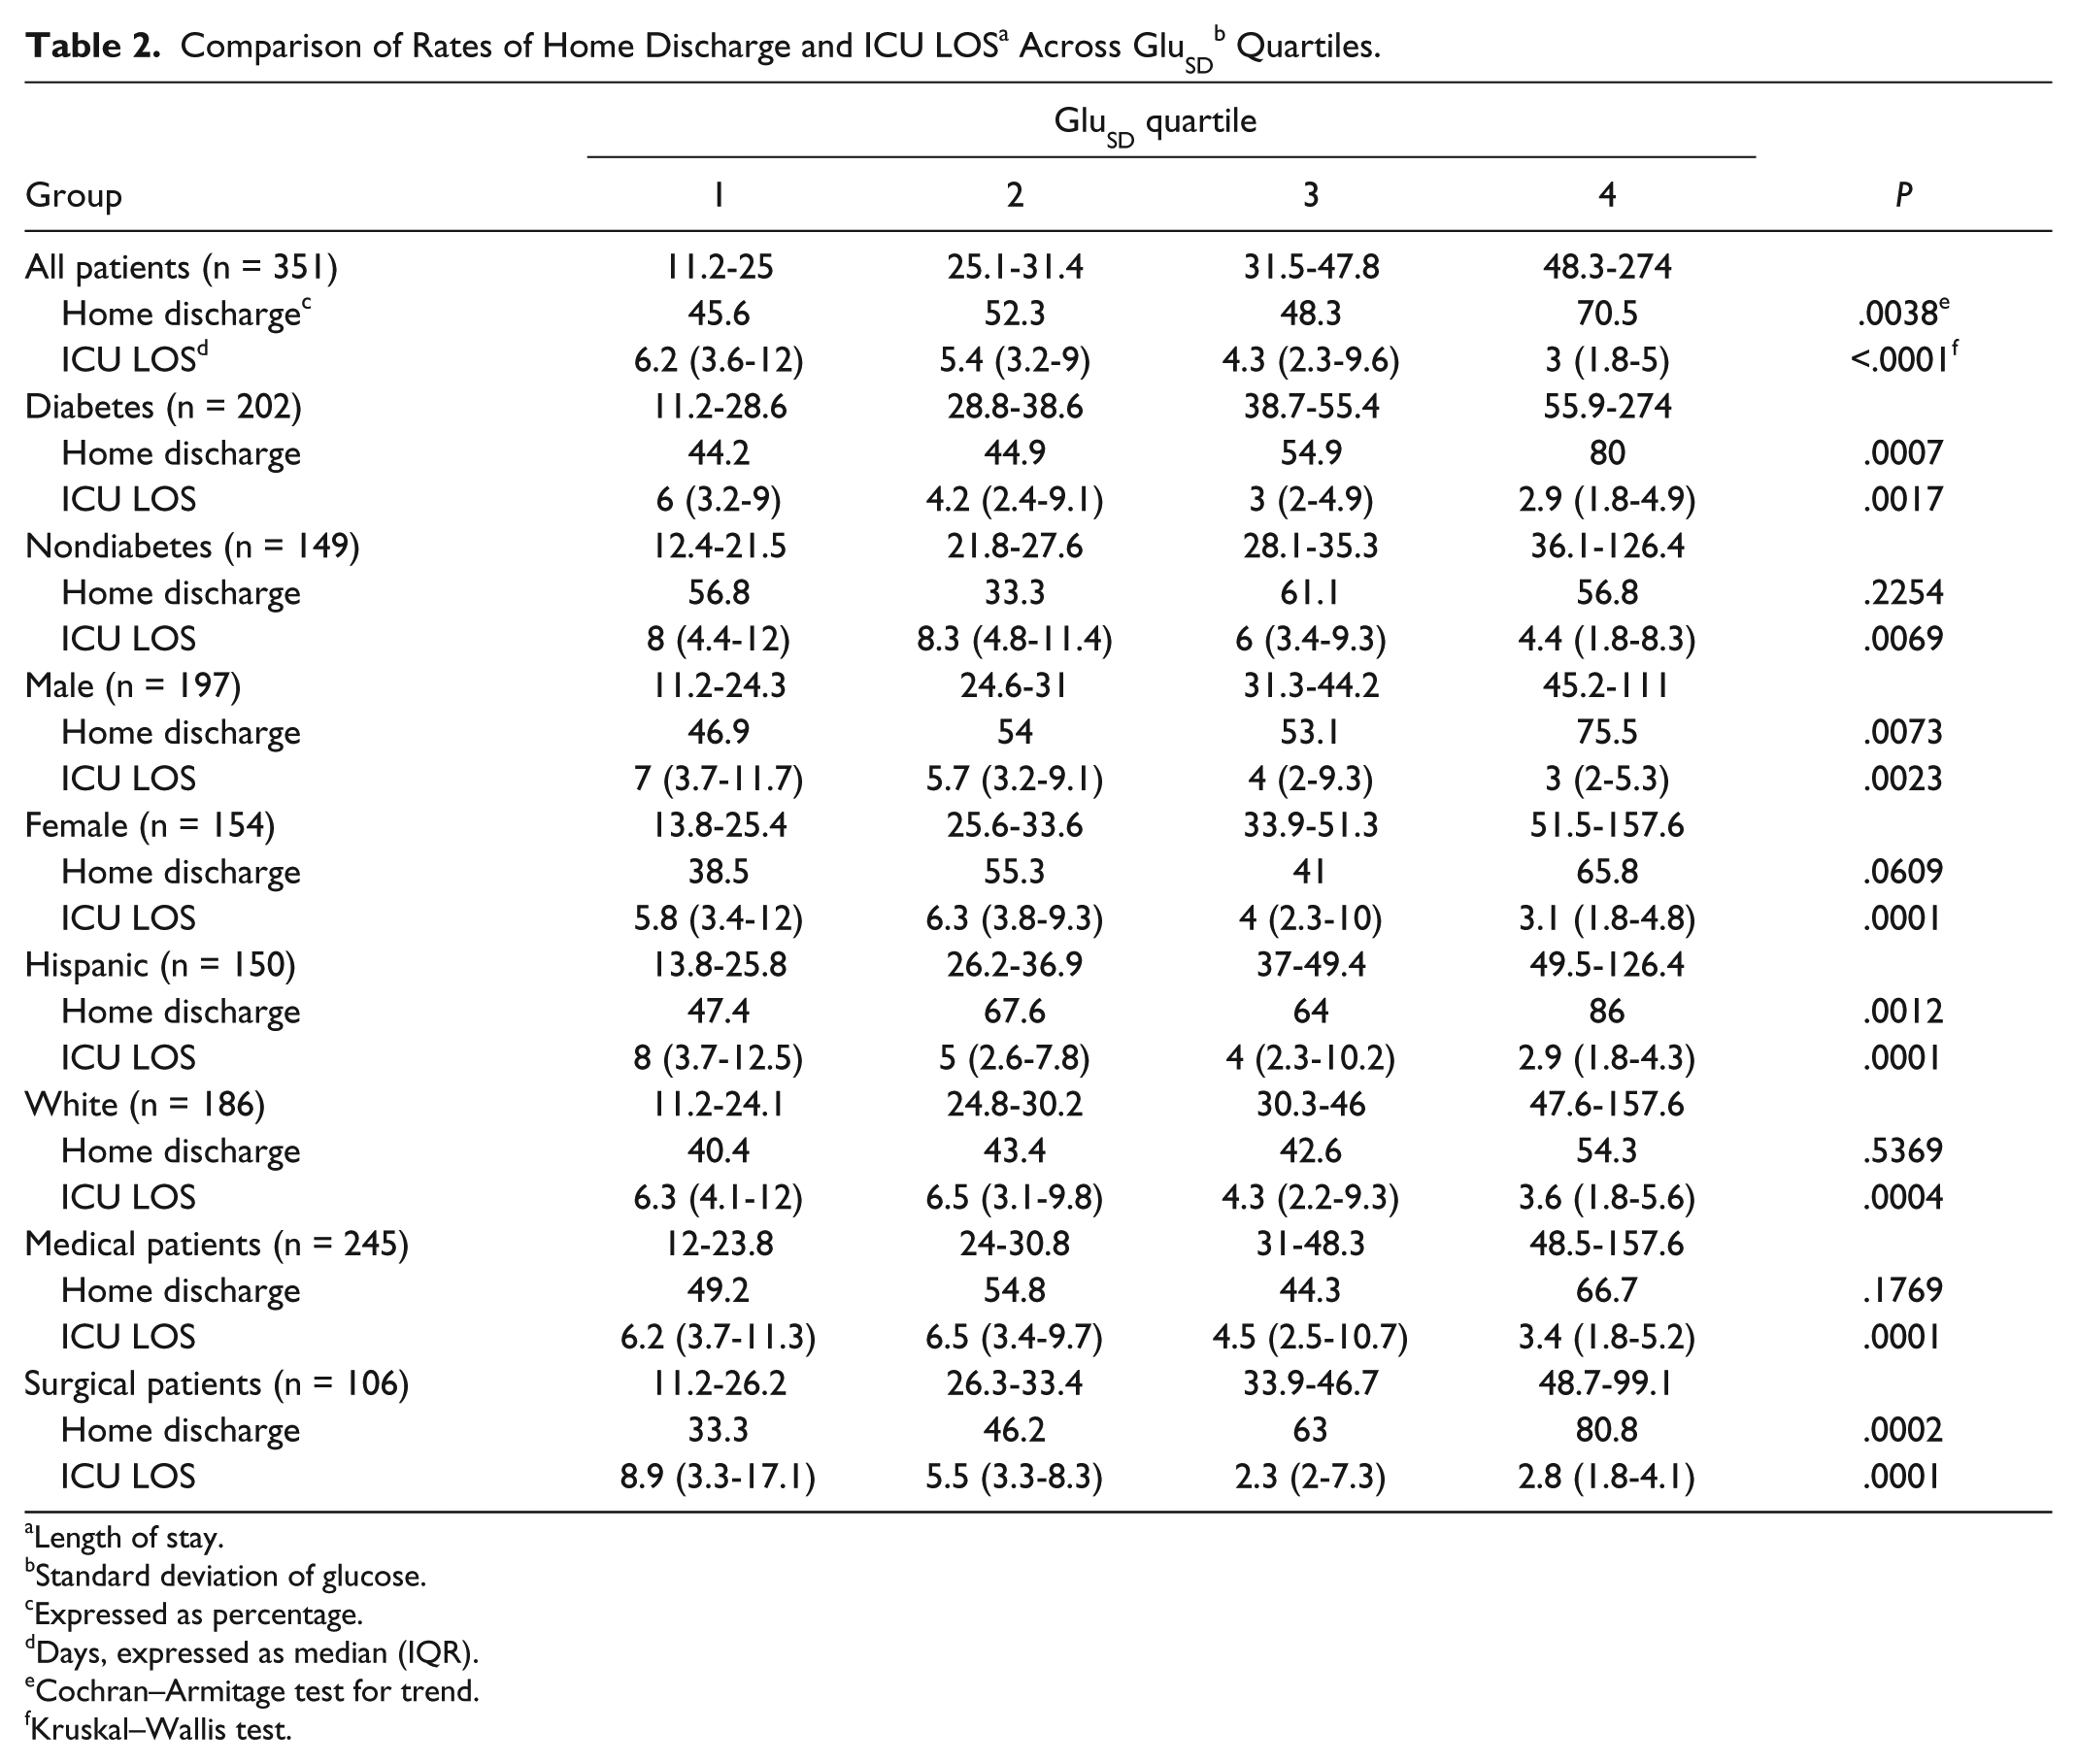
There were 683 patients receiving intravenous insulin infusion during study period. Among the otherwise eligible patients, hospital mortality was 19.9%, leaving 351 patients for analysis. Patients’ demographics and key clinical, glycemia-related, and outcome measures are described in Table 1. A total of 190 (54%) patients were discharged home.
Baseline Patient Characteristics, Measures of Glycemic Management, and Selected Outcomes.
Percentages are rounded.
Glucose at the time of hospital admission.
Glucose at start of insulin infusion in the ICU.
Time since starting insulin infusion in the ICU.
Mean glucose.
Number of patients.
Length of stay.
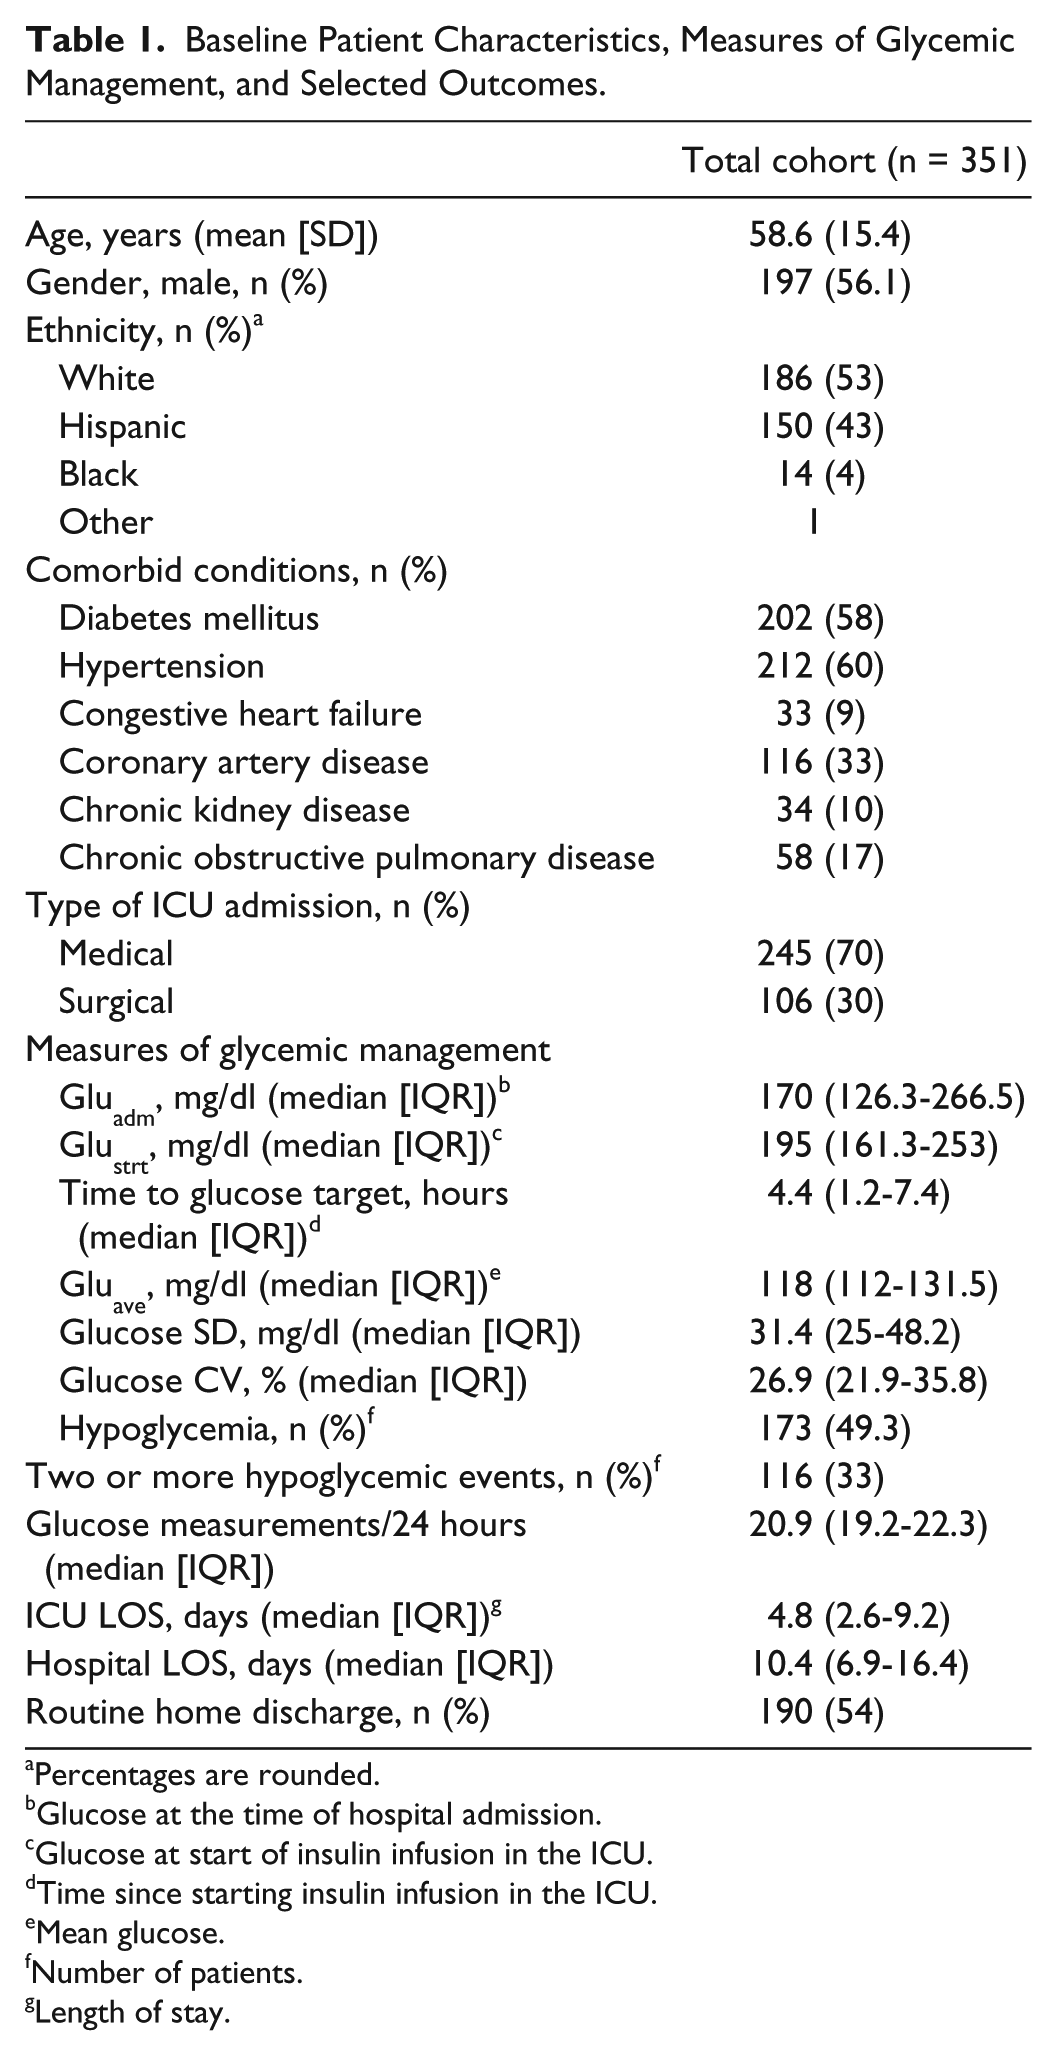
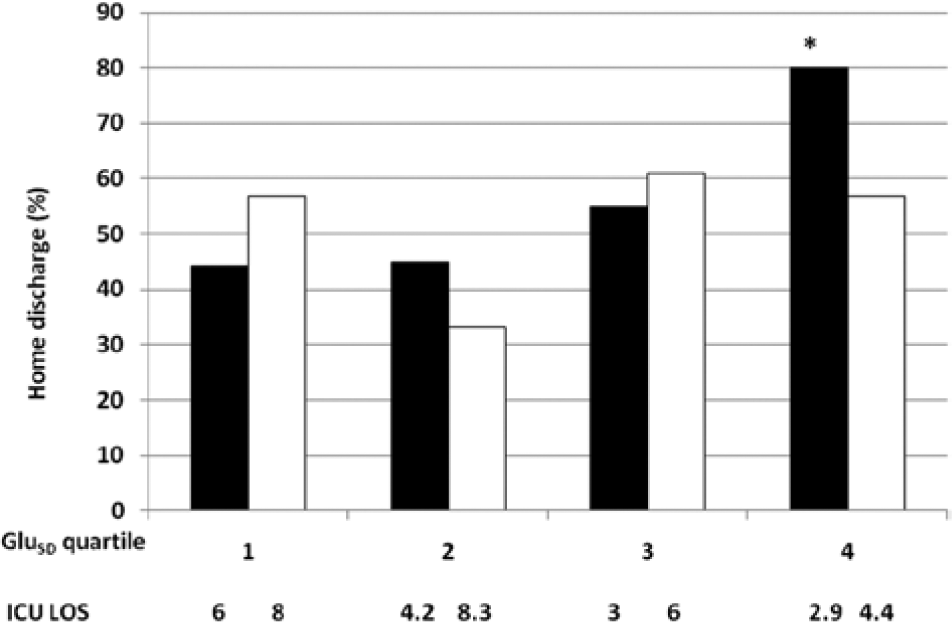
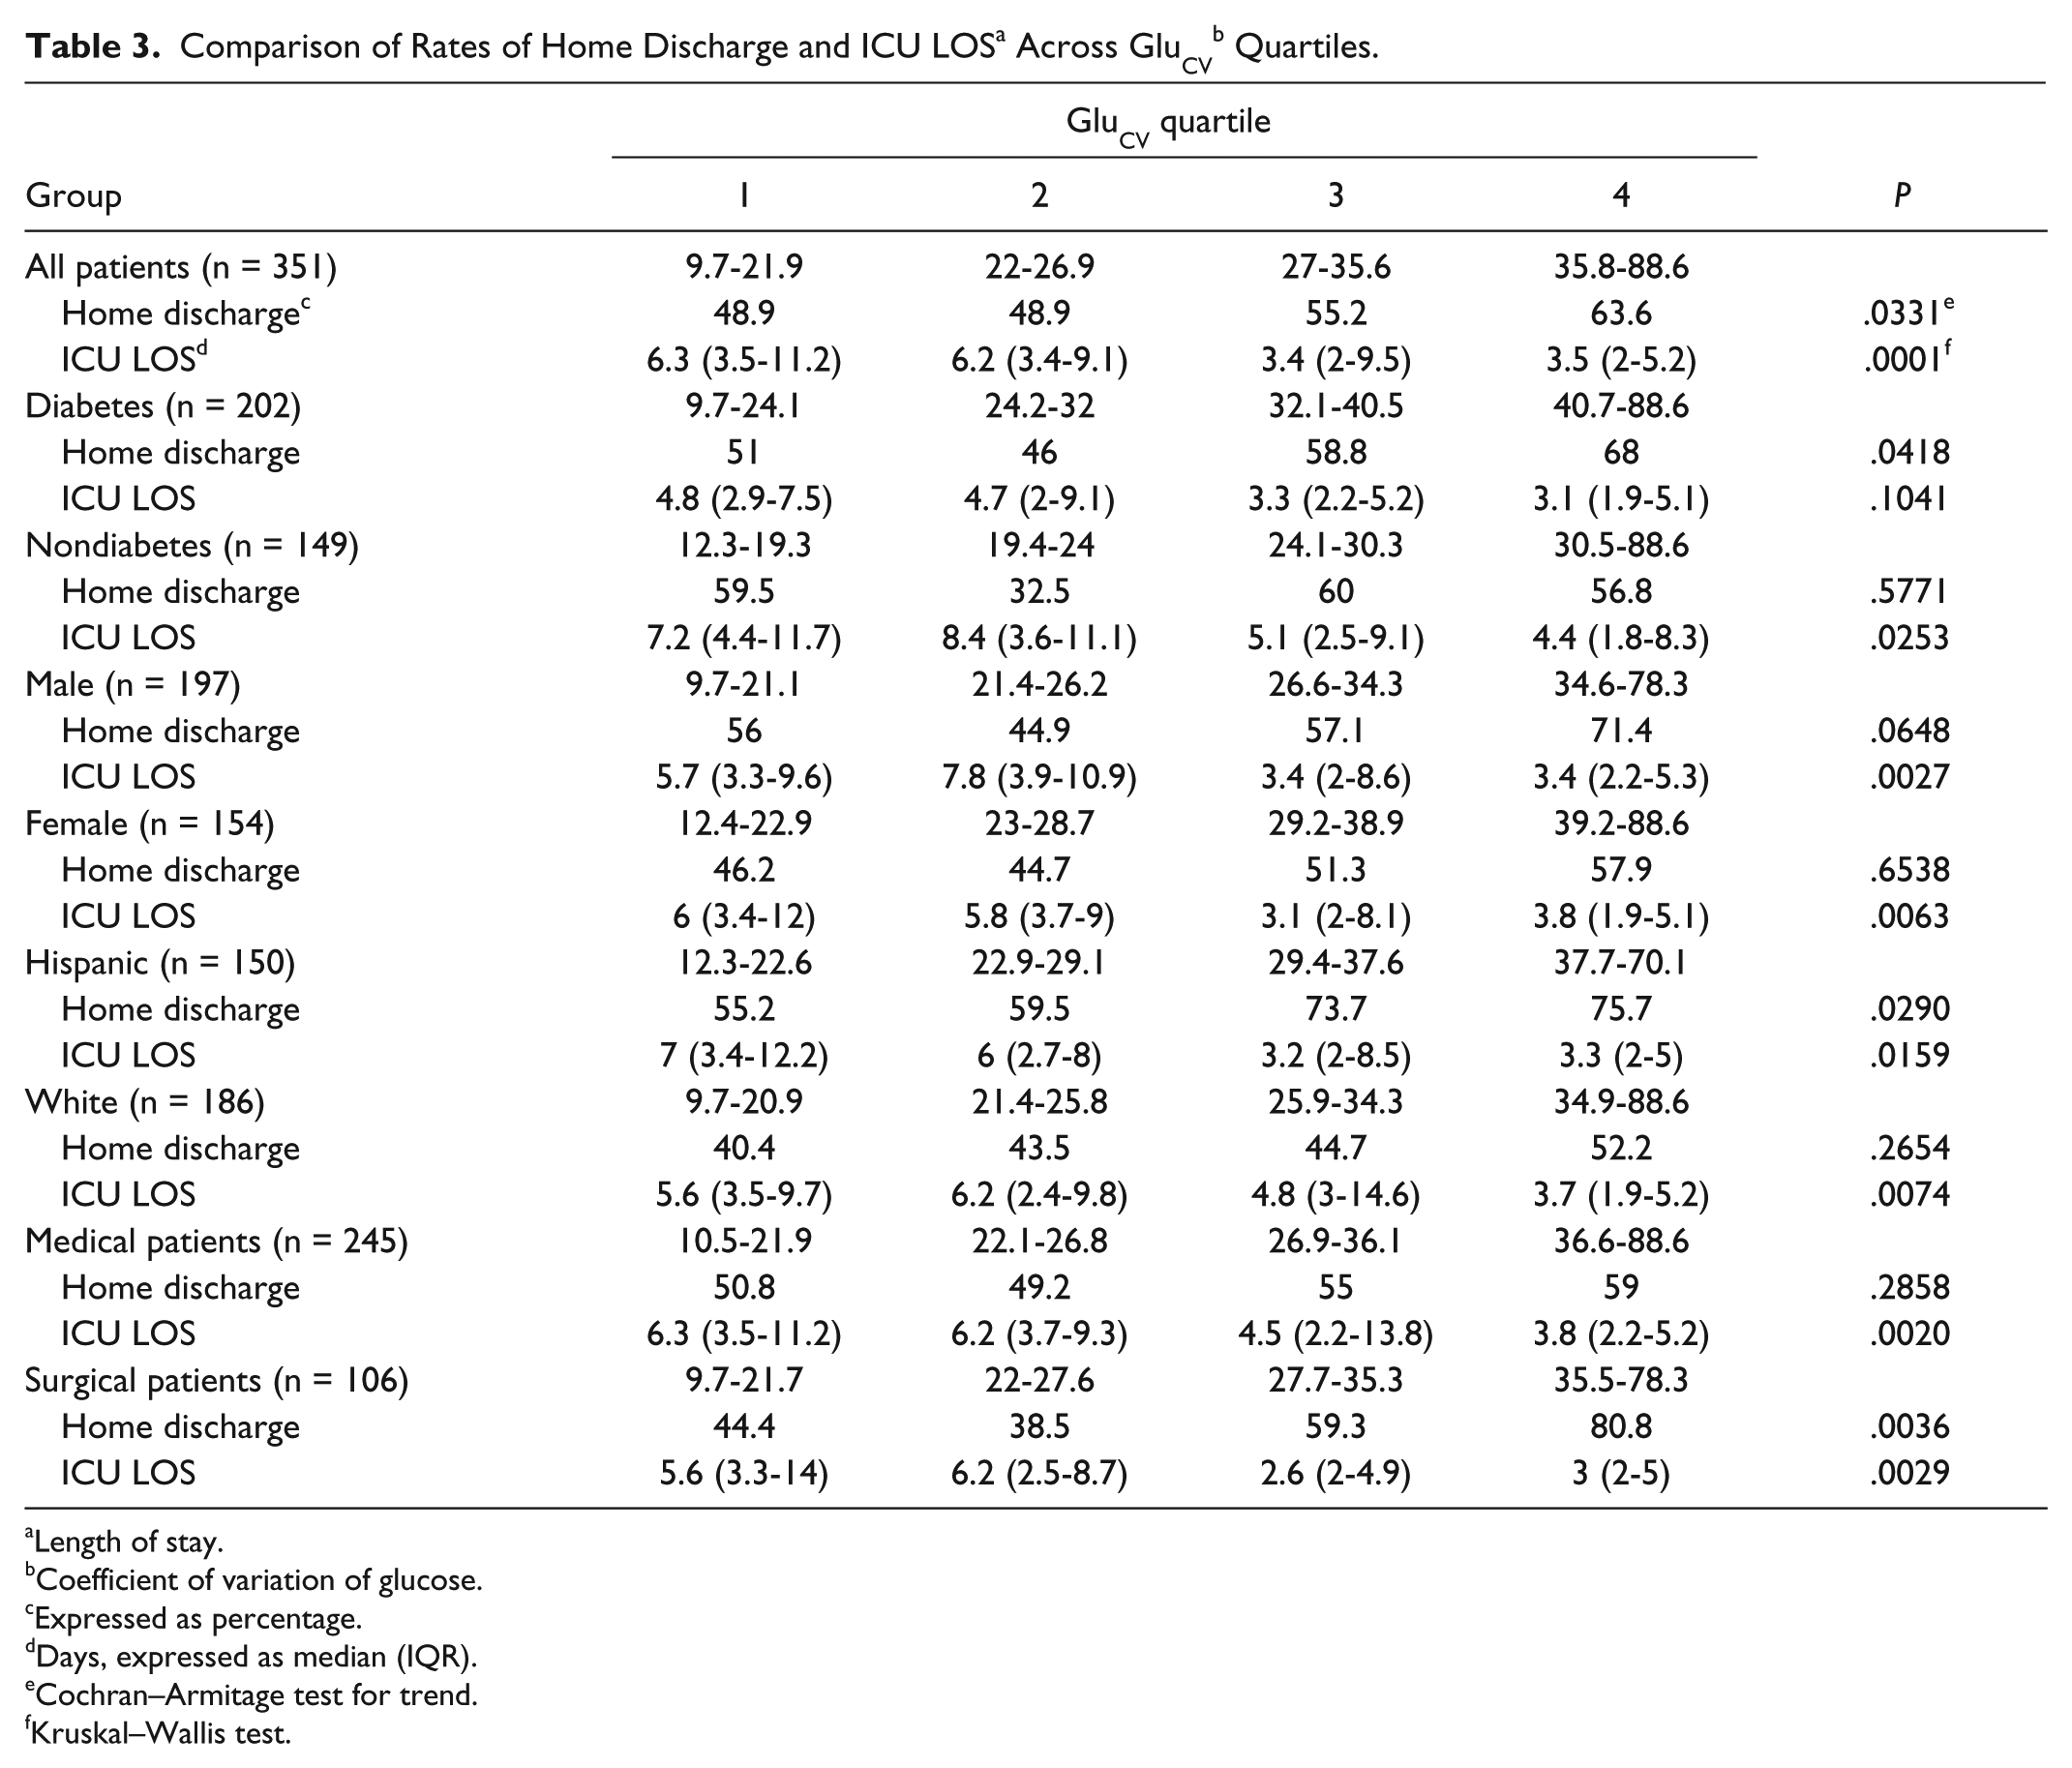
Increased GV across GluSD quartiles was associated with significantly higher rates of home discharge for the whole cohort, and among patients with a diagnosis of diabetes, and male, Hispanic, and surgical patients (Figures 1 and 2, Table 2). Similar findings were noted comparing rates of home discharge across GluCV quartiles, with the exception of a trend toward increased rates of home discharge among males with higher GluCV (Table 3).
Rates of home discharge among survivors of critical illness with (black) and without (white) diagnosis of diabetes mellitus, stratified by quartiles of GluSD and corresponding median ICU length of stay. *P = .0007 for trend.
Rates of home discharge among medical (black) and surgical (white) survivors of critical illness, stratified by quartiles of GluSD and corresponding median ICU length of stay. *P = .0002 for trend.
Length of stay.
Standard deviation of glucose.
Expressed as percentage.
Days, expressed as median (IQR).
Cochran–Armitage test for trend.
Kruskal–Wallis test.
Length of stay.
Coefficient of variation of glucose.
Expressed as percentage.
Days, expressed as median (IQR).
Cochran–Armitage test for trend.
Kruskal–Wallis test.
GluSD was significantly higher among patients discharged home as compared to those who were not, following a similar pattern noted with GV quartiles (Table 4). Mostly similar findings were noted for GluCV (Table 4).
Comparison of Glucose Variability and ICU LOS Between Patients With and Without Home Discharge.
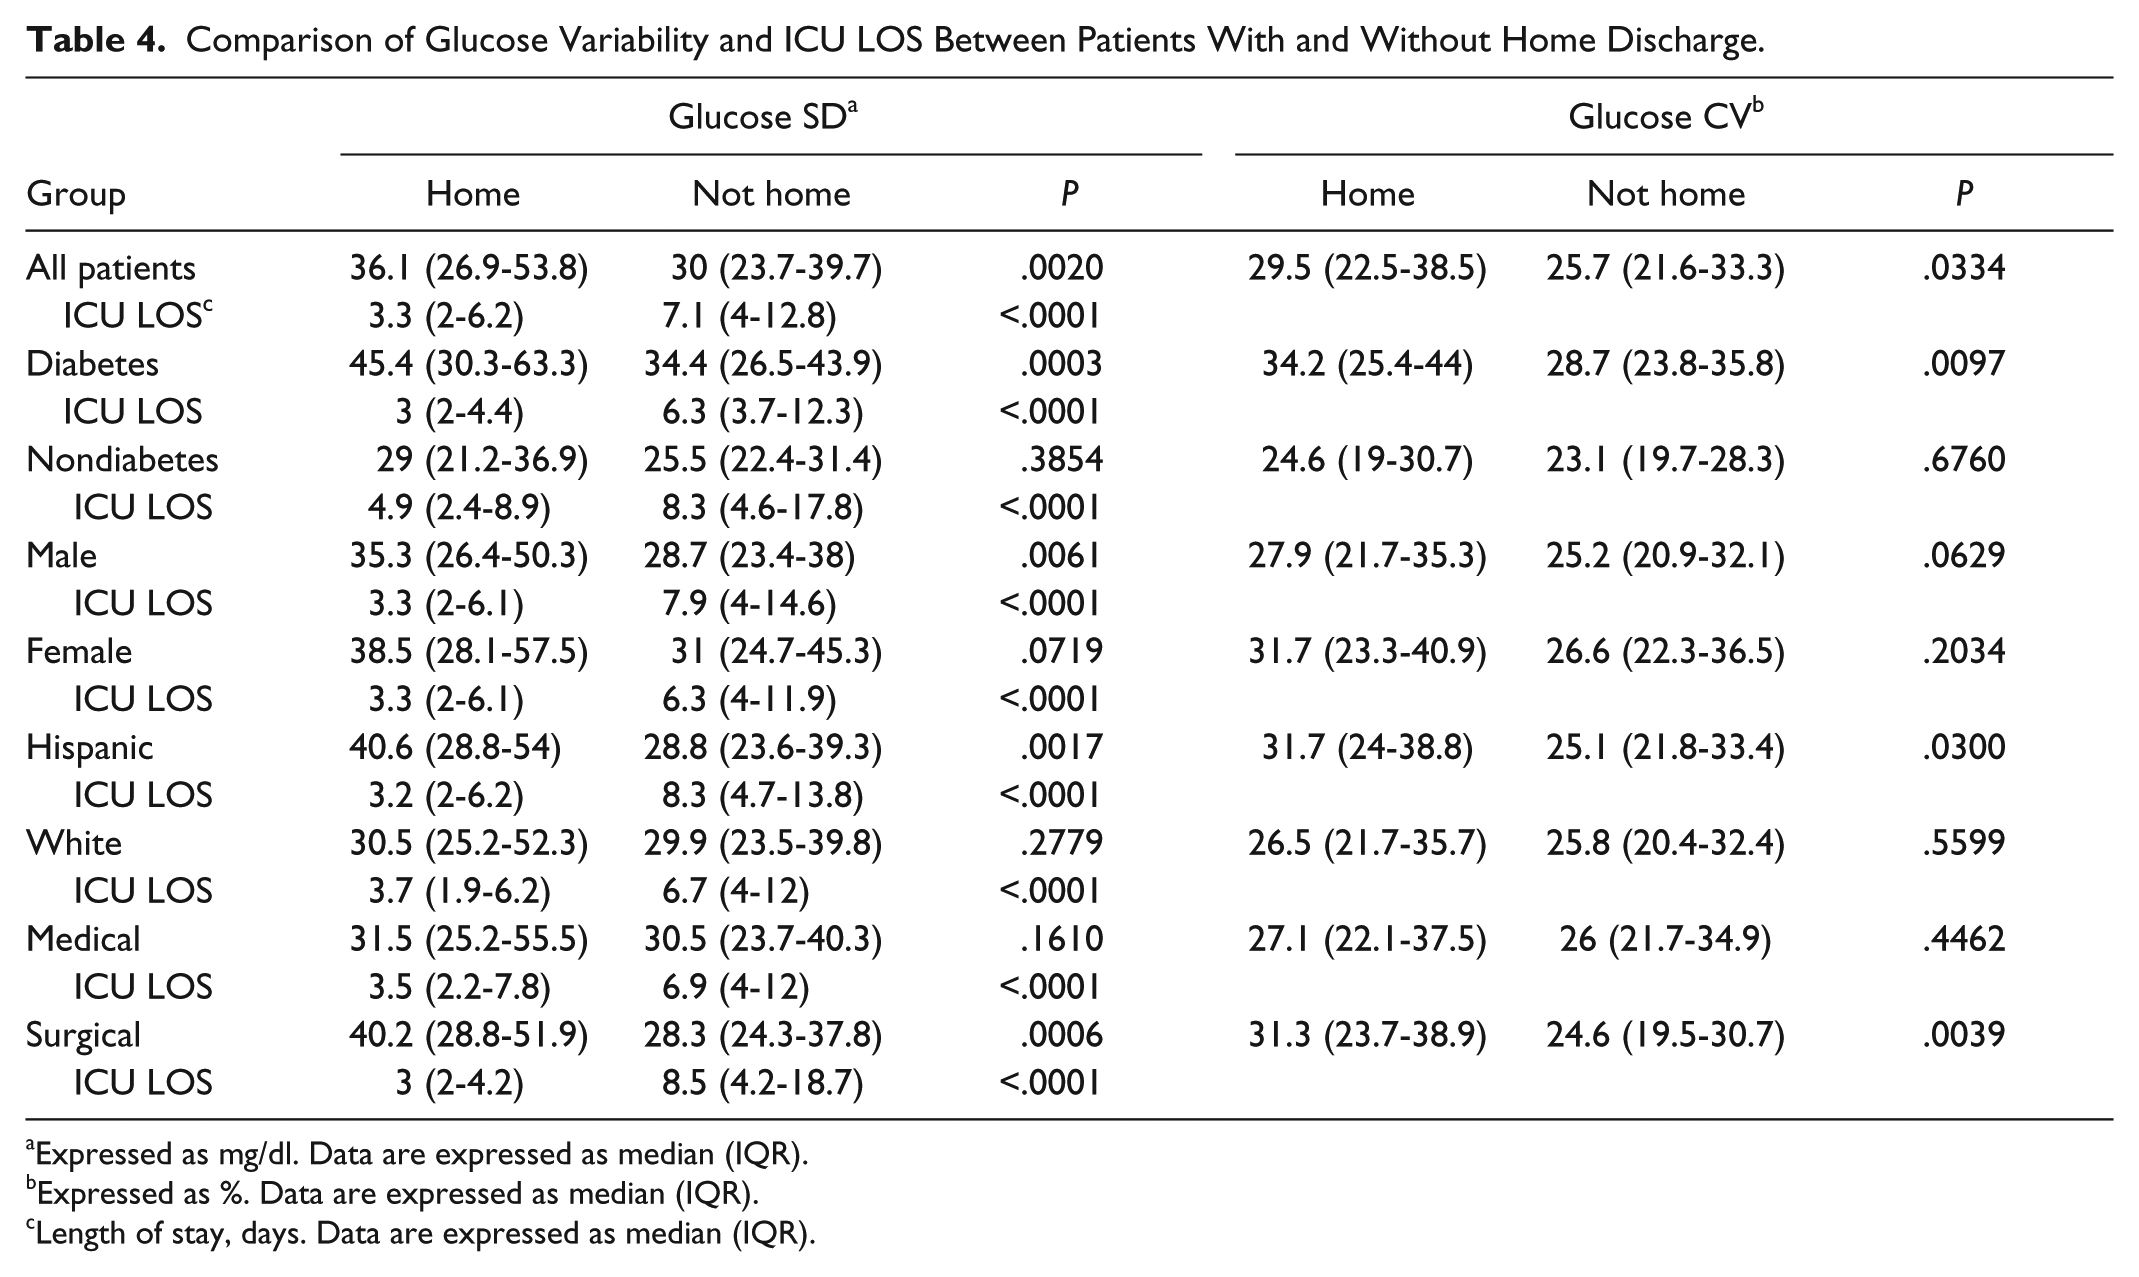
Expressed as mg/dl. Data are expressed as median (IQR).
Expressed as %. Data are expressed as median (IQR).
Length of stay, days. Data are expressed as median (IQR).
On multivariate logistic regression analysis GluSD was an independent predictor of a higher rate of home discharge (Table 5) among patients with diabetes, males, and surgical patients. GluCV was an independent predictor of home discharge only among diabetics and surgical patients (Table 5). Increased GV was not associated with an adverse impact on rates of home discharge in any of the examined subgroups or the whole cohort.
Multivariate Analysis of Glucose Variability as Predictor of Home Discharge Among Survivors of Critical Illness.
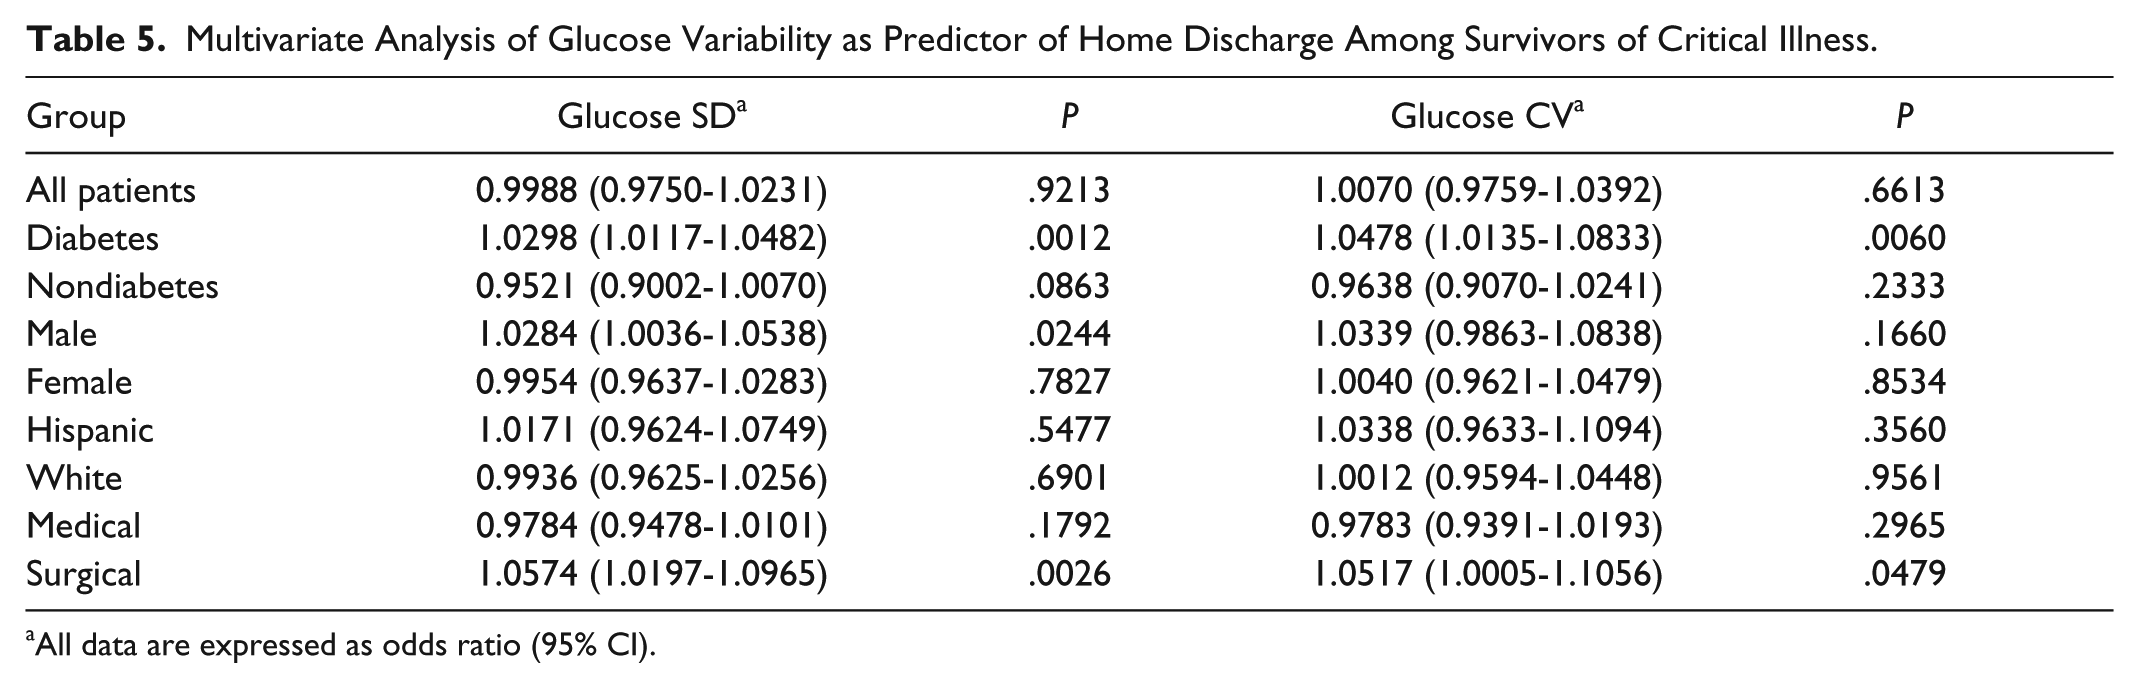
All data are expressed as odds ratio (95% CI).
Among other glycemia-related covariates, only Gluave, the number of hypoglycemic events, and time to achieve the glycemic target following initiation of insulin drip in the ICU were independent predictors of home discharge in the whole cohort and selected subgroups (Supplementary Tables 1 and 2, available at http://dst.sagepub.com/supplemental).
ICU LOS differed significantly across GV quartiles, being shorter in patients with higher GV for the whole cohort and examined subgroups (Figures 1 and 2, Tables 2 and 3), except for GluCV among patients with a diagnosis of diabetes. ICU LOS was significantly shorter among patients discharged home (P < .0001 for all comparisons; Table 4). Finally, when examined across ICU LOS strata, rates of home discharge and GV values progressively decreased among patients with longer ICU LOS, with GV following a J-type trend (Table 6).
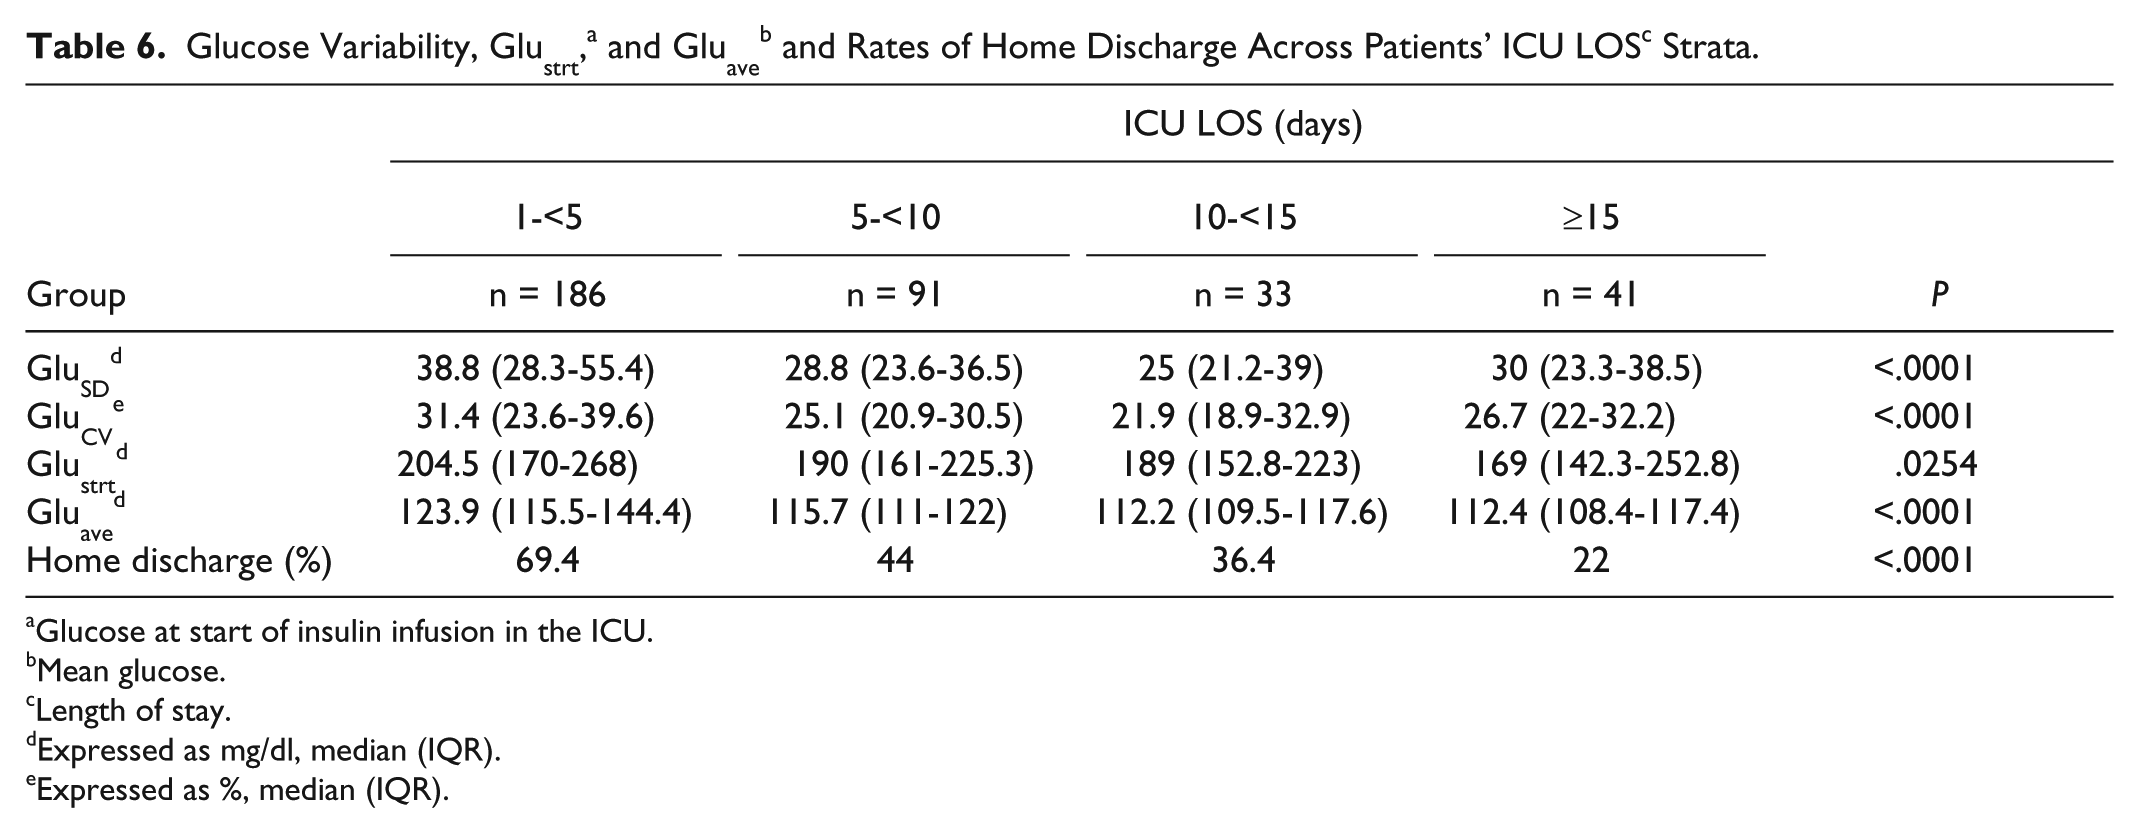
Glucose at start of insulin infusion in the ICU.
Mean glucose.
Length of stay.
Expressed as mg/dl, median (IQR).
Expressed as %, median (IQR).
Gluave, Glustrt, occurrence of hypoglycemia, and male gender were independent predictors of GV (Supplementary Table 3, available at http://dst.sagepub.com/supplemental).
Discussion
The following key findings were noted in the present study: (1) Increased GV was not associated with adverse impact on rates of home discharge among survivors of critical illness, (2) adding GluCV did not significantly improve the predictive role of GluSD, (3) a skewed, inverse association was noted between GV and ICU LOS, and thus patients with longer ICU LOS and lower rates of home discharge had generally better glycemic control as measured by GV, and (4) an increased number of hypoglycemic events and longer duration to achieve glycemic targets adversely affected home discharge in select patient subgroups.
Our study is the first to examine the prognostic role of GV among hospital survivors of critical illness. Because we found no adverse association between increased GV and home discharge in our cohort, while prior studies focused on the association of GV and mortality, it is important to consider areas of similarity and distinction between our study and prior reports on the prognostic impact of GV in adult ICU populations. Our patients had comparable age22,23 and gender distribution,11,22 with a mixed medical-surgical population. 12 Computerized decision support software for insulin dosing was used in 2 prior reports.13,15 While individual population characteristics varied across reports, the glycemic targets,2,12 GV,1,3,12,13,15 Gluave,12,15 rates of hypoglycemia, 3 ICU,1,10 and hospital 15 LOS, and mortality 14 were in line with those reported in prior studies. Only few reports controlled for ICU LOS in multivariate modeling.4,11,13 The values of ICU LOS across quartiles of GV were examined only by Krinsley, with findings of a lower value in the first GV quartile (4.1 days), compared to those in the remainder (6.3-6.5 days). 2
Most of our patients had a diagnosis of diabetes, with its frequency in prior studies ranging from 0.8% 13 to 40%. 4 Other studies often included patients with as little as 3 blood glucose values,2,3,12-14 and at times did not report whether patients with diabetic crises1-3,11,13-15,22 and readmissions2,12,15 were excluded. The frequency of glucose measurement in our cohort is the highest reported to date, ranging in prior reports from about 5 measurements/day 22 to hourly measurements in selected patient subgroups.4,10 In addition, prior reports did not include glucose value-related covariates in multivariate modeling for predictors of GV.2,12
In the only study reported to date on the association of GV with morbidity in adult ICU patients, conducted in Saudi Arabia, 4 no association was found between GV and development of ICU-acquired infections, duration of mechanical ventilation, or duration of ICU and hospital stay, though GV was associated with hospital mortality. The authors noted progressively decreased GV on daily assessments. The latter may have confounded the association between GV and morbidity, but would have been expected to have similar effect on patients’ mortality.
While there are several differences noted between our cohort and prior reports on some patient characteristics, care process, and glycemia-related measures, none appears readily explanatory for the observed lack of adverse association between GV and home discharge.
Several explanations may be considered for the observed lack of adverse impact of increased GV on rates of home discharge in our cohort. Increased number of glucose measurements may have reduced apparent GV in patients with longer ICU LOS, producing simple statistical confounding, but would not explain the magnitude of the observed GV drop with increased ICU LOS. Of note, adjustment for ICU LOS, as done in our study, may not preclude erroneous inferences when the distribution of examined predictor (GV) is systematically skewed across it.
We may have used GV measures that, while commonly reported, are not suitable to detect adverse effects of GV on rates of home discharge among survivors of critical illness. However, there is no gold standard for the definition and measurement of GV 24 and concerns were raised about the interpretation and methodological application of GV measures reported to date. 25
Our findings may reflect actual lack of adverse association of increased GV on rates of home discharge or, alternatively, a beneficial effect of increased GV. However, the combination of reports to date supporting an adverse effect of GV on mortality of ICU patients,1-4,10-15,22,23 and increased morbidity in pediatric critically ill populations,5,6 coupled with available experimental data 24 make the first inference less likely and the latter biologically implausible.
A more plausible explanation for lack of adverse effect of GV on home discharge in our cohort may be through confounding the impact of increased GV by its inverse association with patients’ ICU LOS, where patients with likely increased severity of illness, requiring longer ICU care, had lower GV. The confounding impact of ICU LOS on GV likely reflects, in part, the skewed distribution of glycemia-related predictors of GV. Importantly, our findings demonstrate that a given GV level cannot be considered to have specific prognostic impact out of context of patient’s ICU LOS.
While not being the focus of the present study, our findings demonstrate for the first time an incremental adverse impact of the number of hypoglycemic events on rates of home discharge among survivors of critical illness. These results extend prior reports of increased morbidity18,19 and mortality11,18 associated with mild to moderate hypoglycemia, and increased mortality associated with the number of hypoglycemic events, 20 underscoring the importance of prevention of hypoglycemia in the critically ill.
The apparently beneficial association of increased Gluave with home discharge likely reflects the skewed inverse association between Gluave and ICU LOS. An adverse prognostic effect of the time to achieve glycemic targets, following initiation of insulin infusion in the ICU has not been previously reported and requires further corroboration.
Our study was not designed to evaluate the mechanisms of the observed prognostic associations of the examined glycemia-related measures for the whole cohort and the examined subgroups. Because of the retrospective approach of the present study, our results should be viewed as exploratory, hypothesis-generating findings and require further corroboration.
The strengths of our study include the exclusion of patients with limited number of glucose values, diabetic crises, and readmissions, study of a heterogeneous population, and use of a well-characterized computer-guided insulin dosing tool. The near-hourly glucose measurements, in line with recent consensus recommendations, 21 allowed, short of continuous glucose monitoring, for a more complete capture of glucose fluctuations. Finally, our study included a high proportion of Hispanic patients, a population that was not examined in prior reports of GV-related outcomes of critically ill populations.
Our findings should be considered in the context of several limitations. A retrospective design with its attendant limitations affects the interpretation of our results. However, the majority of studies to date demonstrating strong association between GV and mortality of critically ill patients used similar approach. Our findings reflect the experience of a single center, with a small sample size and, similar to prior studies, may have been affected by selection bias, limiting generalizability. In addition, our findings reflect a specific insulin-dosing protocol. However, use of a computerized decision-support tool allowed a unified approach across caregivers and avoiding the variability noted between different paper-based insulin dosing protocols. 26 The glycemic targets used in our cohort may have affected our findings. Nevertheless, these are in line with those reported by others2,12 in studies demonstrating an adverse mortality impact of GV. Our study shares limitations of prior reports of potentially misclassifying undiagnosed diabetes, lack of data on non glycemia-related ICU events that may impact prognosis, and a possibility of collinearity between examined measures of glycemic control.
Our study focused only on patients receiving insulin infusions and may not apply to those receiving subcutaneous insulin or followed for “spontaneous” GV. The restriction of GV assessment to in-ICU insulin therapy may have affected our findings. However, with rare exceptions, 22 similar approach was used in prior reports. Indeed, in some studies demonstrating significant association between GV and mortality, the duration of GV-related exposure was less than 1 day,3,13 with patient inclusion with as little as 3 glucose values. 2,3,12-14 Unfortunately, the shortest exposure to (possibly abnormal) GV in the ICU to produce an adverse impact in critically ill patients and the minimal number of glucose measurements (or their frequency) required to capture this effect to allow truly evidence-based choice remain to be determined.
We did not adjust for patients’ severity of illness scoring and further study is needed to examine severity-adjusted impact of GV on home discharge. We could not adjust our analyses for patient’s nutritional support, which may have affected GV. However, it is unlikely that nutritional support would have contributed to reduced GV in patients longer ICU LOS and most reports to date did not include nutrition in predictive modeling. Capillary blood and glucometers are well-documented sources of inaccuracy of glucose measurement in the ICU. 21 However, both reflect common contemporary clinical practice, and were commonly used in prior reports demonstrating increased risk of death with elevated GV. In addition, sources of blood and measurement methodology would not have resulted in a decreasing GV with longer ICU LOS.
Finally, we restricted our study to 2 specific measures of GV. Use of different GV metrics may have led to different findings. However, as noted earlier, the limitations of contemporary GV metrics preclude informed selection of an optimal measure of GV in the present context.
Conclusions
Increased GV was not associated with an adverse effect on home discharge among survivors of critical illness requiring insulin infusion during ICU stay. This finding was likely related in part to a confounding skewed inverse relationship between GV and ICU LOS in our cohort. Thus, the prognostic impact of GV should be considered in the context of ICU LOS. The number of hypoglycemic events and time to attainment of glycemic targets were associated with reduced rates of home discharge. There was no significant predictive advantage of adding GluCV to GluSD in the present cohort. Further studies are needed to examine the morbidity effects of GV and other glycemia-related measures among hospital survivors of critical illness across varying ICU populations, glycemic control approaches, and glycemic targets.
Footnotes
Acknowledgements
The authors would like to thank Dr Zainab Akhtar for her help with data gathering.
Abbreviations
ARDS, acute respiratory distress syndrome; CI, confidence interval; Gluadm, glucose at the time of hospital admission; Gluave, mean glucose; GluCV, coefficient of variation of glucose; GluSD, standard deviation of glucose; Glustrt, glucose at start insulin infusion in the ICU; GV, glucose variability; H, home discharge; ICU, intensive care unit; LOS, length of stay.
Declaration of Conflicting Interests
The author(s) declared no potential conflicts of interest with respect to the research, authorship, and/or publication of this article.
Funding
The author(s) received no financial support for the research, authorship, and/or publication of this article.
References
Supplementary Material
Please find the following supplemental material available below.
For Open Access articles published under a Creative Commons License, all supplemental material carries the same license as the article it is associated with.
For non-Open Access articles published, all supplemental material carries a non-exclusive license, and permission requests for re-use of supplemental material or any part of supplemental material shall be sent directly to the copyright owner as specified in the copyright notice associated with the article.