
Abstract
Background:
Type 1 diabetes mellitus (T1DM) complications are significantly reduced when normoglycemic levels are maintained via intensive therapy. The artificial pancreas is designed for intensive glycemic control; however, large postprandial excursions after a meal result in poor glucose regulation. Pramlintide, a synthetic analog of the hormone amylin, reduces the severity of postprandial excursions by reducing appetite, suppressing glucagon release, and slowing the rate of gastric emptying. The goal of this study is to create a glucose-insulin-pramlintide physiological model that can be employed into a controller to improve current control approaches used in the artificial pancreas.
Methods:
A model of subcutaneous (SC) pramlintide pharmacokinetics (PK) was developed by revising an intravenous (IV) pramlintide PK model and adapting SC insulin PK from a glucose-insulin model. Gray-box modeling and least squares optimization were used to obtain parameter estimates. Pharmacodynamics (PD) were obtained by choosing parameters most applicable to pramlintide mechanisms and then testing using a proportional PD effect using least squares optimization.
Results:
The model was fit and validated using 27 data sets, which included placebo, PK, and PD data. SC pramlintide PK root mean square error values range from 1.98 to 10.66 pmol/L. Pramlintide PD RMSE values range from 10.48 to 42.76 mg/dL.
Conclusions:
A new in silico model of the glucose-insulin-pramlintide regulatory system is presented. This model can be used as a platform to optimize dosing of both pramlintide and insulin as a combined therapy for glycemic regulation, and in the development of an artificial pancreas as the kernel for a model-based controller.
Keywords
Type 1 diabetes mellitus (T1DM) is a chronic metabolic disorder characterized as an autoimmune disease in which the body specifically attacks pancreatic β-cells. This results in insulin and amylin deficiencies, which produces chronic hyperglycemia. 1 Insulin injection therapy is effective in many patients, but it is imperfect. People with T1DM face a trade-off among glycemic control, lifestyle flexibility, and therapy effort. Using current therapy options, near normoglycemia can be achieved only by patients at the expense of lifestyle flexibility and increased therapy effort. Because of this excellent glycemic control remains more of an aspiration than a reality.
Recent technological advances provide an opportunity to combine 3 technologies: continuous glucose monitors, insulin pumps, and a control algorithm; this forms the basis of an artificial pancreas.2-5 Despite important advances in the artificial pancreas, most patients with T1DM are still unable to achieve near-normoglycemia with insulin therapy alone. The limitations of current insulin replacement therapy are especially evident during the postprandial period, when rapid and profound changes in glucose flux occur as a sudden appearance of meal-derived glucose goes into circulation.6-8
In the development of an artificial pancreas, the primary difficulties are the inherent time delays in the closed system due to subcutaneous (SC) delivery of insulin and SC reading of glucose, with additional built-in filters in the monitor. 2 The lack of timely information coupled with large postprandial excursions after a meal and poor insulin management make glucose regulation very difficult.2,8 Postprandial glucose control is the 1 area where the largest gain can be achieved; therefore, the focus is on finding methodologies to lower postprandial glucose excursions.
In healthy individuals, insulin and amylin are cosecreted from the pancreatic β-cells in response to a meal. 9 Insulin acts to inhibit hepatic glucose output through inhibition of glucagon from the pancreatic α-cells and stimulates the uptake of glucose into peripheral insulin-sensitive cells. Amylin modulates appetite, suppresses glucagon secretion, and slows the rate at which nutrients are delivered from the stomach to the small intestine for absorption. Amylin mitigates the influx of endogenous and exogenous glucose into the circulation and thus improves the rate of glucose clearance incurred by insulin.10,11
In T1DM however, both amylin and insulin production are decreased significantly due to the death of β-cells. Patients exhibit a paradoxical postprandial hyperglucagonemia in which endogenous glucagon levels are elevated in the portal circulation and insulin levels are reduced. Administration of exogenous insulin alone does not normalize the portal glucagon to insulin ratio; the liver continues to release glucose into the circulation, resulting in hyperglycemia. 12 It seems logical then to include both insulin and amylin in the fight against postprandial hyperglycemia in T1DM. Pramlintide, a soluble, nonaggregating, equipotent synthetic analog of amylin, is approved by the FDA and used to treat T1DM patients who are unable to obtain near-normoglycemia with insulin therapy alone. 13
In 2012, a study was done using closed-loop control of insulin along with pramlintide treatment in young adults and adolescents, who demonstrated marked improvements in regulation and significant reduction in glucose postprandial peak and a delay of peak glucose occurring more than 1 hour later than the placebo patients. 14 The meal’s immediate impact is lowered dramatically and spread out making glucose control much improved. 14 The controller was a proportional integral derivative (PID) controller using model-based insulin feedback. 15 Results looked very promising but were essentially preliminary with only 8 patients.
In the closed-loop study above, 14 there were no incidents of hypoglycemia over the 2 days. Weinzimer et al 14 gave no premeal boluses to the patients. All insulin delivery was due to automatic feedback based on actual glucose readings. Many other studies16-23 have reported that pramlintide resulted in hypoglycemia. However, the cause of hypoglycemia was a result of the interplay between insulin and pramlintide. These studies when exploring pramlintide dosing did not investigate lower insulin dosages. Pramlintide mechanisms allow for postprandial glucose to be significantly reduced, thus requiring a lower insulin dosage than previously used. What is required is a better model to help calculate new premeal boluses in the presence of pramlintide, test other dose regimens, and test the possibility of use in a better model-based controller.
The most detailed model for pharmacokinetics and pharmacodynamics (PK/PD) for pramlintide 13 is based on using intravenous (IV) pramlintide doses. The most recent model 24 had PD based on 1 set of 15 patients using 1 concentration of SC pramlintide given at only 1 time point relative to a single meal and insulin bolus. The model did not include PK of pramlintide but instead had parameters for the gastric emptying model modified proportionately by initial dosage of pramlintide and amount of glucose present in the meal. 24
The study presented in this article was undertaken to develop a PK/PD model based on an existing glucose-insulin model 25 with the addition of the drug pramlintide. This model is based on SC lispro (short-acting) insulin 26 and pramlintide administration along with a working meal model. Pramlintide PD was based on the mechanisms of pramlintide and its effect on plasma glucose at the postprandial period. Parameter fits and model validation were achieved using data found in the literature, which includes 6 articles with 27 data sets.7,13,17,21-23 We sought to create a glucose-insulin-pramlintide model that could be used to evaluate strategies incorporating pramlintide into T1DM therapies.
Model
The proposed model is based on parameters and equations from 3 articles.20,25-26 This model consists of a glucoregulatory and insulin action subsystem model 25 with SC lispro (short-acting) insulin kinetics (insulin subsystem) 26 substituted. The pramlintide PK is taken from a previous study 20 with the SC pramlintide PK adapted from SC insulin PK. 26
Several changes to the original models20,25-26 have been made. A meal correction, a change in tmax,G, and the addition of a meal delay (nθ) all in the presence of pramlintide have been added to the glucoregulatory subsystem found in Hovorka et al 25 . The insulin action subsystem of Hovorka et al 25 and the lispro (short-acting) insulin SC kinetics of Wilinska et al 26 both remain unchanged. Clodi et al 20 has been converted from IV pramlintide administration to SC by the addition of a SC compartment (SQpf). A pramlintide transport delay (pθ), which is the delay from the time pramlintide is administered to the time an effect of pramlintide is seen on blood glucose has also been added. The model outline is shown in Figure 1.
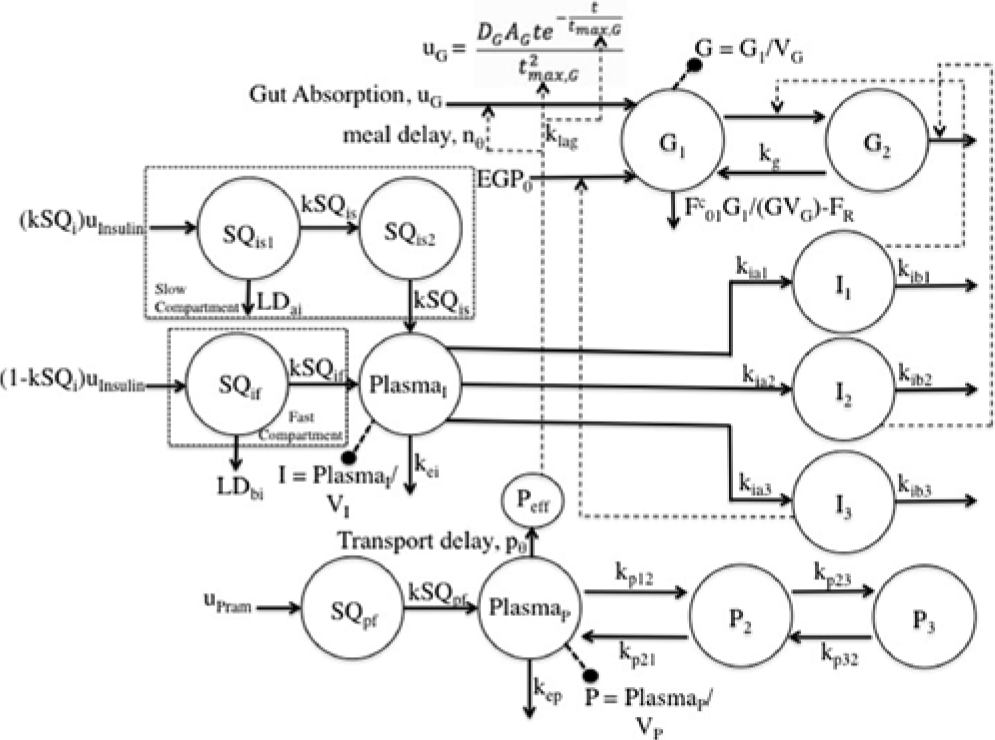
Compartment model of glucose–insulin-pramlintide system. G1 and G2 represent masses in accessible (plasma) and nonaccessible compartments, PlasmaI represents plasma insulin; Ii represents insulin action on glucose transport, disposal, and endogenous glucose production; PlasmaP represents plasma pramlintide; Pi represents hypothetical compartments that affect PlasmaP; Peff represents the effective pramlintide compartment that is used for pramlintide mechanisms on glucose. For more details, see the text.
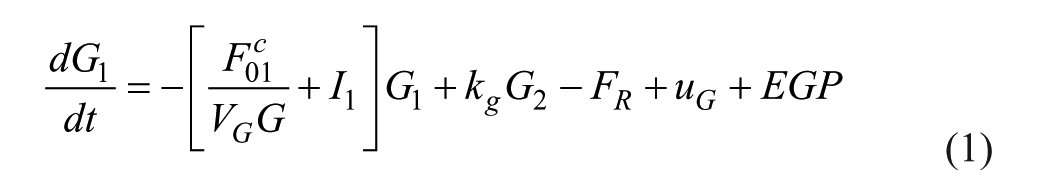
Glucose Subsystem
The first 2 states are the total mass of glucose in each compartment, scaled by the patient weight.
25
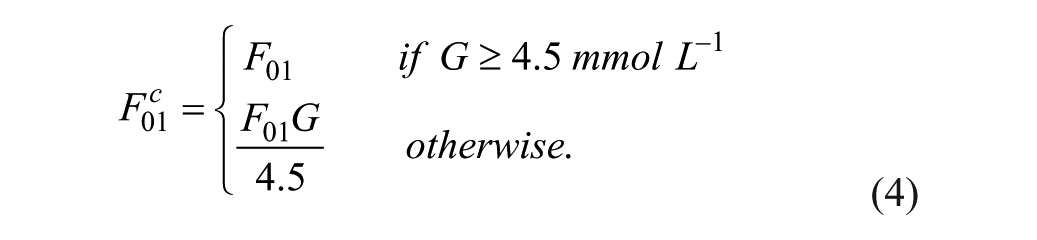
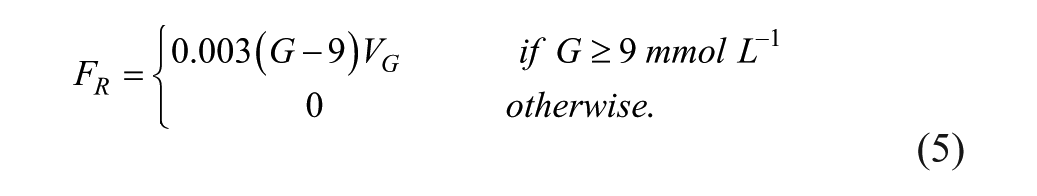
The material balance around the first compartment includes renal clearance (


where
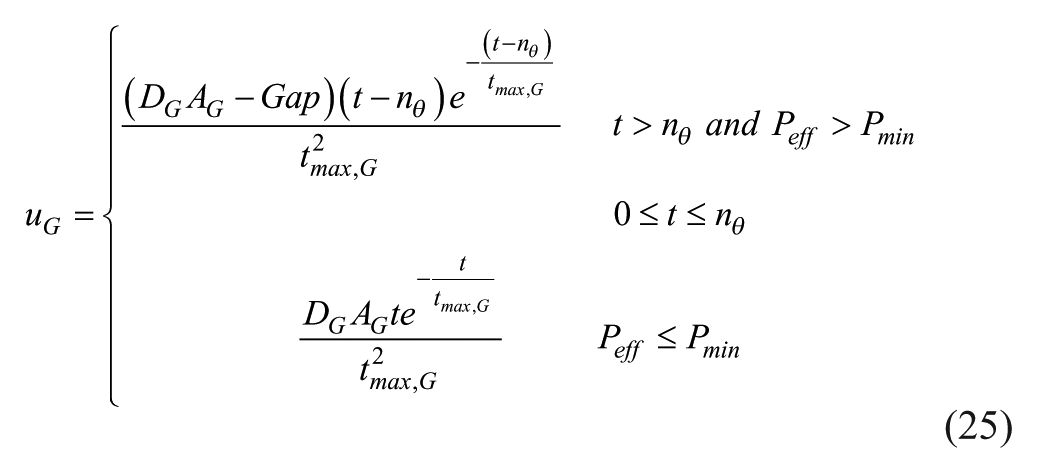
A second order pulse response is used as the meal disturbance, 25
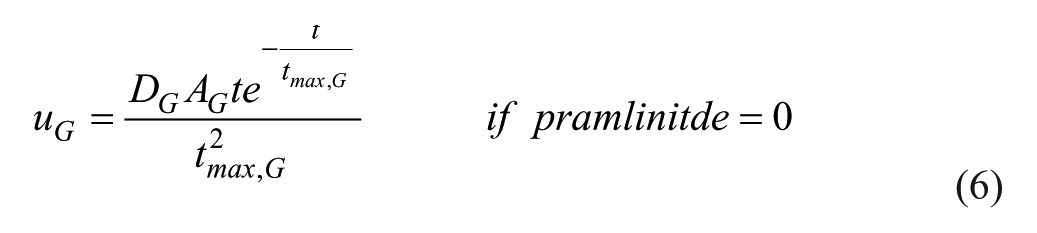
where
Insulin Subsystem
SC lispro (short-acting) insulin PK, 26
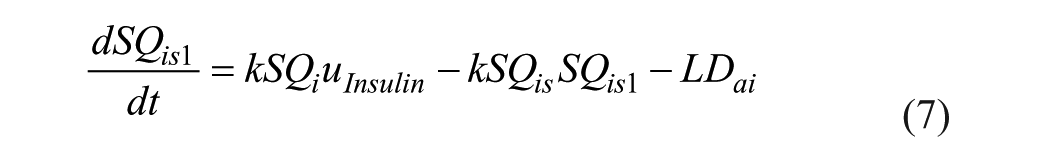
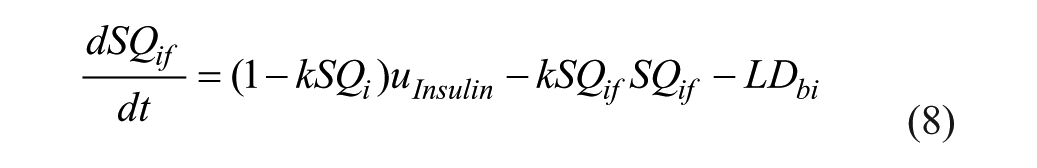
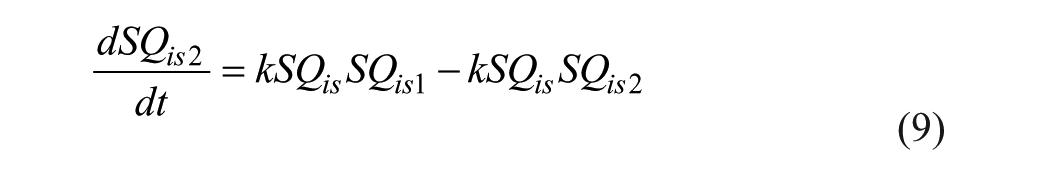

where the insulin dosage is represented by
Insulin Action Subsystem
The model represents 3 actions of insulin on glucose kinetics, 25


where
Insulin sensitivities were taken from Palerm, 15 who found that nominal insulin sensitivities were generally too high for adolescents and older people (these generally result in insulin/carb ratios of 1/25 or so); these sensitivities have been reduced by one-half. 15
Pramlintide Subsystem
IV pramlintide PK equations were taken from a previous pramlintide study 20 and adapted to SC pramlintide PK,

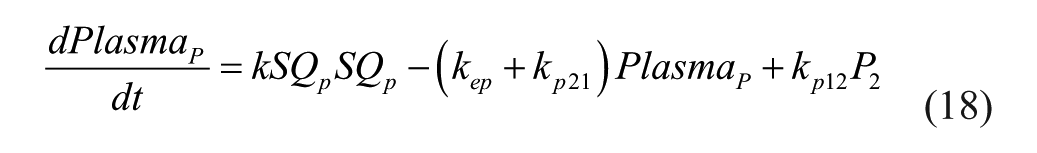
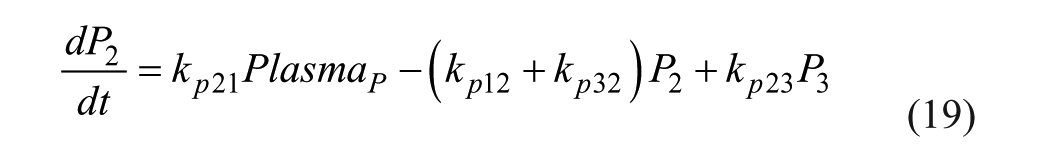


where the pramlintide dosage is represented by
Pramlintide Action Subsystem
Pramlintide, when in the system, affects the peak meal absorption time (
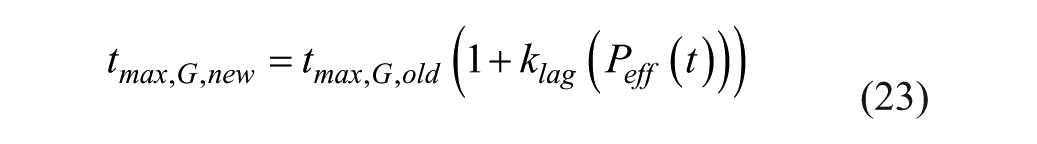
where
where pθ is a transport delay of pramlintide between its administration and its effective site resulting in an effective concentration,
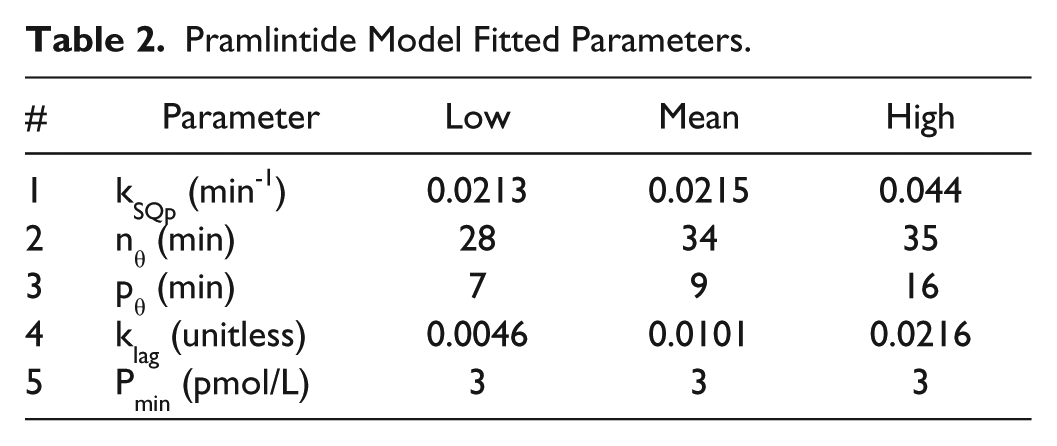
Model Constants and Parameters
Model quantities were divided into model constants from the literature (Table 1) and model fitted parameters from this study (Table 2).
Glucose Model Constants Hovorka et al 25
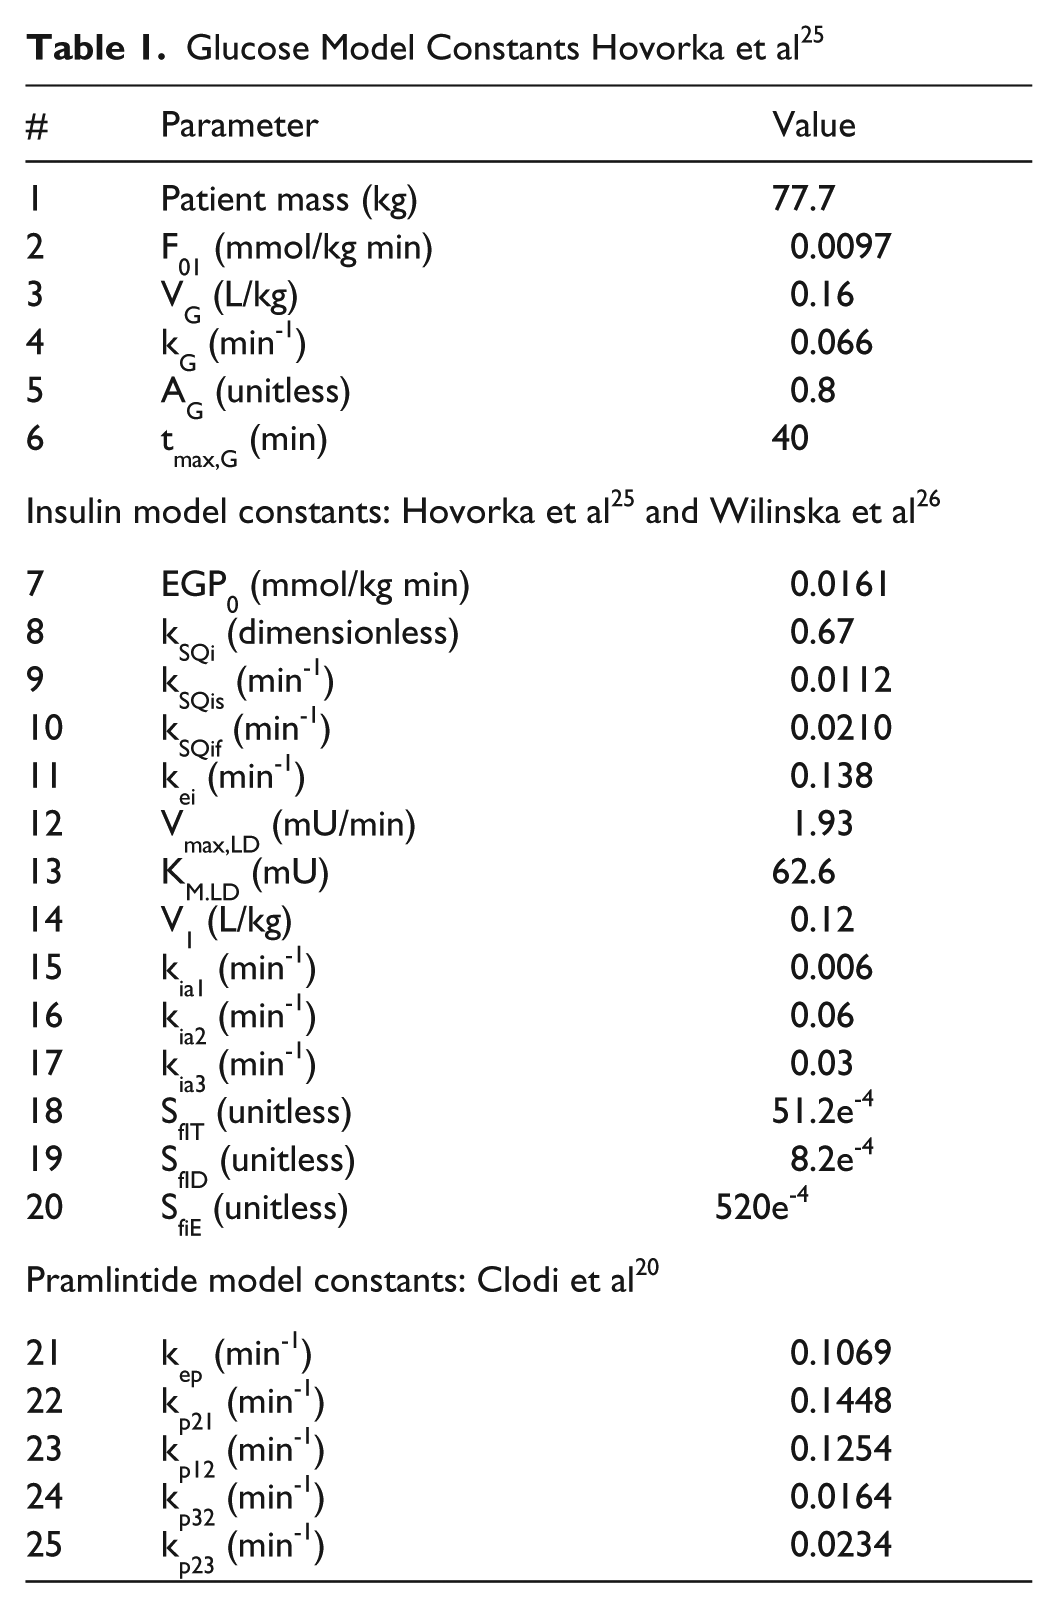
Pramlintide Model Fitted Parameters.
Methods
Introduction
All modeling, parameter estimations, and simulations were performed using MATLAB® 2012a (Mathworks, Inc, Natwick, MA). Original data from studies were not available. Therefore, the program GraphClick© (Arizona Software, Zurich, Switzerland, http://www.arizona-software.ch/graphclick) was used to get data points of mean values presented in published graphs.
Data Sets
Six previously published articles7,13,17,21-23 with 27 data sets were used for the modeling of both pramlintide SC PK and PD. Colburn et al 21 and Fang et al 13 were used for predicting IV PK. Kong et al 23 was used for fitting SC PK, and Kolterman et al 22 was used for predicting SC PK. Weyer et al 7 was used for fitting PD, and Thompson et al, 17 Kong et al, 23 Kolterman et al, 22 and Fang et al 13 were used for predicting PD.
The first article, Colburn et al, 21 included 6 data sets and was used to test IV PK of pramlintide. This study included 24 subjects with T1DM. The 24 subjects were divided into 3 pramlintide dose groups of 8 subjects each: group A was given 30 mcg, group B was given 100 mcg, and group C was given 300 mcg. Patients in each dose group underwent a 2-period IV bolus-versus-infusion crossover. The study design included administration of usual insulin dose 30 minutes before pramlintide administration. A standardized meal was given 30 minutes after pramlintide dosage. Bolus pramlintide was given as an IV push over 2 minutes, and the infusion was given over a period of 2 hours.
The second article, Fang et al, 13 included 6 data sets and was used to test our model’s IV pramlintide PK/PD model. This study included 25 male subjects with T1DM. This study followed the same protocol used by Colburn et al. 21
The third article, Kong et al, 23 which included 4 data sets, was used to fit SC pramlintide PK and validate PD. This study included 11 men with T1DM. Gastric emptying was measured using low-activity radioactive markers (99mTc) were attached to the surface of the subject’s skin, anteriorly and posteriorly. Thirty minutes before they were due to eat, the patients injected themselves with their usual morning insulin, and 15 min later they injected the study drug (either placebo or 30, 60, or 90 mcg pramlintide) subcutaneously. At 0 min, within 10 min, they ate a standard meal consisting of a pancake, labeled with 3MBq nonabsorbable Tc-99m-ion exchange resin, and a low fat milkshake containing 3-OMG. The meal consisted of 62.5 g of carbohydrates. Gastric emptying images were obtained for the next 8 hours. At 240 min the subjects ate a similar meal.
The fourth article, Kolterman et al, 22 included 3 data sets and was used to validate SC PK/PD. This study investigated the effects of a 14-day period of amylin replacement therapy on responses to a standardized IV insulin infusion and a liquid Sustacal meal in amylin-deficient T1DM subjects. This study included 84 subjects; 22 subjects were given a placebo, 18 were given 30 mcg of pramlintide, 23 were given 100 mcg of pramlintide, and 21 were given 300 mcg of pramlintide. The pramlintide dosage was given 30 minutes before the liquid Sustacal meal of 49.5 g of carbohydrates, and the insulin infusion of 40 mU kg-1 hr-1 for 100 minutes was given at the same time. Blood glucose, lactate, glucagon, insulin, catecholamines, calcium, and potassium levels were measured. It should be noted that plasma glucose concentrations were not given prior to the meal resulting in the fitting of the baseline glucose concentrations at t = −30 min (time insulin and pramlintide were administered).
The fifth article, Weyer et al, 7 included 5 data sets and was used to fit our model’s PD. Lispro insulin and regular insulin were both used in this study. However, only lispro insulin was used as our model expresses the kinetics of only lispro insulin. This study included 21 subjects. Subjects received 1 of 5 treatments (a SC injection of placebo at −15 min or 60 mcg pramlintide) at −15, 0, +15, or +30 min relative to the standardized breakfast according to a randomized sequence, after an overnight fast. The meal and insulin dosage (6-6.3 units) were given at 0 min. It should be noted for the pramlintide dosage given at t = −15 min relative to the meal plasma glucose concentrations were only given from t = 0 min (time meal and insulin were administered), resulting in the fitting of the baseline glucose concentration for this pramlintide dosage.
The final article, Thompson et al,
17
included 3 data sets and was used to validate our model’s PD. This study was a double-blind, randomized, placebo-controlled, parallel-group, fixed-dose study comparing the effects on 24-hour plasma glucose profiles, PK, and drug tolerance of 3 doses of pramlintide and placebo administered 4 times a day for 14 days to patients with T1DM. Insulin was given 30 minutes prior to the meal, and pramlintide dosage of 0 mcg (placebo) (42 subjects), 10 mcg (43 subjects), 30 mcg (41 subjects), or 100 mcg (42 subjects) was given 15 minutes before the meal. The meal was a standardized Sustacal meal of 75 g of carbohydrates. It should be noted that at 9:00
Performance Metrics
Root mean square error (RMSE) was used as measures of goodness of fit. Data are reported as mean ± standard error of the mean,

where x is our model’s estimate, xref is the reference value and n is the number of samples.
Modified Hovorka Glucose-Insulin Model
The original modified Hovorka25-26 with glucose and lispro insulin (rapid acting) PK/PD was tested on clinical data7,17,22-23 using known meal amounts. Insulin amounts were fitted for all data except Weyer et al, 7 where insulin amount was known.
Pramlintide Pharmacokinetics
IV pramlintide kinetics 20 were added to the modified Hovorka25,26 and tested with clinical data13,21 shown in Figures 2 and 3. Next, the IV pramlintide kinetics 20 were converted to SC kinetics by adapting the SC kinetics of insulin. 26 The original model had 7 parameters to fit. Parameters were fit to SC PK data. 23 These parameters were fit by first linearizing the model. Then, using the system identification toolbox in MATLAB, a gray-box model was created by using the “idgrey” function. Estimating parameters was done using the “greyest” command, which estimates a linear gray-box model, using time or frequency domain from experimental data. Least squares optimization was used to obtain final parameter estimates. Two of the 3 compartments were removed based on null parameter estimates. Resulting in 1 compartment with 1 added parameter, kSQp. High and low parameter estimates were found by using least squares optimization 1 standard deviation from the mean. PK was validated using data found in Kolterman et al. 22 Pramlintide kinetics seem to change over time; 22 to address this issue the volume at the pramlintide active site (VP; equation 21) was fit using least squares optimization.
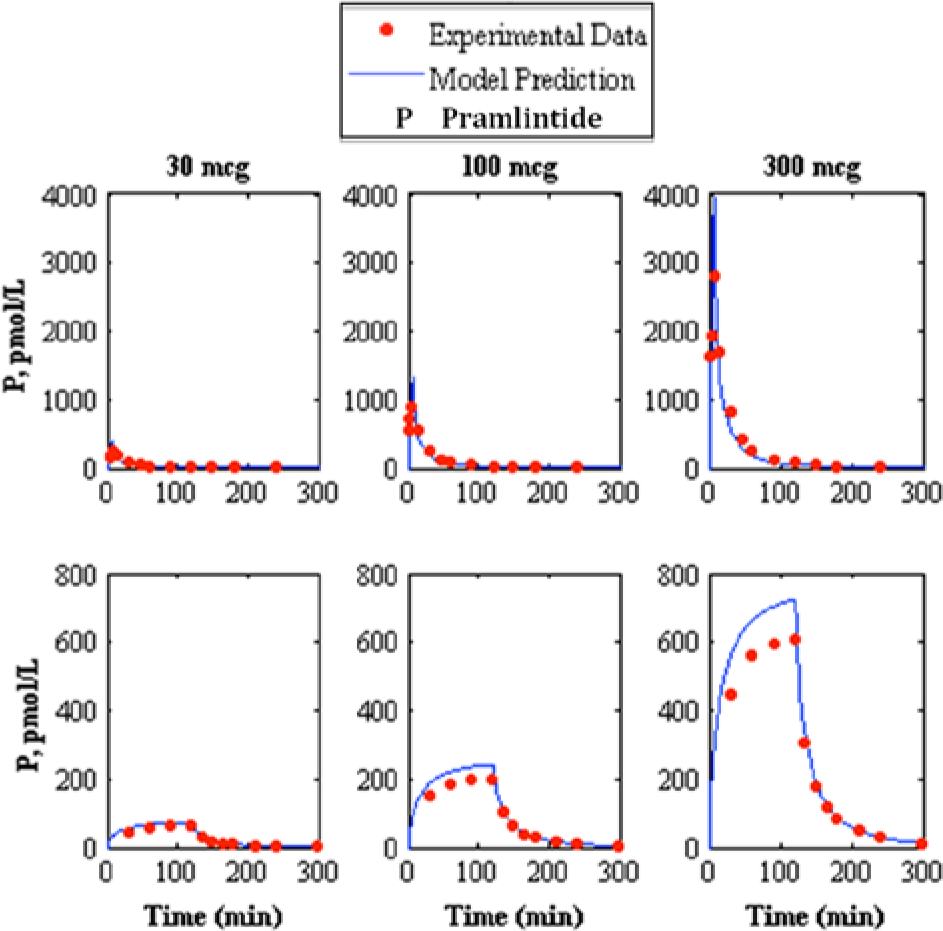
Comparison of intravenous pramlintide kinetics 20 3-compartment model to experimental data. 13 The top represents intravenous bolus and the bottom represents intravenous infusion, where the left, middle, and right represent pramlintide dosages of 30, 100, and 300 mcg, respectively, where the model prediction is represented by the solid line and experimental data points are represented by the dotted line.
Comparison of intravenous pramlintide kinetics 20 3-compartment model to experimental data. 21 The top represents intravenous bolus and the bottom represents intravenous infusion where the left, middle, and right represent pramlintide dosages of 30, 100, and 300 mcg respectively, where the model prediction is represented by the solid line and experimental data points are represented by the dotted line.
Pramlintide Pharmacodynamics
Glucose parameters most likely to undergo changes by pramlintide were scrutinized. Three parameters were chosen to be tested:
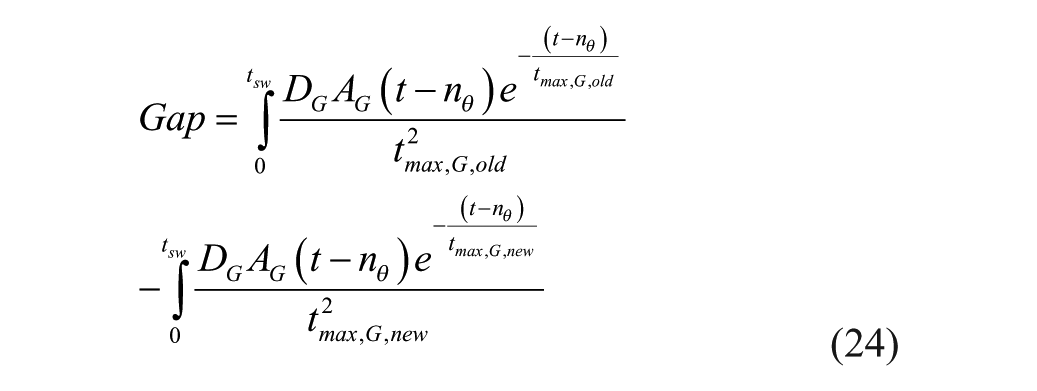
Modification of the peak meal absorption time (tmax,G) equation 23 in this model affects not only dynamics but the magnitude of the meal uptake, which shows the process sensitivity of the second order pulse response used as the meal disturbance found in Hovorka et al, 25 equation 6. For this system, it is critical that the total meal does not change. If you modify the peak meal absorption time (tmax,G) without making a correction, you will get a different final meal amount than what was initially given. This can be seen in Figure 4a, where a step change in the time constant occurs at t = 20 min. Here different final meal amounts occur for different time constants (tmax,G). In Figure 4b you can see the different meal consumption at the peak meal absorption time change (tmax,G); this is the gap that needs to be compensated for mathematically to get a total meal consumed that is the equal to the amount that is initially stated. In Figure 4c the same step response that was done in 4a shows the mathematical correction for the gap where final meal consumption is equal to the initial meal given with varying peak meal absorption times (tmax,G).
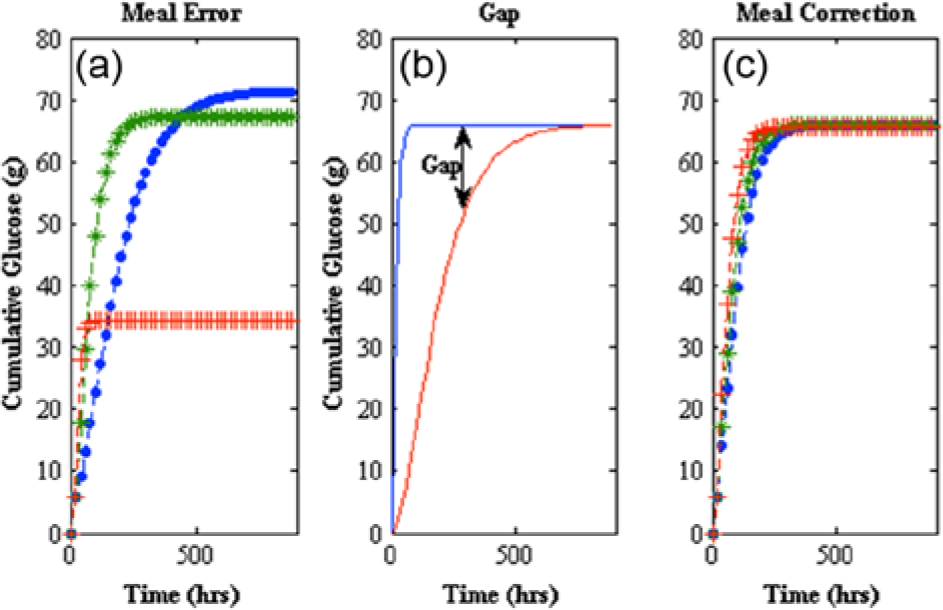
(a) Meal error (left) shows cumulative glucose consumed after a step change at t = 20 min of
Results
Modified Hovorka Glucose-Insulin Model
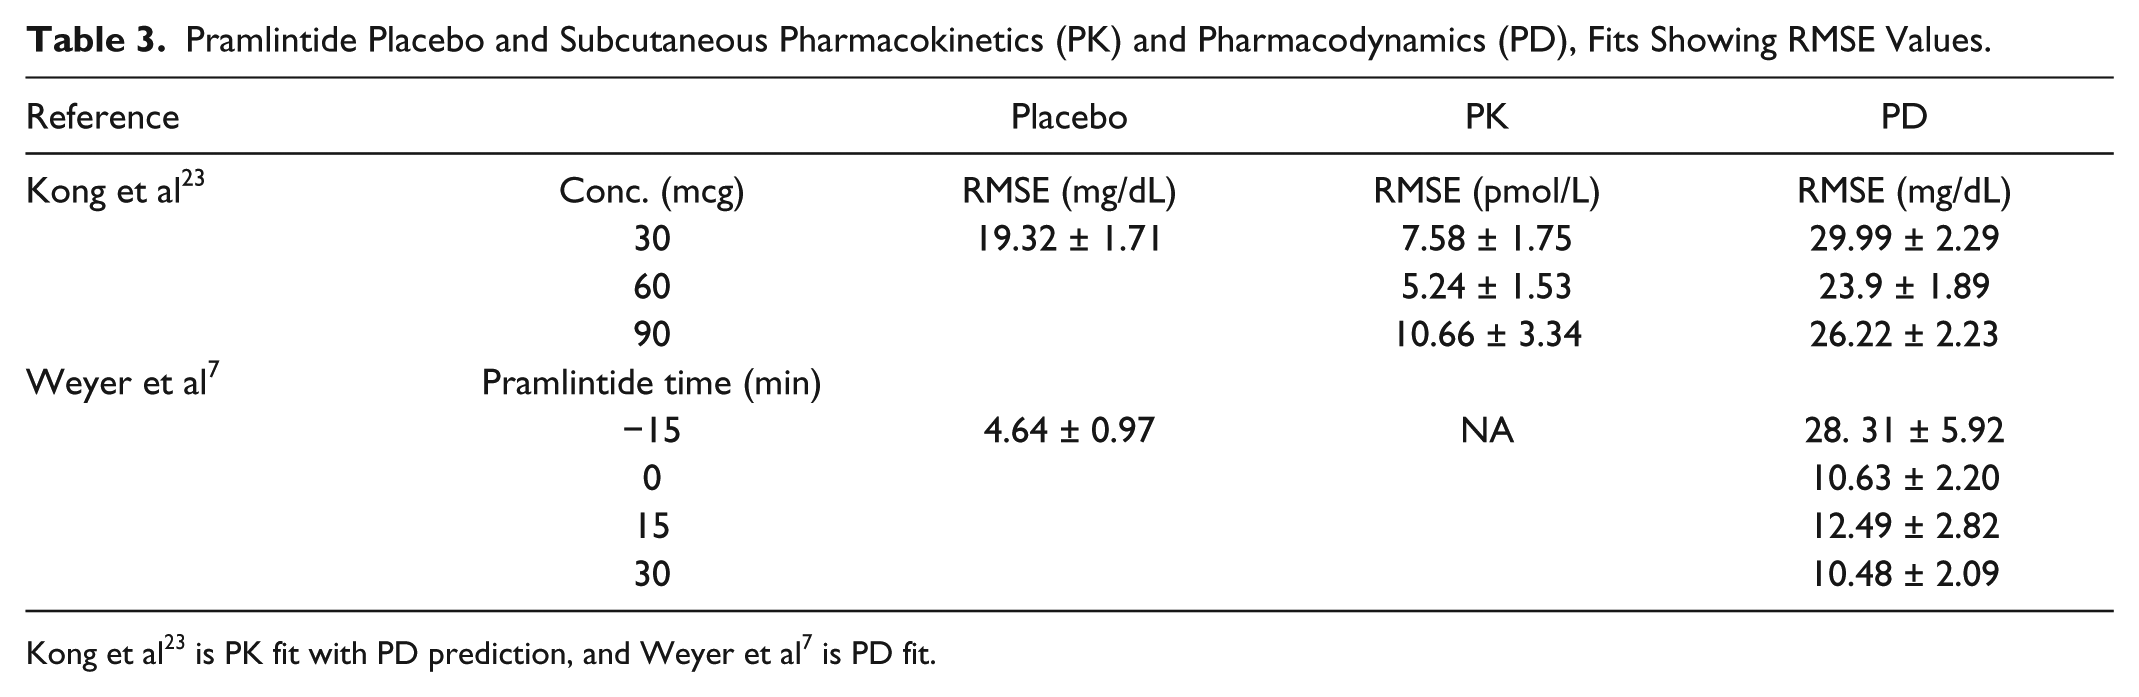
Fitting the various placebos found in the data tested the modified Hovorka model25-26 (Tables 3 and 4; Figures 5 to 9). Fitted RMSE values range from 4.64 to 25.74 mg/dL.
Pramlintide Placebo and Subcutaneous Pharmacokinetics (PK) and Pharmacodynamics (PD), Fits Showing RMSE Values.
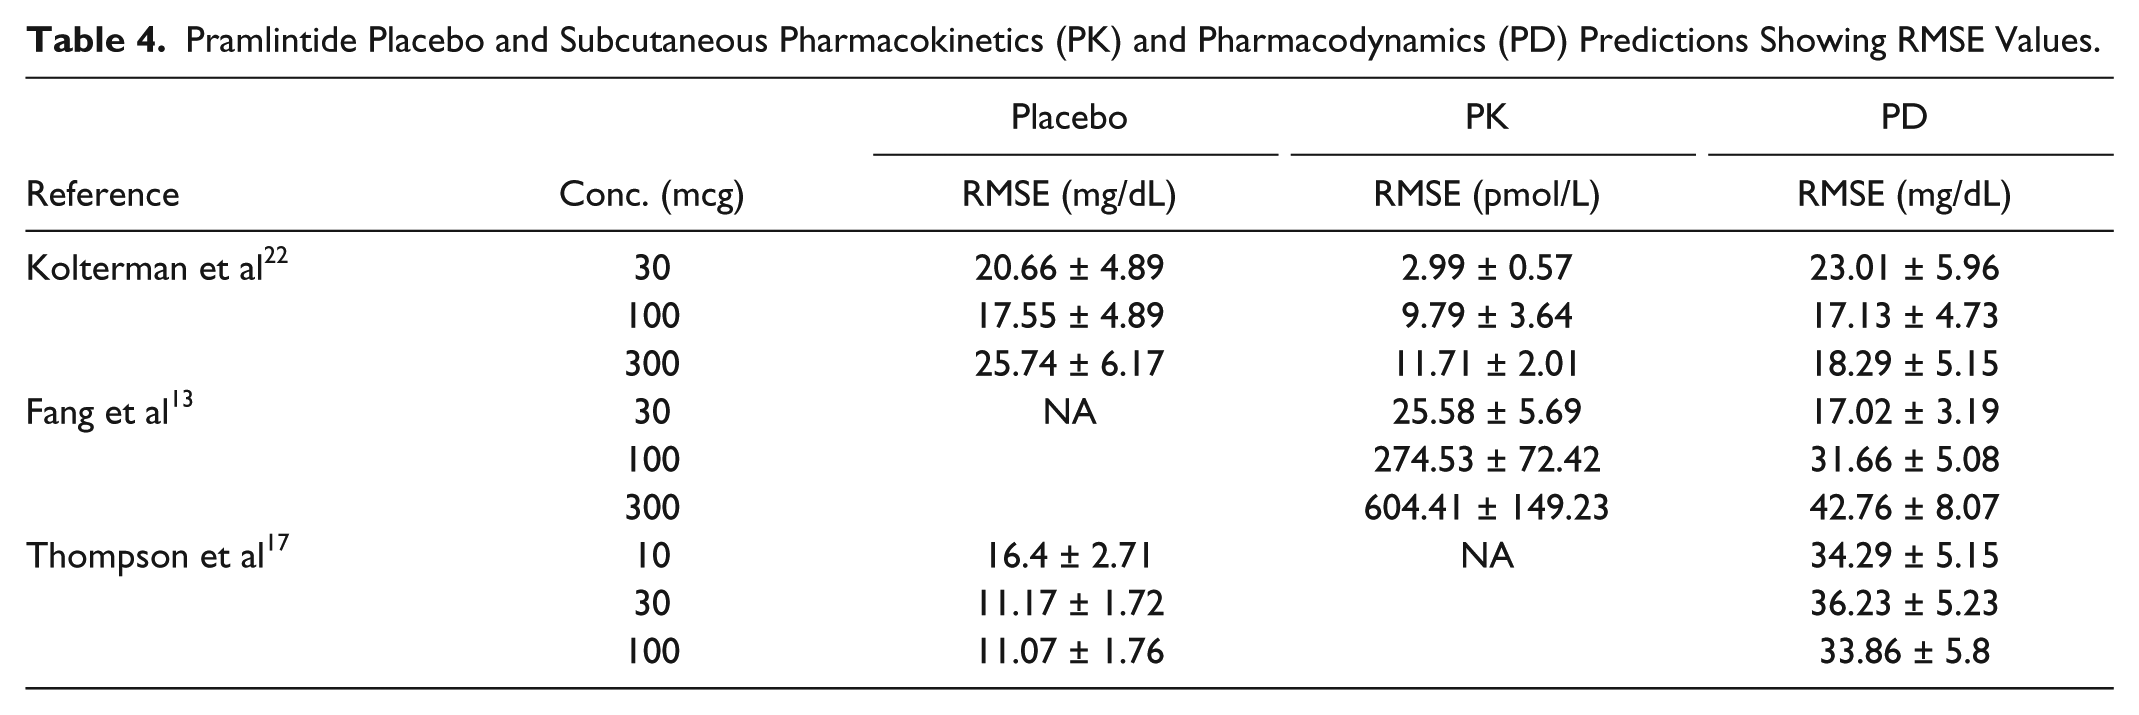
Pramlintide Placebo and Subcutaneous Pharmacokinetics (PK) and Pharmacodynamics (PD) Predictions Showing RMSE Values.
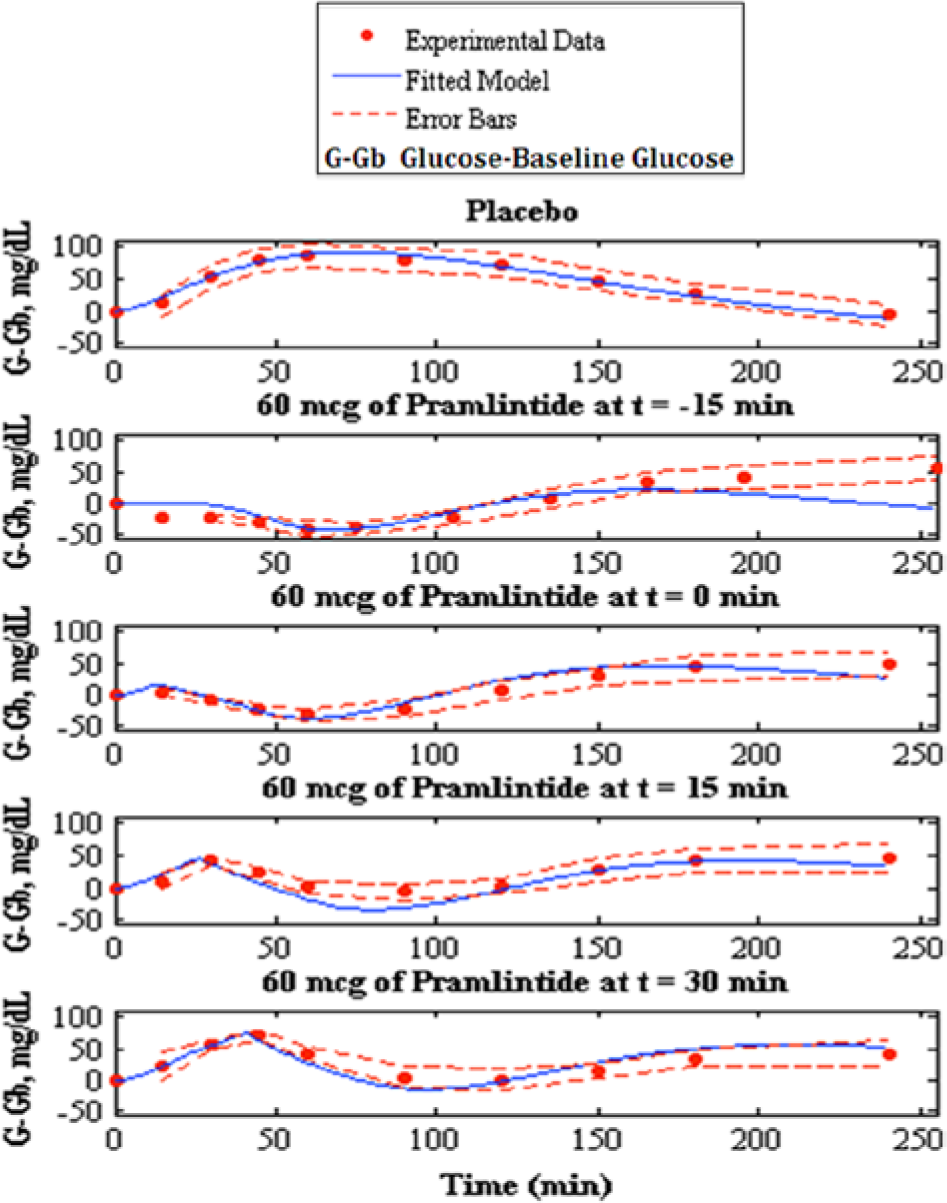
Fitting of pramlintide pharmacodynamics to experimental data, 7 the top shows the placebo fit followed by pramlintide doses of 60 mcg given and t = −15, t = 0, t = 15 and t = 30 min. Model fit is represented by the solid line, experimental data points are represented by the dotted line, and the standard deviation of the experimental data is represented by the dashed line.
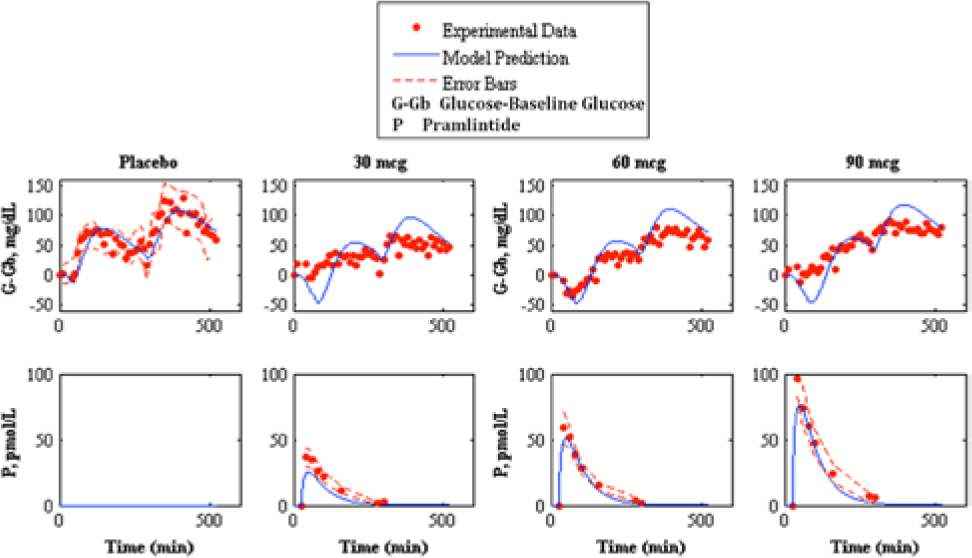
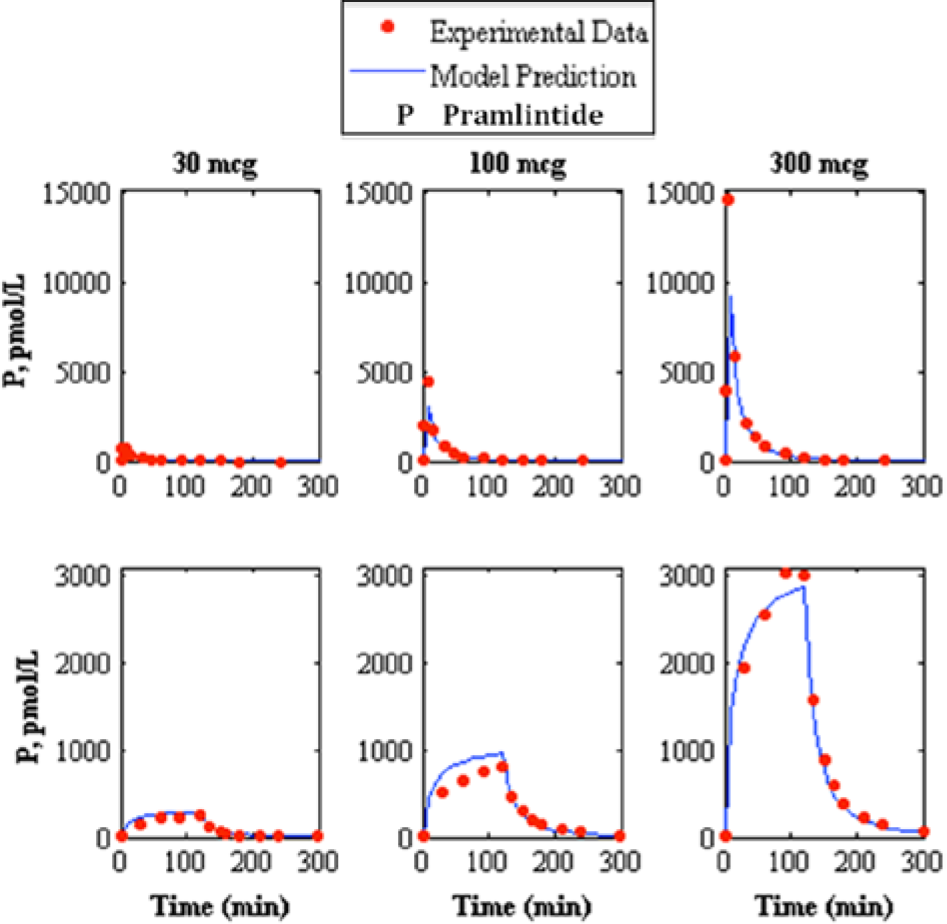
Fitting of pramlintide subcutaneous pharmacokinetics and prediction of pramlintide pharmacodynamics to experimental data. 23 The top shows pharmacodynamics predictions and the bottom shows pharmacokinetic fits. The left graph shows placebo fits followed by 30, 60, and 90 mcg pramlintide doses. Our model fit/prediction is represented by the solid line, experimental data points are represented by the dotted line, and the standard deviation of the experimental data is represented by the dashed line.
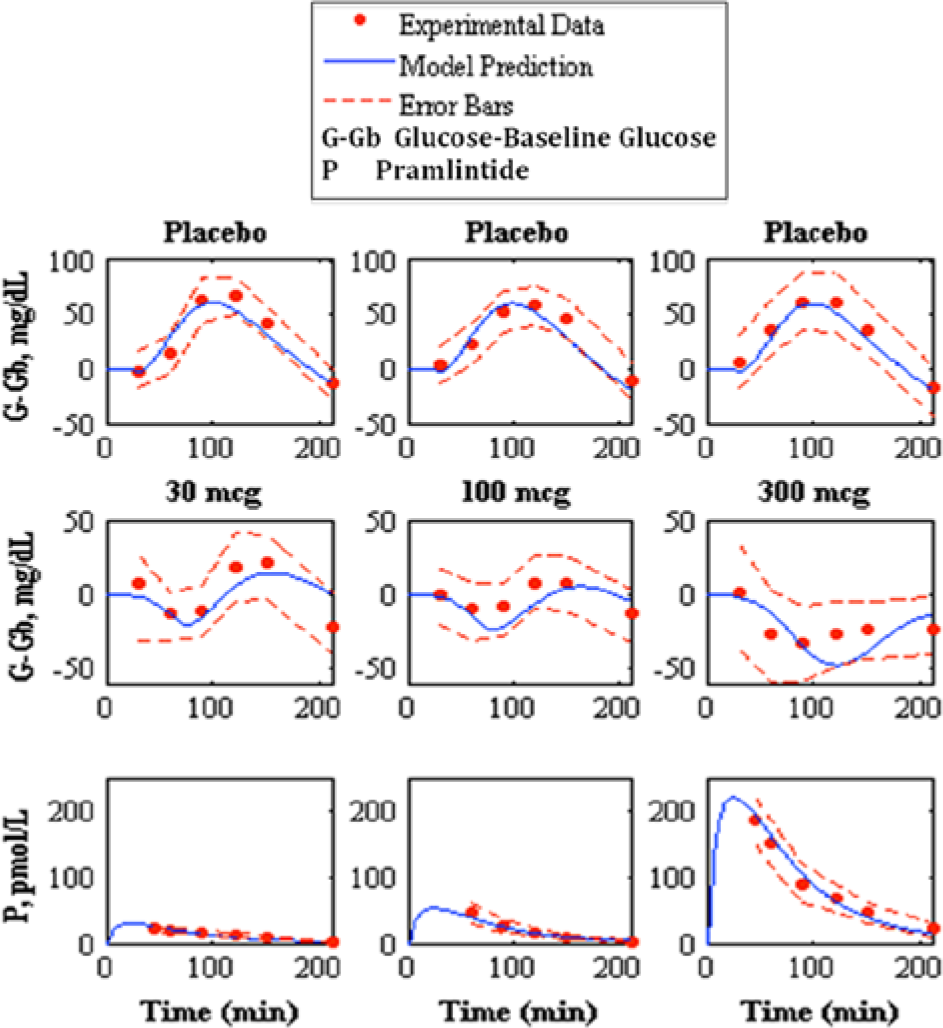
Prediction of pramlintide pharmacodynamics and subcutaneous pharmacokinetics to experimental data. 22 The top shows the placebo fits, the middle shows pharmacodynamics predictions, and the bottom shows pharmacokinetics predictions of 30, 100, and 300 mcg pramlintide doses, left, middle, and right, respectively. Model prediction is represented by the solid line, experimental data points are represented by the dotted line, and the standard deviation of the experimental data is represented by the dashed line.
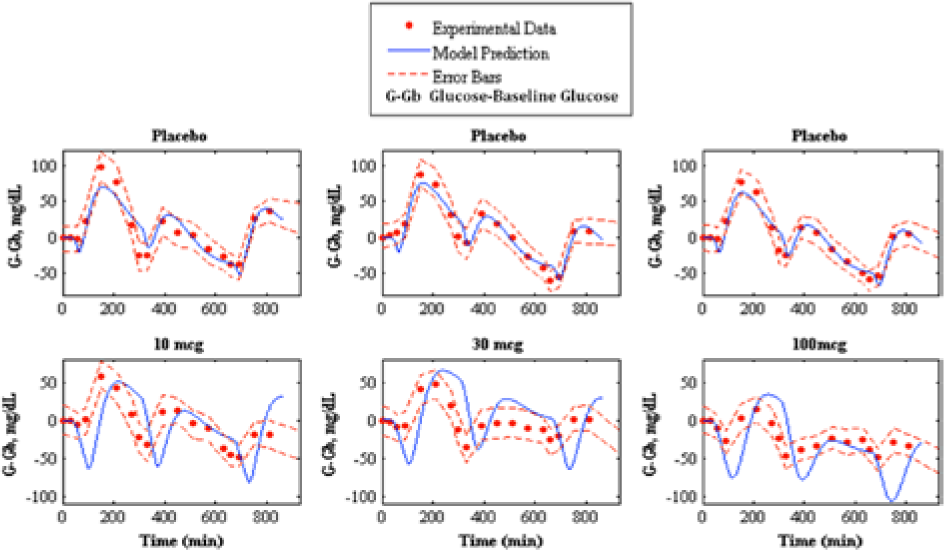
Prediction of pramlintide pharmacodynamics to experimental data. 17 The top shows the placebo fits and the bottom shows pharmacodynamics predictions of 10, 30, and 100 mcg pramlintide doses, left middle, and right, respectively. Model prediction is represented by the solid line, experimental data points are represented by the dotted line, and the standard deviation of the experimental data is represented by the dashed line.
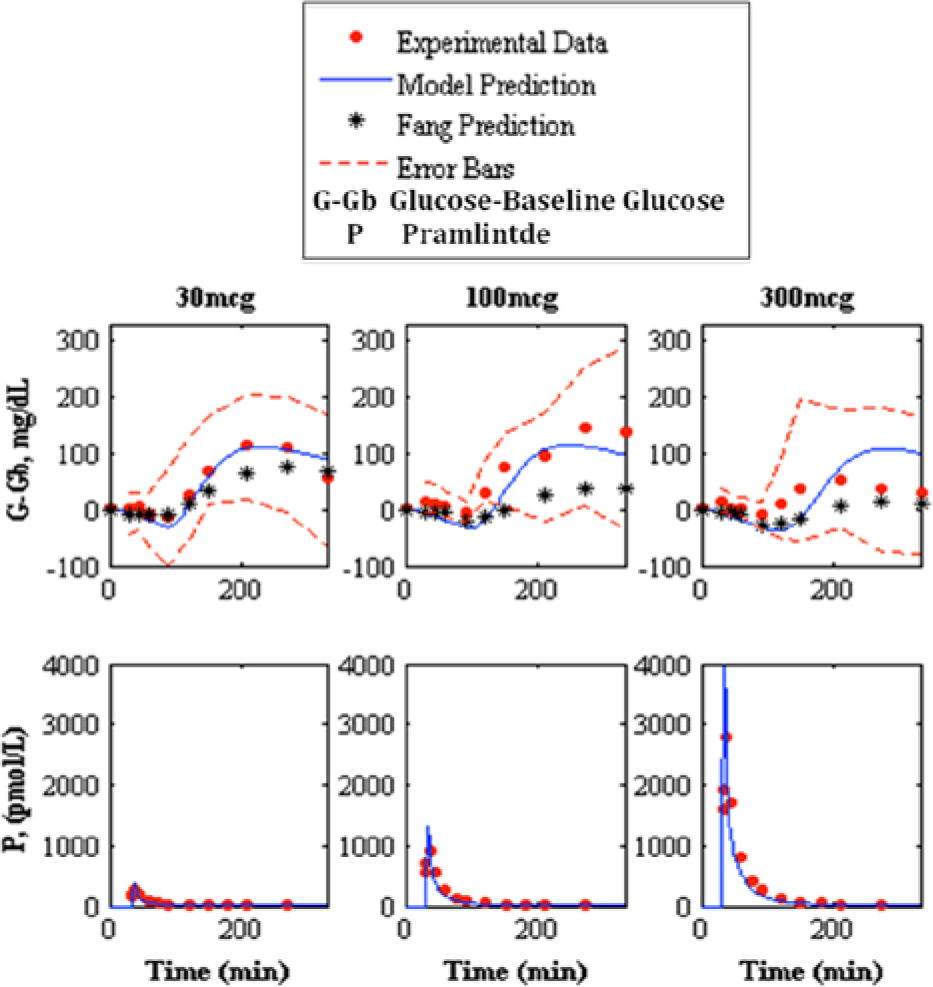
Prediction of pramlintide pharmacodynamics and intravenous pharmacokinetics to experimental data. 13 The top shows the pharmacodynamics predictions and the bottom shows pharmacokinetic predictions of 30, 100, and 300 mcg pramlintide doses, left, middle, and right, respectively. Model prediction is represented by the solid line, experimental data points are represented by the dotted line, Fang et al’s predicted pharmacodynamics are represented by the line with asterisks, and the standard deviation of the experimental data is represented by the dashed line.
Intravenous Pramlintide Pharmacokinetics
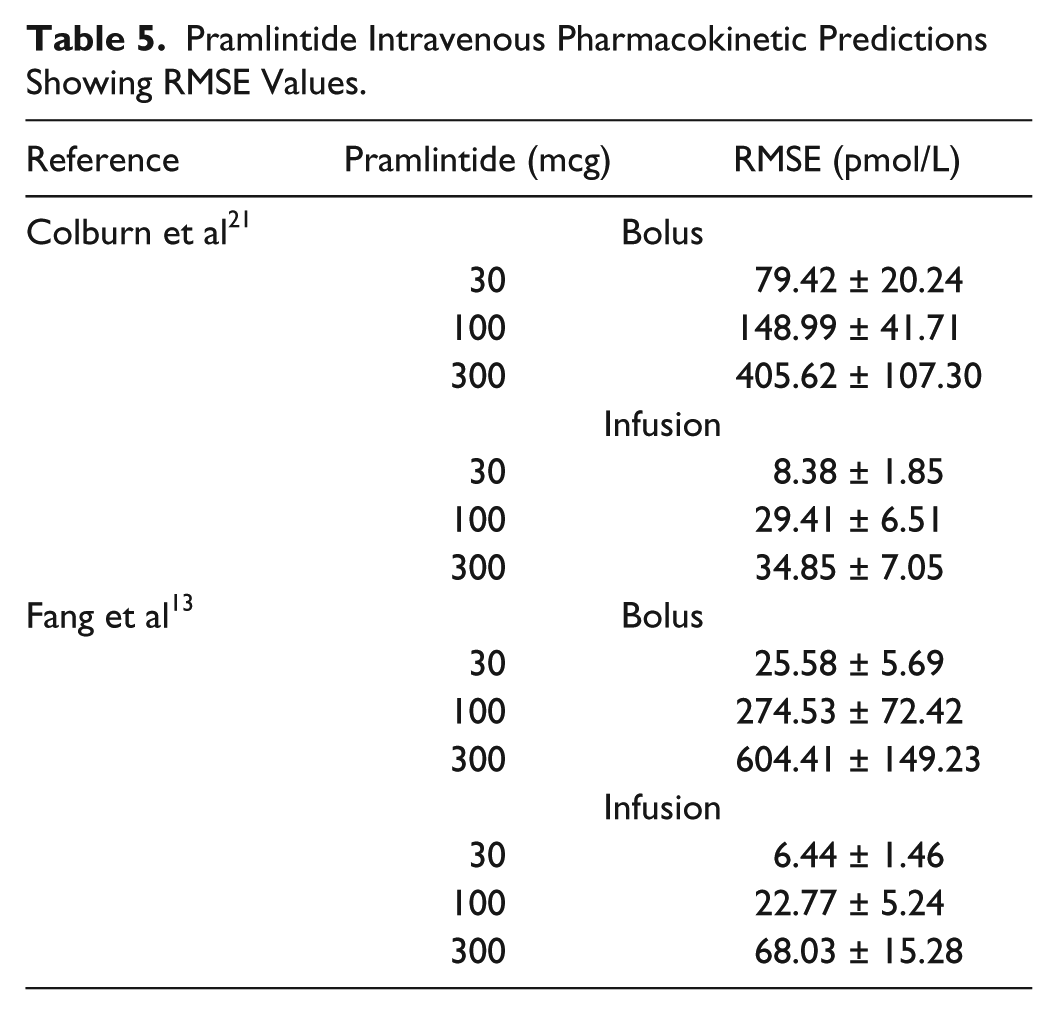
A study containing IV pramlintide PK 20 proposed a 3-compartment model to represent pramlintide kinetics. This model was added to the modified Hovorka glucose-insulin physiological model25-26 and compared to experimental data. Two independent studies13,21 contain experimental data for both a bolus and infusion (IV) of 30, 100, and 300 mcg doses of pramlintide that were compared to the IV pramlintide PK model 20 (Figures 2 and 3 and Table 5). The goodness of fit for IV pramlintide PK has RMSE values range from 6.44 to 604.41 pmol/L.
Pramlintide Intravenous Pharmacokinetic Predictions Showing RMSE Values.
Subcutaneous Pramlintide Pharmacokinetics
SC pramlintide kinetics were adapted 26 and added to IV kinetics. 20 Based on null parameter fits the model was reduced from a 6-compartment model to a 4-compartment model (Figure 1). Data from Kong et al 23 were used to fit parameters (Table 2); these fits are shown in Figure 6. Fitted RMSE values range from 5.24 to 10.66 pmol/L. The fit parameters were then used as predictions 22 (Figure 7). Predicted RMSE values range from 1.98 to 10.39 pmol/L.
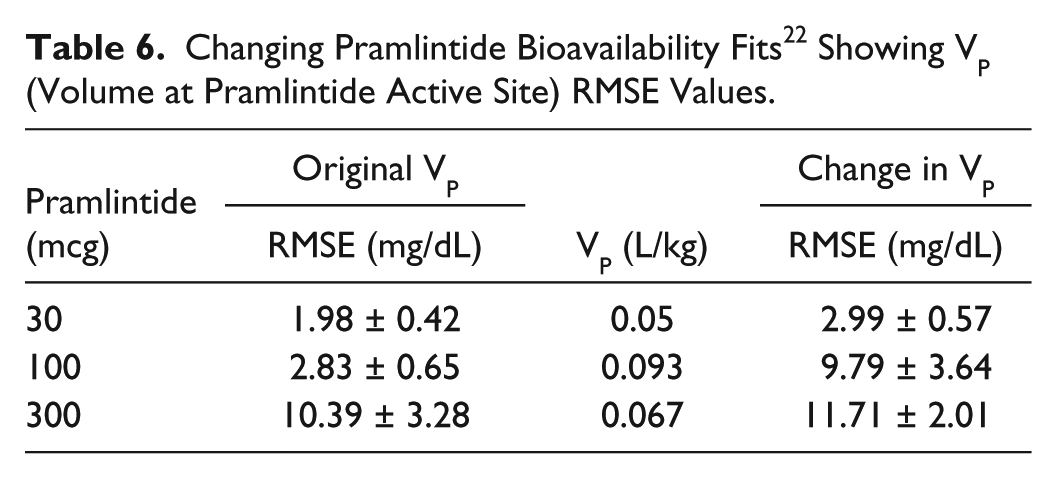
Kolterman et al 22 showed a change in kinetics after 14 days. To compensate for this change, it was hypothesized that this change occurs due to a change in volume at the active site. The value of Vp (the volume at pramlintide’s active site) was fitted 22 for kinetics at day 14 (Table 6). Fitted RMSE values range from 2.99 to 11.71 pmol/L.
Changing Pramlintide Bioavailability Fits 22 Showing VP (Volume at Pramlintide Active Site) RMSE Values.
Pramlintide Pharmacodynamics
Pramlintide PD were tested using a linear PD equation on 3 parameters:
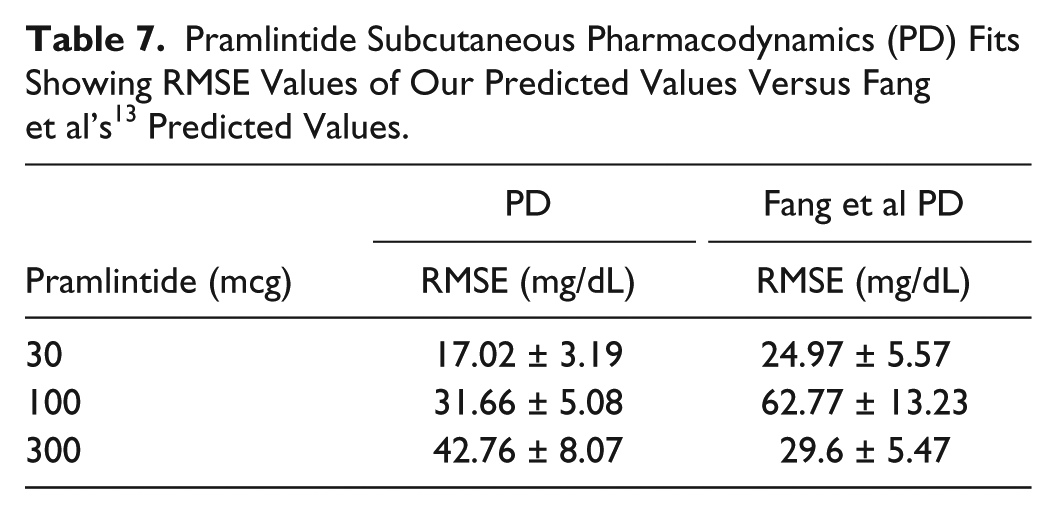
Fang et al, 13 which has its own PK/PD model for IV pramlintide, was used as a comparator for our predictions (Table 7). Our predicted RMSE values for Fang et al 13 ranged from 17.02 to 42.76 mg/dL. Fang et al’s predicted RMSE values range from 24.97 to 62.77.
Pramlintide Subcutaneous Pharmacodynamics (PD) Fits Showing RMSE Values of Our Predicted Values Versus Fang et al’s 13 Predicted Values.
Discussion
A new in silico model of the glucose-insulin-pramlintide regulatory system has been presented. The modified Hovorka glucose-insulin physiological model25-26 was rigorously tested using placebo data. This model performed remarkably; this is especially evident with Weyer et al, 7 where insulin dosages are kept as constant as possible. Inserting this information into the glucose-insulin model yielded excellent results with an RMSE value of 4.64 ± 0.97.
The first addition to the modified Hovorka model was an IV pramlintide PK found in a previous study 20 which was tested using 2 clinical studies;13,21 results are shown in Table 5 and Figures 2 and 3. Fang et al 13 and Colburn et al 21 use the same dosages of pramlintide but for varying lengths of time. Fang et al 13 used a longer infusion and bolus (2 minute push) than used in Colburn et al 21 ; plasma concentrations of pramlintide vary significantly between studies as seen in Figures 2 and 3. Interestingly, both of these studies included IV infusions of pramlintide, which yielded superior results when compared to their bolus counterparts. IV infusions have RMSE values that range from 6.44 to 68.03 pmol/L, whereas, IV boluses have RMSE values that range from 25.58 to 604.41 pmol/L.
SC pramlintide PK required only 1 SC compartment, degradation kinetics in the SC space for pramlintide were not necessary (equations 17-22 and Figure 1). An explanation for this is that pramlintide is approximately 32% smaller than insulin, and enters through the SC layer more rapidly. Parameters were fitted using data sets from Kong et al. 23 A step response of both the IV and SC pramlintide PK indicated a time lag of approximately 55 minutes in the SC system. Results are shown in Tables 3 and 4 and Figures 6 and 7.
Kolterman et al 22 showed variability in PK of pramlintide after 14 days of use and suggested that the bioavailability varied from dose to dose and acted independently over time. Investigation showed that by changing the volume at pramlintide’s active site (Vp) predictions improved considerably. One possible explanation to this is that the volume at the active site is changing over time based on multiple parameters such as cardiac output, fluid loading, and cell permeability. Results are shown in Table 6. Altered kinetics are used in Kolterman et al 22 and directly affect PD (Figure 7 and Table 4).
Pramlintide has 3 mechanisms: (1) modulates appetite, (2) suppresses glucagon secretion, and (3) slows the rate at which nutrients are delivered from the stomach to the small intestine for absorption.10,11 The first mechanism was disregarded because it is related to the amount of food consumed, not to the dynamics after ingestion. The second mechanism is pramlintide’s action on EGP in which glucagon secretion is suppressed causing lowered EGP. For this mechanism we chose to focus on parameters EGP and kg (see Figure 1). Where EGP is endogenous, glucose production and kg is the transfer rate constant from the nonaccessible to the accessible compartment. The third mechanism we focused on the parameter tmax,G, which is the peak time of glucose absorption along with an added meal delay,
When a linear effect of pramlintide on EGP and kG was tested, the resulting fit wasn’t adequate (results not shown). A possible reason why these parameters didn’t give us desired results is because the hyperglucagonemia experienced postprandially in T1DM is not captured by this model explicitly.25,26
A strict meal delay,
The parameter, Pmin represents the minimum pramlintide concentration to impose an effect of plasma glucose, which was postulated by Kong et al 23 to be 10 pmol/L. However, when testing pramlintide dosage of 10 mcg presented in Thompson et al 17 (in which the lowest pramlintide plasma concentration is ~4.3 pmol/L) a pramlintide effect on plasma glucose occurs. Pmin was thus assumed to be a value below 10 pmol/L. However, it must be higher than the highest concentration during the second meal in Kong et al. 23 This is seen in the pramlintide dose of 100 mcg where Pmin must be at least 3 pmol/L to ensure no meal delay occurs for the second meal.
Slowing of gastric emptying is known to occur with pramlintide1,23 and was included in our model as a klag that acts on tmax,G linearly with respect to pramlintide concentration. A correction to the original meal disturbance equation 6 has to be done with changing tmax,G values as seen in equations 24 and 25. The original error can be seen in Figure 4a, the gap change is depicted in Figure 4b, and the meal correction is depicted in Figure 4c. The implemented gap correction using discretized form of equation 24 had approximately 10% inherent error using a sample time of 1 minute.
Our model also includes a pramlintide transport delay to allow the drug when administered to enter the system and reach its active site. This is demonstrated in the study Weyer et al 7 in which pramlintide is administered at t = −15, 0, 15, and 30 minutes relative to the meal. It is evident at t = 15 and 30 minutes that pramlintide does not incur a meal delay or slowing of gastric emptying until approximately 9 minutes after pramlintide administration.
Thompson et al 17 provided the stiffest challenge to our model having 3 separate meal disturbances, insulin doses and pramlintide doses occurring in 1 in silico run. For this data set the results are mixed (see Figure 8 and Table 4). Our model appears to have a more pronounced pramlintide PD than what was experienced by the patients. Also, the underlying assumption that the patients’ metabolic rate and meal uptake are identical for each meal may be incorrect. Any mismatch in the first meal will cascade to the following meals. These data seem to be at the edge of the model’s capability, and it should be noted that these data were predicted, not fitted.
The final SC PKPD model had its PD parameters fitted using the 4 data sets from Weyer et al 7 since this is the official labeling data for pramlintide used by Amylin Pharmaceuticals. All other results are predictions.13,17,22-23 Parameters were fitted to meet mean data values for each data set, while upper and lower extremes were fitted to obtain parameter sets for those patient types. All parameters fitted were clearly correlated and show clear trends (see Table 2) and should not be considered independent and normally distributed.
A runs test was done on Weyer et al 7 fitted parameters to determine randomness in residuals by looking at values determined as positive and negative numbers. 27 Runs are a series of positives or negatives. Data found to be structured are said to have autocorrelation, which suggests that the model does not have enough information to accurately describe the system. 27 Pramlintide (60 mcg) at t = −15 min of the Weyer et al 7 data set was found to have autocorrelation. A possible reason is because this particular data set did not include its first point at t = −15 min because it was not shown in the graph found in the original article; see Figure 1b in Weyer et al, 7 where the x label of time starts at 0. Therefore, starting point for pramlintide at t = −15 min was unknown and baseline glucose was inferred. This is also reflected in Table 3 where the RMSE values are significantly higher than the other data sets found in Weyer et al. 7 The other data sets inclusive of t = 0 min, t = 15 min and t = 30 min showed randomness of residuals which indicates that the model includes sufficient information to capture the system. Some autocorrelation should be expected because there are effects due to glucagon that are not covered in our model. The runs test is very subjective with limited data and should not be done with less than 10 data points, 27 Weyer et al 7 contains 10 data points.
The remaining 20 PKPD data sets13,17,22-23 were used to validate the model, and covered a wide range of experimental conditions. The dosages of pramlintide varied from 10 micrograms to 300 micrograms. Time of pramlintide dosages varied from 30 minutes before a meal to 30 minutes after a meal was consumed. SC7,17,22-23 and IV 13 pramlintide boluses were evaluated. One study 17 included 3 meals over 24 hours and another 23 included 2 meals over 9 hours; both of these were predicted. Meals were either Sustacal17,22 or standardized.7,13,23 The best RMSE values are 17.02 ± 3.19 and the worst RMSE values are 42.76 ± 8.07.
Fang et al 13 previously provided the most detailed PKPD model for pramlintide except was limited to IV infusions and boluses. The objective was to compare our developed SC PKPD model, which can be used for IV and SC infusions/boluses of pramlintide to theirs. 13 Results are in Table 7 and Figure 9 show clearly that our model does better in the 30 and 100 mcg doses, and only is poorer at the very high concentration for T1DM of 300 mcg. Both models have a fixed nondosage dependent time delay (Fang et al 13 is 85.9 versus 34 minutes in our model, but we also have a transport delay to an effective compartment of 9 minutes). Kong et al 23 experimentally tested gastric emptying using radioactive isotopes and found time lags of 54.4, 56.4, to 70.3 minutes for doses of 30 mcg, 60 mcg, and 90 mcg given, which include both the time delay and first 10% of meal emptied, which are more in line with the model presented here. Other differences in Fang et al 13 are the model for insulin and meal dynamics and inclusion of a sigmoidal PD effect on endogenous glucose uptake due to glucagon suppression. The latter is not present in our model. At 300 mcg, there may be a nonlinear PD effect that occurs at higher dosages as a result of receptor saturation or some other effect. In T1DM this high dosage is not standard clinical practice.
Conclusion
This nonlinear model utilizes ordinary differential equations as a means to describe the glucose-insulin-pramlintide physiological system of a T1DM patient. The model can be used to improve initial dosing as done in Micheletto et al. 24 but also can be used to explore other dosage regimens both in timing and quantity of the drugs. In the case of combined insulin/pramlintide therapy, the meal is extended significantly allowing more feedback to take place for additional corrective bolus(es) making glycemic regulation easier to obtain. In silico testing can readily be done to optimize possible new regimens. This compartmental model has the ability to be employed into a controller to improve current control approaches used in the artificial pancreas in which the timing and quantity of drugs can be varied based on a feedback system with the ability to adapt in real time.
Footnotes
Appendix
Glossary
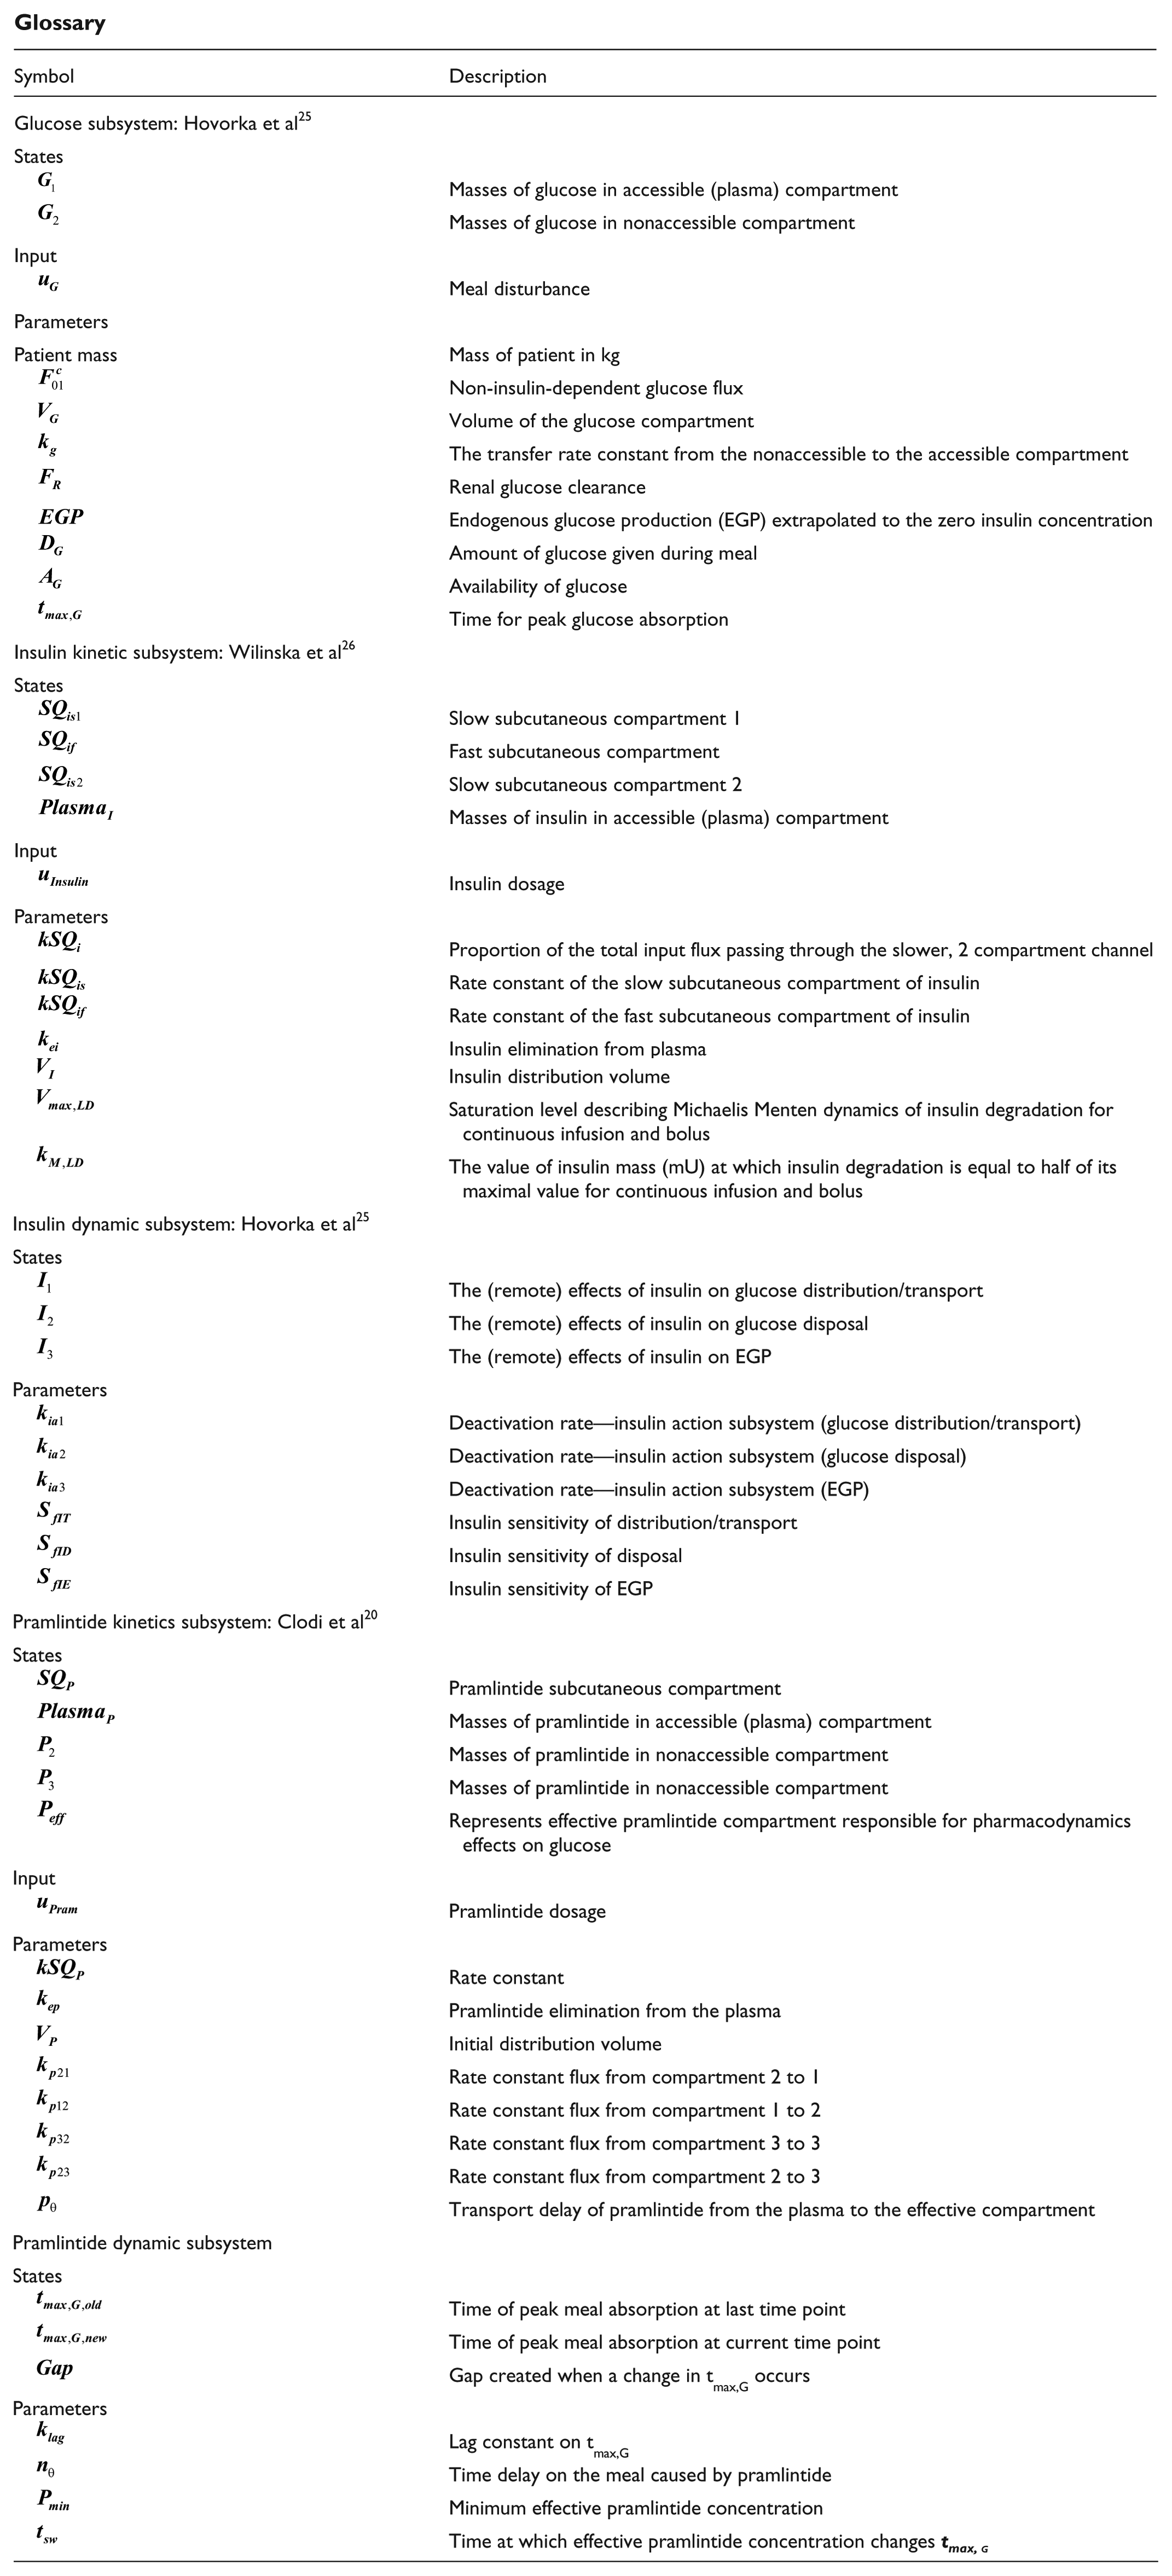
| Symbol | Description |
|---|---|
| Glucose subsystem: Hovorka et al 25 | |
| States | |
| Masses of glucose in accessible (plasma) compartment | |
| Masses of glucose in nonaccessible compartment | |
| Input | |
| Meal disturbance | |
| Parameters | |
| Patient mass | Mass of patient in kg |
| Non-insulin-dependent glucose flux | |
| Volume of the glucose compartment | |
| The transfer rate constant from the nonaccessible to the accessible compartment | |
| Renal glucose clearance | |
| Endogenous glucose production (EGP) extrapolated to the zero insulin concentration | |
| Amount of glucose given during meal | |
| Availability of glucose | |
| Time for peak glucose absorption | |
| Insulin kinetic subsystem: Wilinska et al 26 | |
| States | |
| Slow subcutaneous compartment 1 | |
| Fast subcutaneous compartment | |
| Slow subcutaneous compartment 2 | |
| Masses of insulin in accessible (plasma) compartment | |
| Input | |
| Insulin dosage | |
| Parameters | |
| Proportion of the total input flux passing through the slower, 2 compartment channel | |
| Rate constant of the slow subcutaneous compartment of insulin | |
| Rate constant of the fast subcutaneous compartment of insulin | |
| Insulin elimination from plasma | |
| Insulin distribution volume | |
| Saturation level describing Michaelis Menten dynamics of insulin degradation for continuous infusion and bolus | |
| The value of insulin mass (mU) at which insulin degradation is equal to half of its maximal value for continuous infusion and bolus | |
| Insulin dynamic subsystem: Hovorka et al 25 | |
| States | |
| The (remote) effects of insulin on glucose distribution/transport | |
| The (remote) effects of insulin on glucose disposal | |
| The (remote) effects of insulin on EGP | |
| Parameters | |
| Deactivation rate—insulin action subsystem (glucose distribution/transport) | |
| Deactivation rate—insulin action subsystem (glucose disposal) | |
| Deactivation rate—insulin action subsystem (EGP) | |
| Insulin sensitivity of distribution/transport | |
| Insulin sensitivity of disposal | |
| Insulin sensitivity of EGP | |
| Pramlintide kinetics subsystem: Clodi et al 20 | |
| States | |
| Pramlintide subcutaneous compartment | |
| Masses of pramlintide in accessible (plasma) compartment | |
| Masses of pramlintide in nonaccessible compartment | |
| Masses of pramlintide in nonaccessible compartment | |
| Represents effective pramlintide compartment responsible for pharmacodynamics effects on glucose | |
| Input | |
| Pramlintide dosage | |
| Parameters | |
| Rate constant | |
| Pramlintide elimination from the plasma | |
| Initial distribution volume | |
| Rate constant flux from compartment 2 to 1 | |
| Rate constant flux from compartment 1 to 2 | |
| Rate constant flux from compartment 3 to 3 | |
| Rate constant flux from compartment 2 to 3 | |
| Transport delay of pramlintide from the plasma to the effective compartment | |
| Pramlintide dynamic subsystem | |
| States | |
| Time of peak meal absorption at last time point | |
| Time of peak meal absorption at current time point | |
| Gap created when a change in tmax,G occurs | |
| Parameters | |
| Lag constant on tmax,G | |
| Time delay on the meal caused by pramlintide | |
| Minimum effective pramlintide concentration | |
| Time at which effective pramlintide concentration changes | |
Acknowledgements
Special thanks to Dr Fraser Cameron, Dr Natasha Ramroop Singh, and Dr Nihat Baysal for their advice and comments. Thanks to the reviewers whose contributions greatly enhanced the quality of this article.
Abbreviations
EGP, endogenous glucose production; IV, intravenous; MPC, model predictive control; PD, pharmacodynamics; PID, proportional integral derivative; PK, pharmacokinetics; RMSD, root mean square deviation; SC, subcutaneous; T1DM, type 1 diabetes mellitus.
Declaration of Conflicting Interests
The author(s) declared the following potential conflicts of interest with respect to the research, authorship, and/or publication of this article: CCP is an employee and shareholder of Medtronic, Inc.
Funding
The author(s) disclosed receipt of the following financial support for the research, authorship, and/or publication of this article: On-the-Job-Training Program, Trinidad and Tobago.