
Abstract
Background:
The size and geometry of an insulin depot that is formed during subcutaneous administration by an insulin pump is evaluated. A novel method is used to visualize accurately the depot formation for small volumes of insulin (of the order of 10–100 μl) at a given point in time. Conventional visualization methods such as magnetic resonance imaging are unable to provide such accurate measurements because of their coarse imaging resolution and long measurement time.
Methods:
The described method consists of subcutaneously infusing dyed insulin into porcine tissue and subsequently shock freezing it with liquid nitrogen. The frozen sample is then sliced into thin layers using a cryomicrotome. A digital image of each layer is taken and then processed with proprietary software, which identifies the dyed areas on each layer and reconstructs a three-dimensional model of the insulin depot with a planar resolution of 30 × 30 μm2 and a depth resolution of 100 μm. Since this process is not viable for living organisms, porcine tissue was used immediately following slaughter of the animal.
Results:
To date, it is most often assumed that the insulin depot takes the shape of a sphere around the tip of the cannula (e.g., 50 μl insulin equates to a spherical radius of 2.3 mm). However, in practice, such a depot form is never observed. Instead, the insulin depot initially spreads laterally (i.e., parallel) to the skin surface and in the collagen matrix that binds the adipose cells together. The depot outreach increases with larger infused volumes, e.g., maximum outreach measured at 5.0/5.7/7.1 mm (quartiles, n = 17) for 50 μl of infused insulin. Beyond a given infused volume (approximately 100 μl), the insulin also starts to spread perpendicular to the skin surface.
Conclusions:
It is concluded that formation of the insulin depot depends on the opening of channels at the boundaries between adipose cells. Hence the insulin follows a path of least resistance and depot formation is determined by the local structure of the subcutaneous tissue.
Keywords
Introduction
Understanding the factors that influence the formation of the insulin depot in subcutaneous tissue might provide insights into the properties of insulin absorption and the subsequent variability in pharmacokinetics and pharmacodynamics. Heinemann 1 estimated the coefficient of variability of insulin absorption to be in the range of 15 to 25% (intrapatient), whereas it was approximately 10% higher between patients (interpatient). Two main reasons are discussed for the pronounced variability of insulin absorption and consequent insulin action, namely, changes in local blood flow 2 and in insulin sensitivity. 3 Therefore, identical insulin doses, as well as circulating insulin levels, can induce a variable metabolic effect.
An improved understanding of the factors that determine insulin absorption might result in measures that allow optimizing metabolic control, for example, reducing the variability of insulin absorption. However, current knowledge about the mechanisms of insulin absorption is relatively limited. In particular, the form, shape, and dimensions of the insulin depot after insulin application are more or less unknown.
Standard methods used for observing insulin depot formation in the subcutaneous tissue are magnetic resonance imaging, diffusion tensor imaging, and labeled insulin studies. Because the spatial resolution of these methods is of the order of a millimeter, 4 they are not suitable for precisely measuring the geometry of an insulin depot, as the depot itself is relatively small. For example, a standard U-100 insulin bolus of 1–20 U (i.e., 10–200 μl) is equivalent to a spherical drop with a radius of between 1.34 and 3.63 mm. Nevertheless, observations of the insulin depot made by the aforementioned standard imaging methods suggest that the depot's form is more planar than spherical. 4
The aim of this novel approach was to quantify the three-dimensional (3D) form of the insulin depot in subcutaneous tissue with a higher resolution and insight than standard imaging techniques.
Methods
The important procedural steps of this study are summarized in
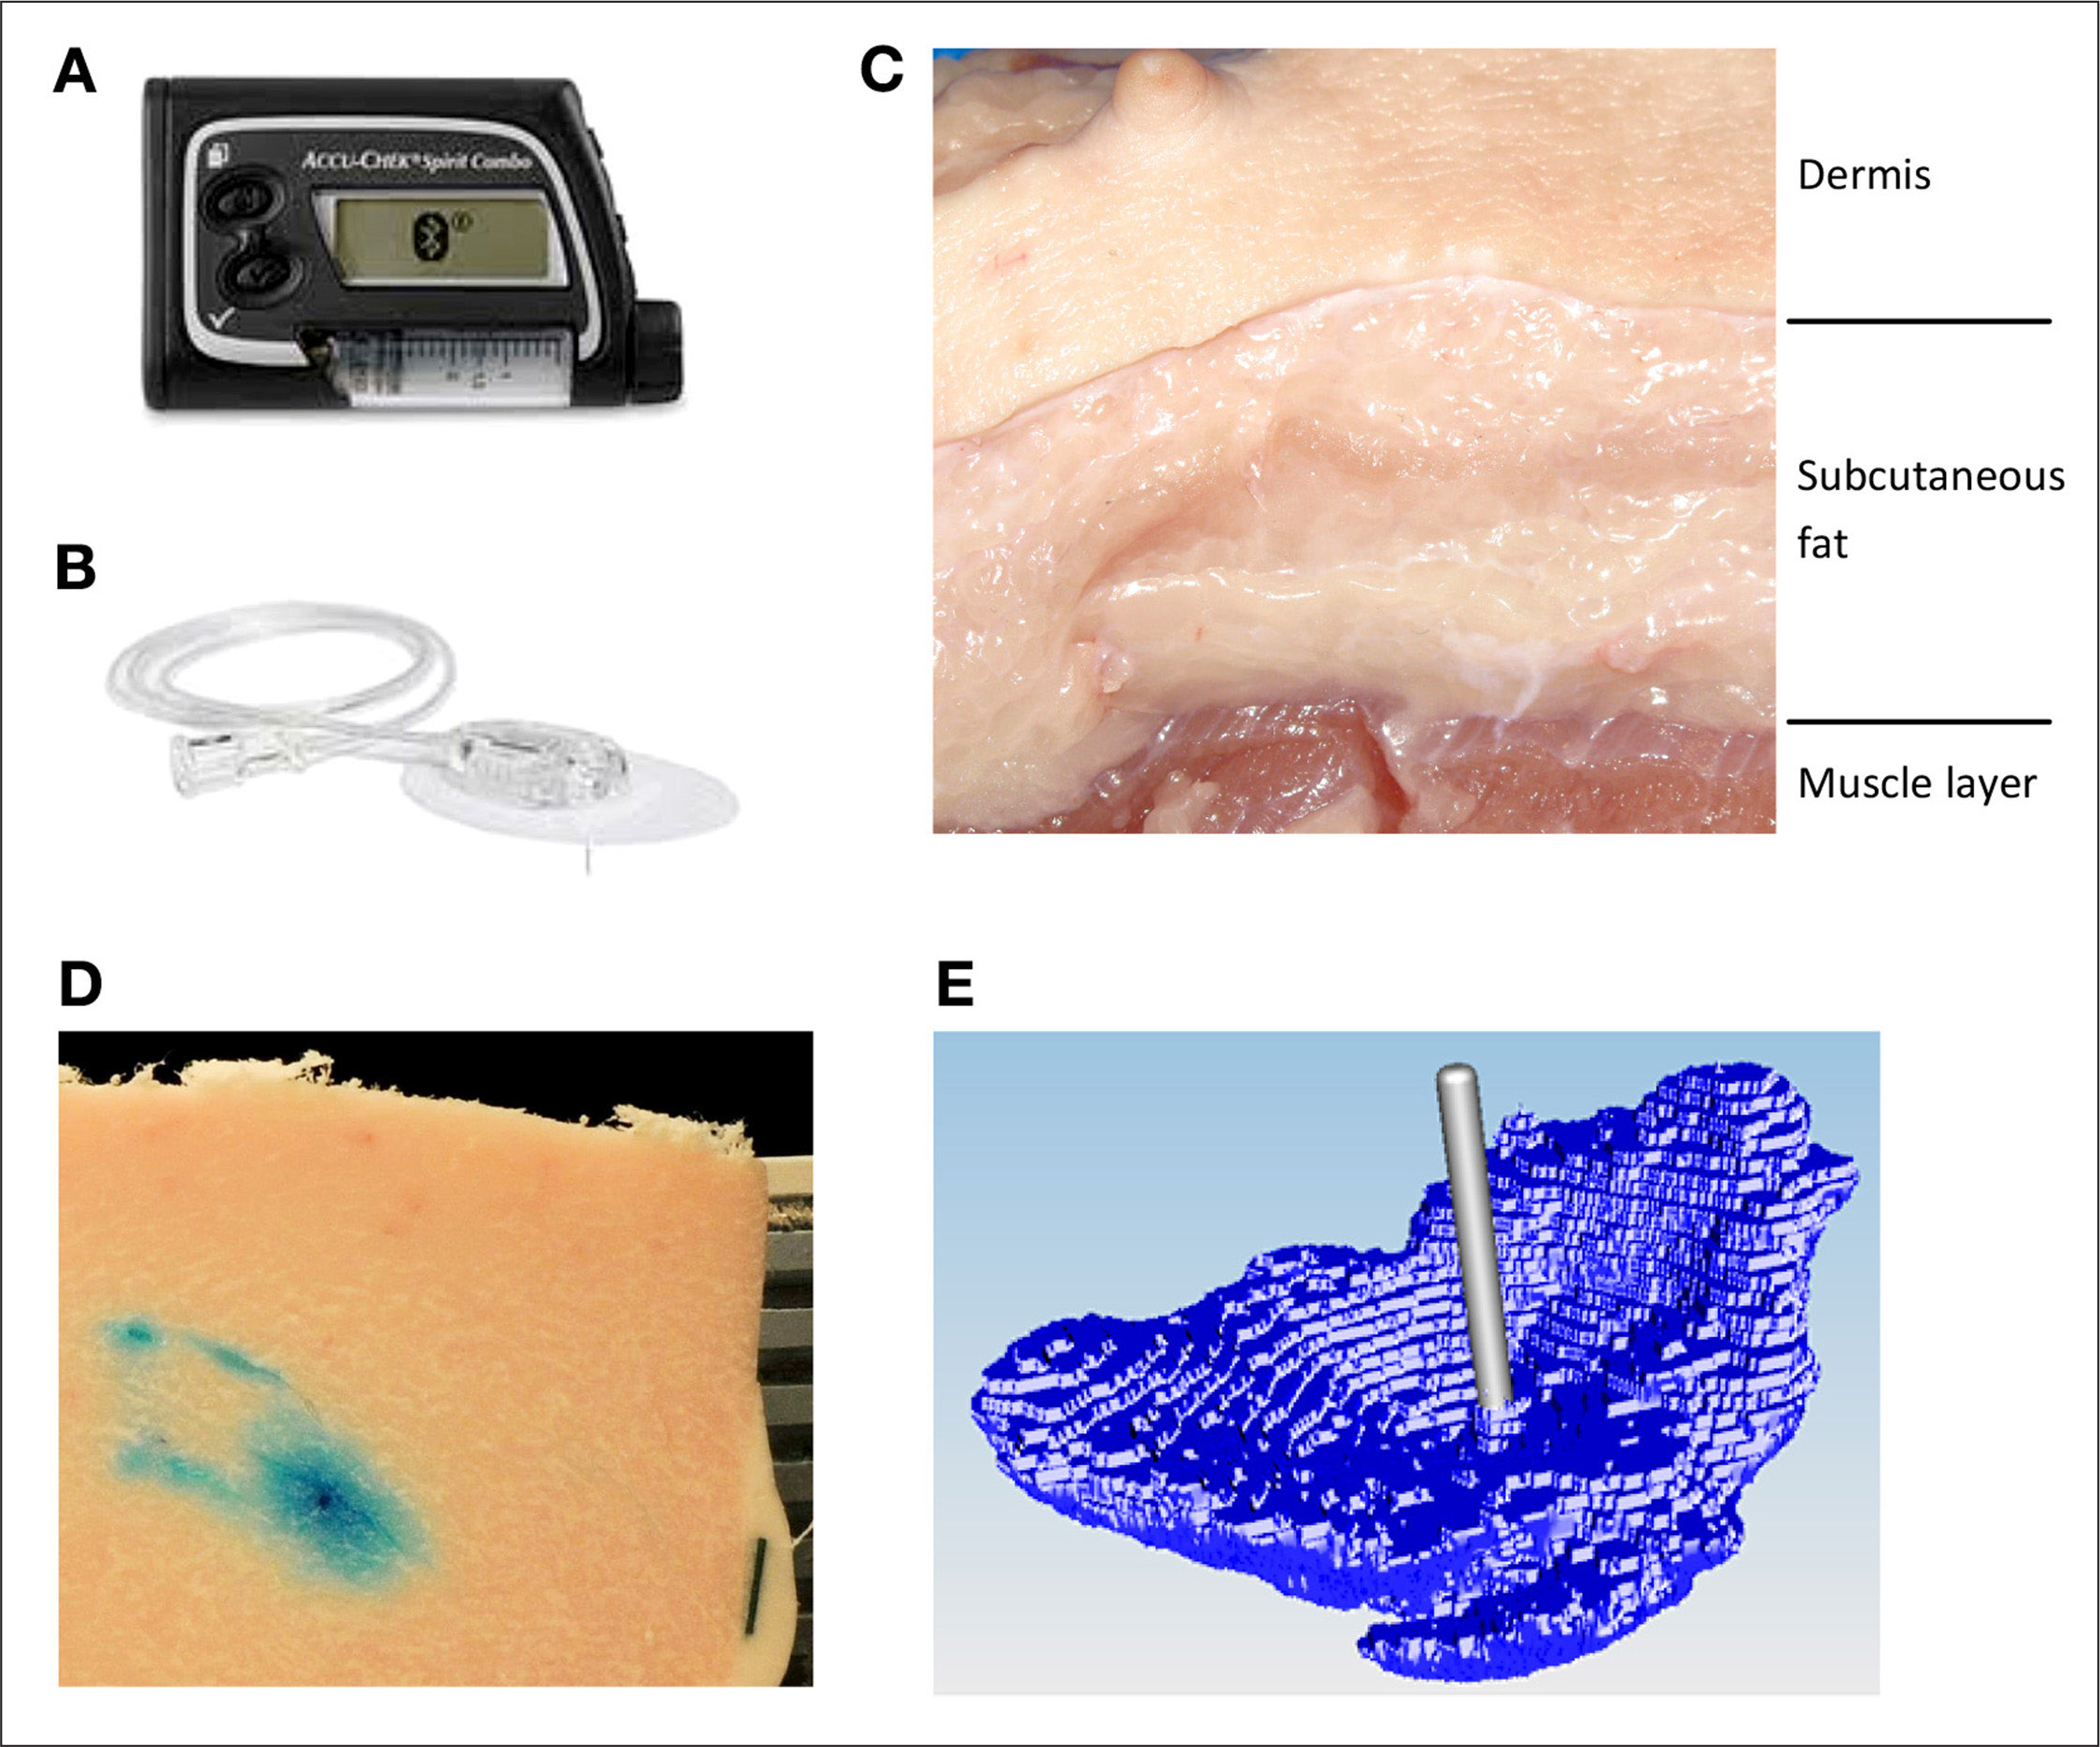
Dyed insulin infused by
The porcine tissue model used in this study has been evaluated before as a suitable model for human dermal and subcutaneous tissue;5–7 porcine tissue was obtained from a nearby abattoir from adults pigs that were not specifically slaughtered for this study. Tissue was collected from 10 pigs; the abdominal and kidney regions were selected for their high proportion of fat. Tissue slabs were removed from the pig approximately 5 min postmortem and placed in an insulated transport box filled with warm water bags to reduce cooling of the tissue. The slabs were transported to the laboratory rapidly and insulin infusion started within 15 min postmortem.
Regions of 4 × 4 cm2 were marked out on the surface of the slab (approximately 3 cm thick); typically 5–8 regions were gained from one slab. These regions were sufficiently far from the outer edges of the slab to avoid any localized tissue damage arising from the physical removal of the slab. In each region, a soft cannula infusion set (Accu-Chek FlexLink 8 mm, Roche Diabetes Care AG) was inserted. Each infusion set was connected to an Accu-Chek Combo insulin pump. A predefined insulin bolus was administered at a standard pump infusion rate of 120 μl/min−1, so for an infusion volume of 150 μl, the infusion time was 75 s. All infusions into a slab were performed in parallel using several pumps.
The insulin was mixed with standard food colorants; either a blue dye (Patent Blue V, E131) or red dye (Camine, E120) was used, depending on the subsequent image analysis technique to be performed. Adding dye to the fluid is assumed to have a minimal effect on its fluidic properties and consequently should have no significant influence on the observed insulin depot formation.
After the end of the bolus application, the whole tissue slab was frozen using liquid nitrogen (15–25 min postmortem) without removing the infusion set
Each sample was mounted on a retainer and embedded in a wax (TissueTek O.C.T. Compound, Sakura, Japan). In addition, a 5 mm wide black paper strip was also embedded in the wax to act as a reference scale for digital pictures analysis. The retainer was then placed in a cryomicrotome. First, the skin layer was cut off, and then the remaining subcutaneous tissue was serially sectioned into slices 20 thick. After every fifth slice (100 μm) the top surface of the sample was photographed (Nikon D300s digital camera with a mercury-refined telephoto lens, Nikon AF Nikkor 80–200 mm, 1:2.8) to a planar resolution of 30 × 30 μm2, and this procedure repeated until no dyed areas were observed. It was noted that the optimal cutting temperature for the upper skin layer is −4 °C, whereas the subcutaneous tissue needs to be below −20 °C. Consequently, the cutting temperature in the cryomicrotome was set to the highest temperature at which the subcutaneous tissue was still completely frozen (−22 °C).
The digital images were batch processed using custom software to automatically select the dye-stained areas for each slice and from this reconstruct the 3D distribution around the infusion site. Best results for image sequencing were achieved using blue dye.
The colored regions were selected by the software as follows. First, pixels in the images were transformed from the original red/green/blue color space into the hue/saturation/value (HSV) color space. Then pixels were selected depending on whether the HSV values lay within given target ranges, resulting in a binary selection (pixel colored or not). The HSV target ranges were determined subjectively for a random selection of images by comparing the selected region by the algorithm with the original image. These parameters were then applied to all subsequent image analysis for all other samples.
Each pixel is treated as a volumetric element (voxel) with a length and width scaled according to the reference scale in the image and a height of 100 μm. The volume distribution per slice as well as the total reconstructed volume of the sample can be determined by summing up selected voxel volumes. The software stored the reconstructed 3D model in a commonly used surface tessellation language file format. From these 3D models, a top view image, a front view image, and a side view image were generated, representative samples of which are depicted in
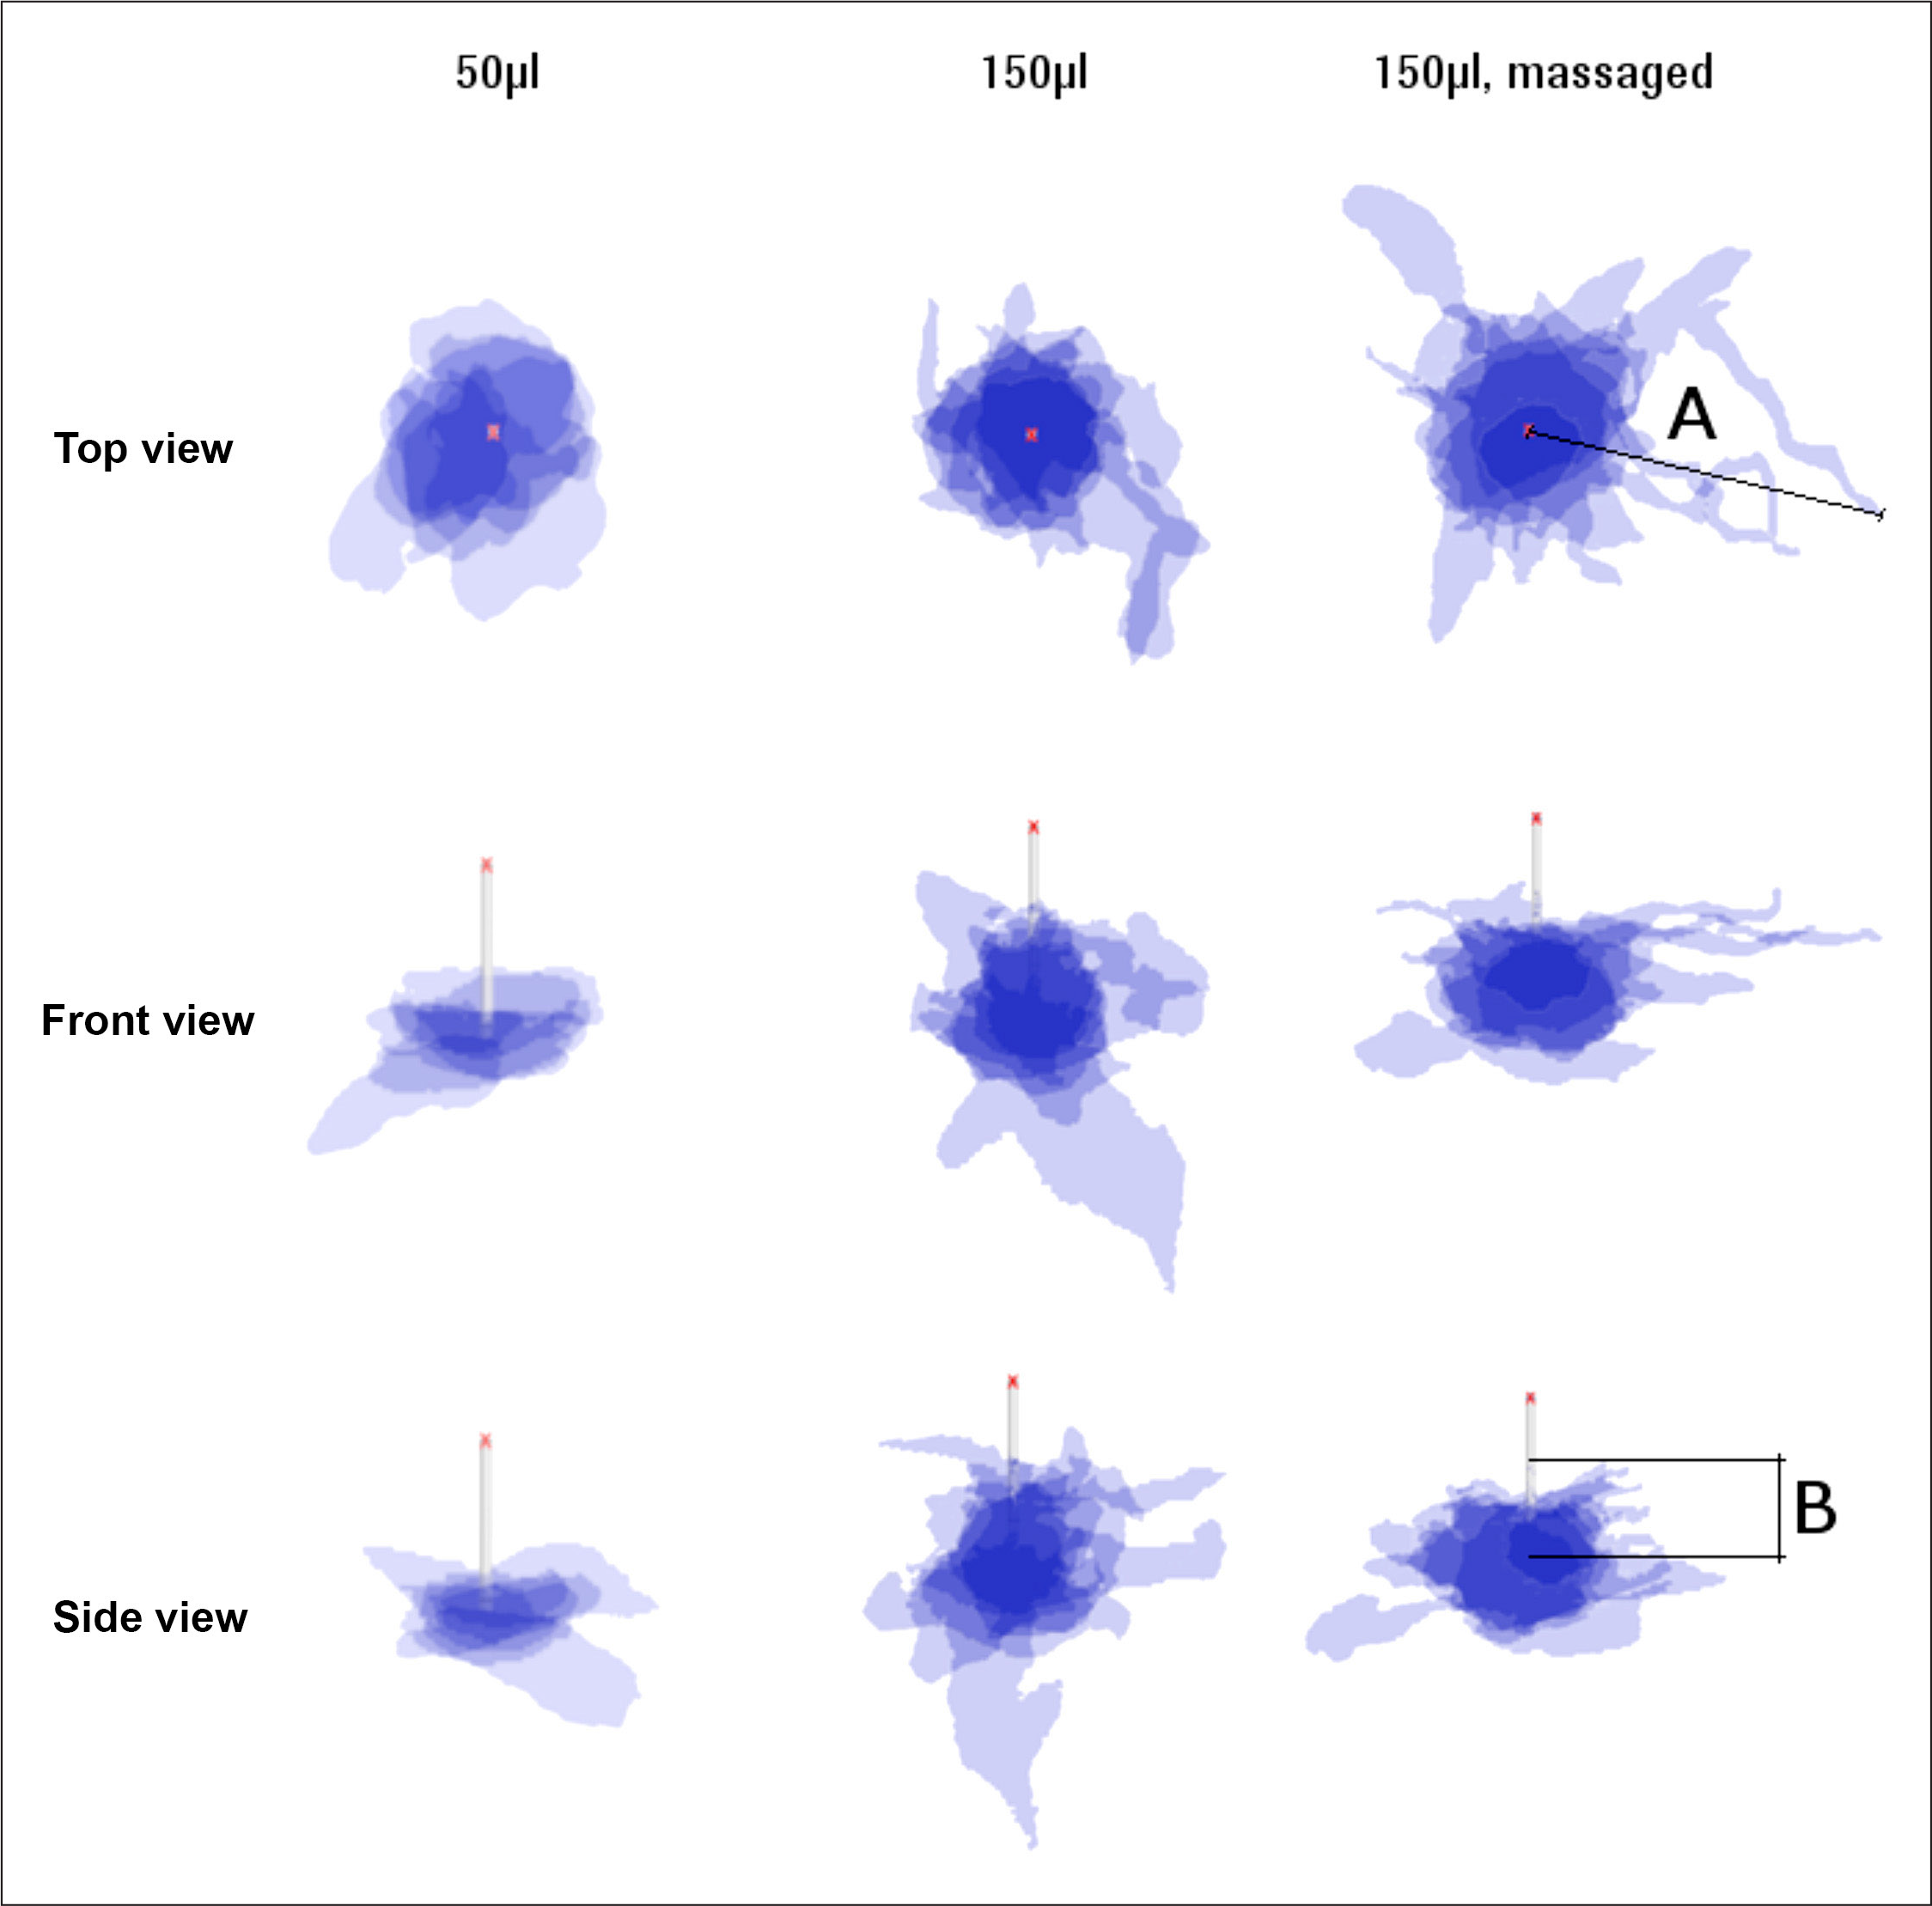
Superimposed projections of top, front, and side view of 50 and 150 μl (normal and massaged) depots (n = 6). Cannula length is 8 mm. Length A defines the maximum extension of the insulin parallel to the skin surface, length B is perpendicular to skin surface up along the needle tip.
The position of a given slice (layer) was defined as the height from the cannula tip, with a positive height moving in the direction of the dermis. Based on this reference point, the median, upper, and lower quartiles for the infused volume, at a particular height, were calculated for all tissue samples with the same infusion parameters. Similarly, the median, upper, and lower quartiles for the maximum outreach of stained liquid from the cannula were also determined.
A microscopic analysis was also performed to make a quality assessment of the freezing and cutting process. A microscope gives better resolution compared with a digital camera, and at these higher resolutions, a red dye gave visually better results than the blue dye. Different samples were prepared for microscope analysis and not used for digital image analysis.
Results
Representative sample slices from microscope analysis shown in
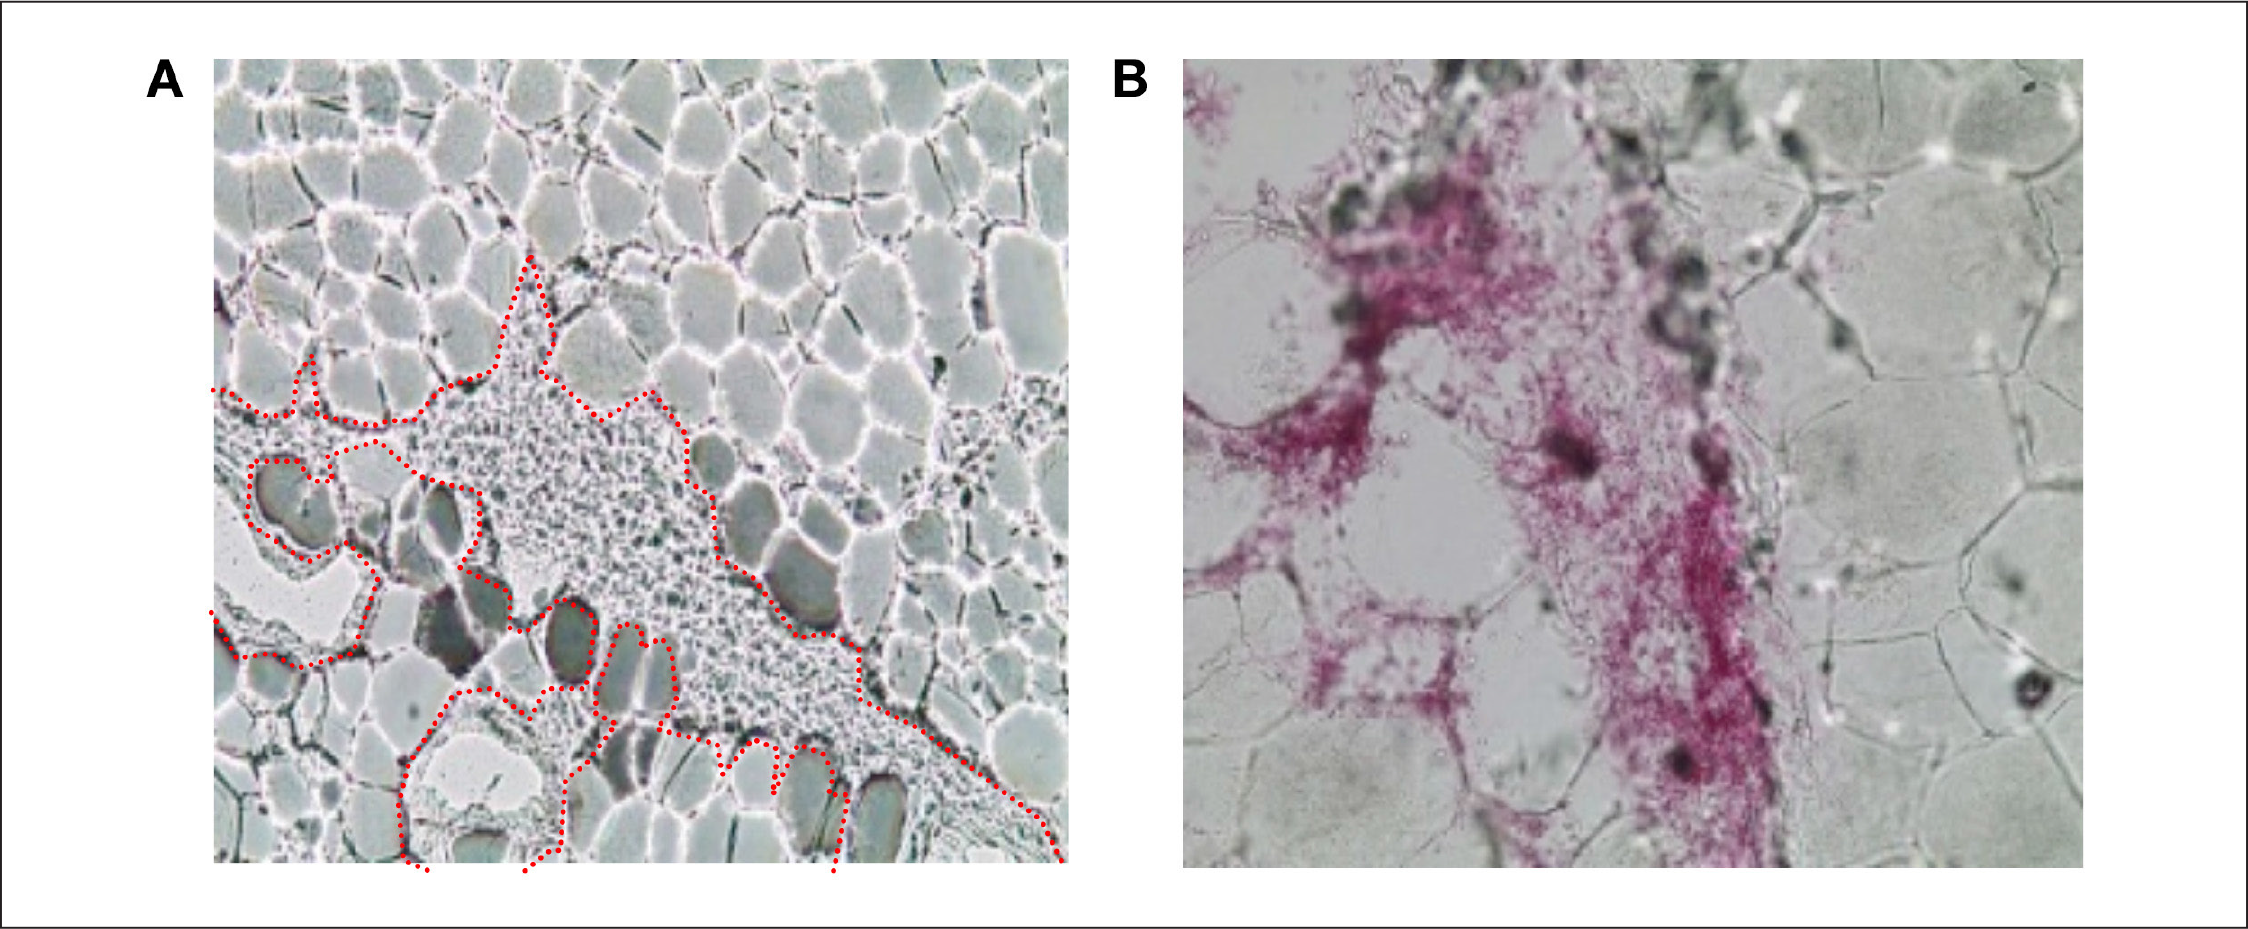
Infused dyed insulin forming channels along the boundaries of adipocyte cells (approximately 80 μm diameter).
Microscope analysis also shows that the injected dyed insulin is distributed in channels between adipocyte cells, without damaging the cells themselves. The observed depot shapes are reminiscent of branched trees growing from the tip of the cannula along the boundaries between the adipocyte cells. The channels are randomly distributed with considerable variability in observed depot shape and distribution distance. This is evident in the larger scale two-dimensional images shown in
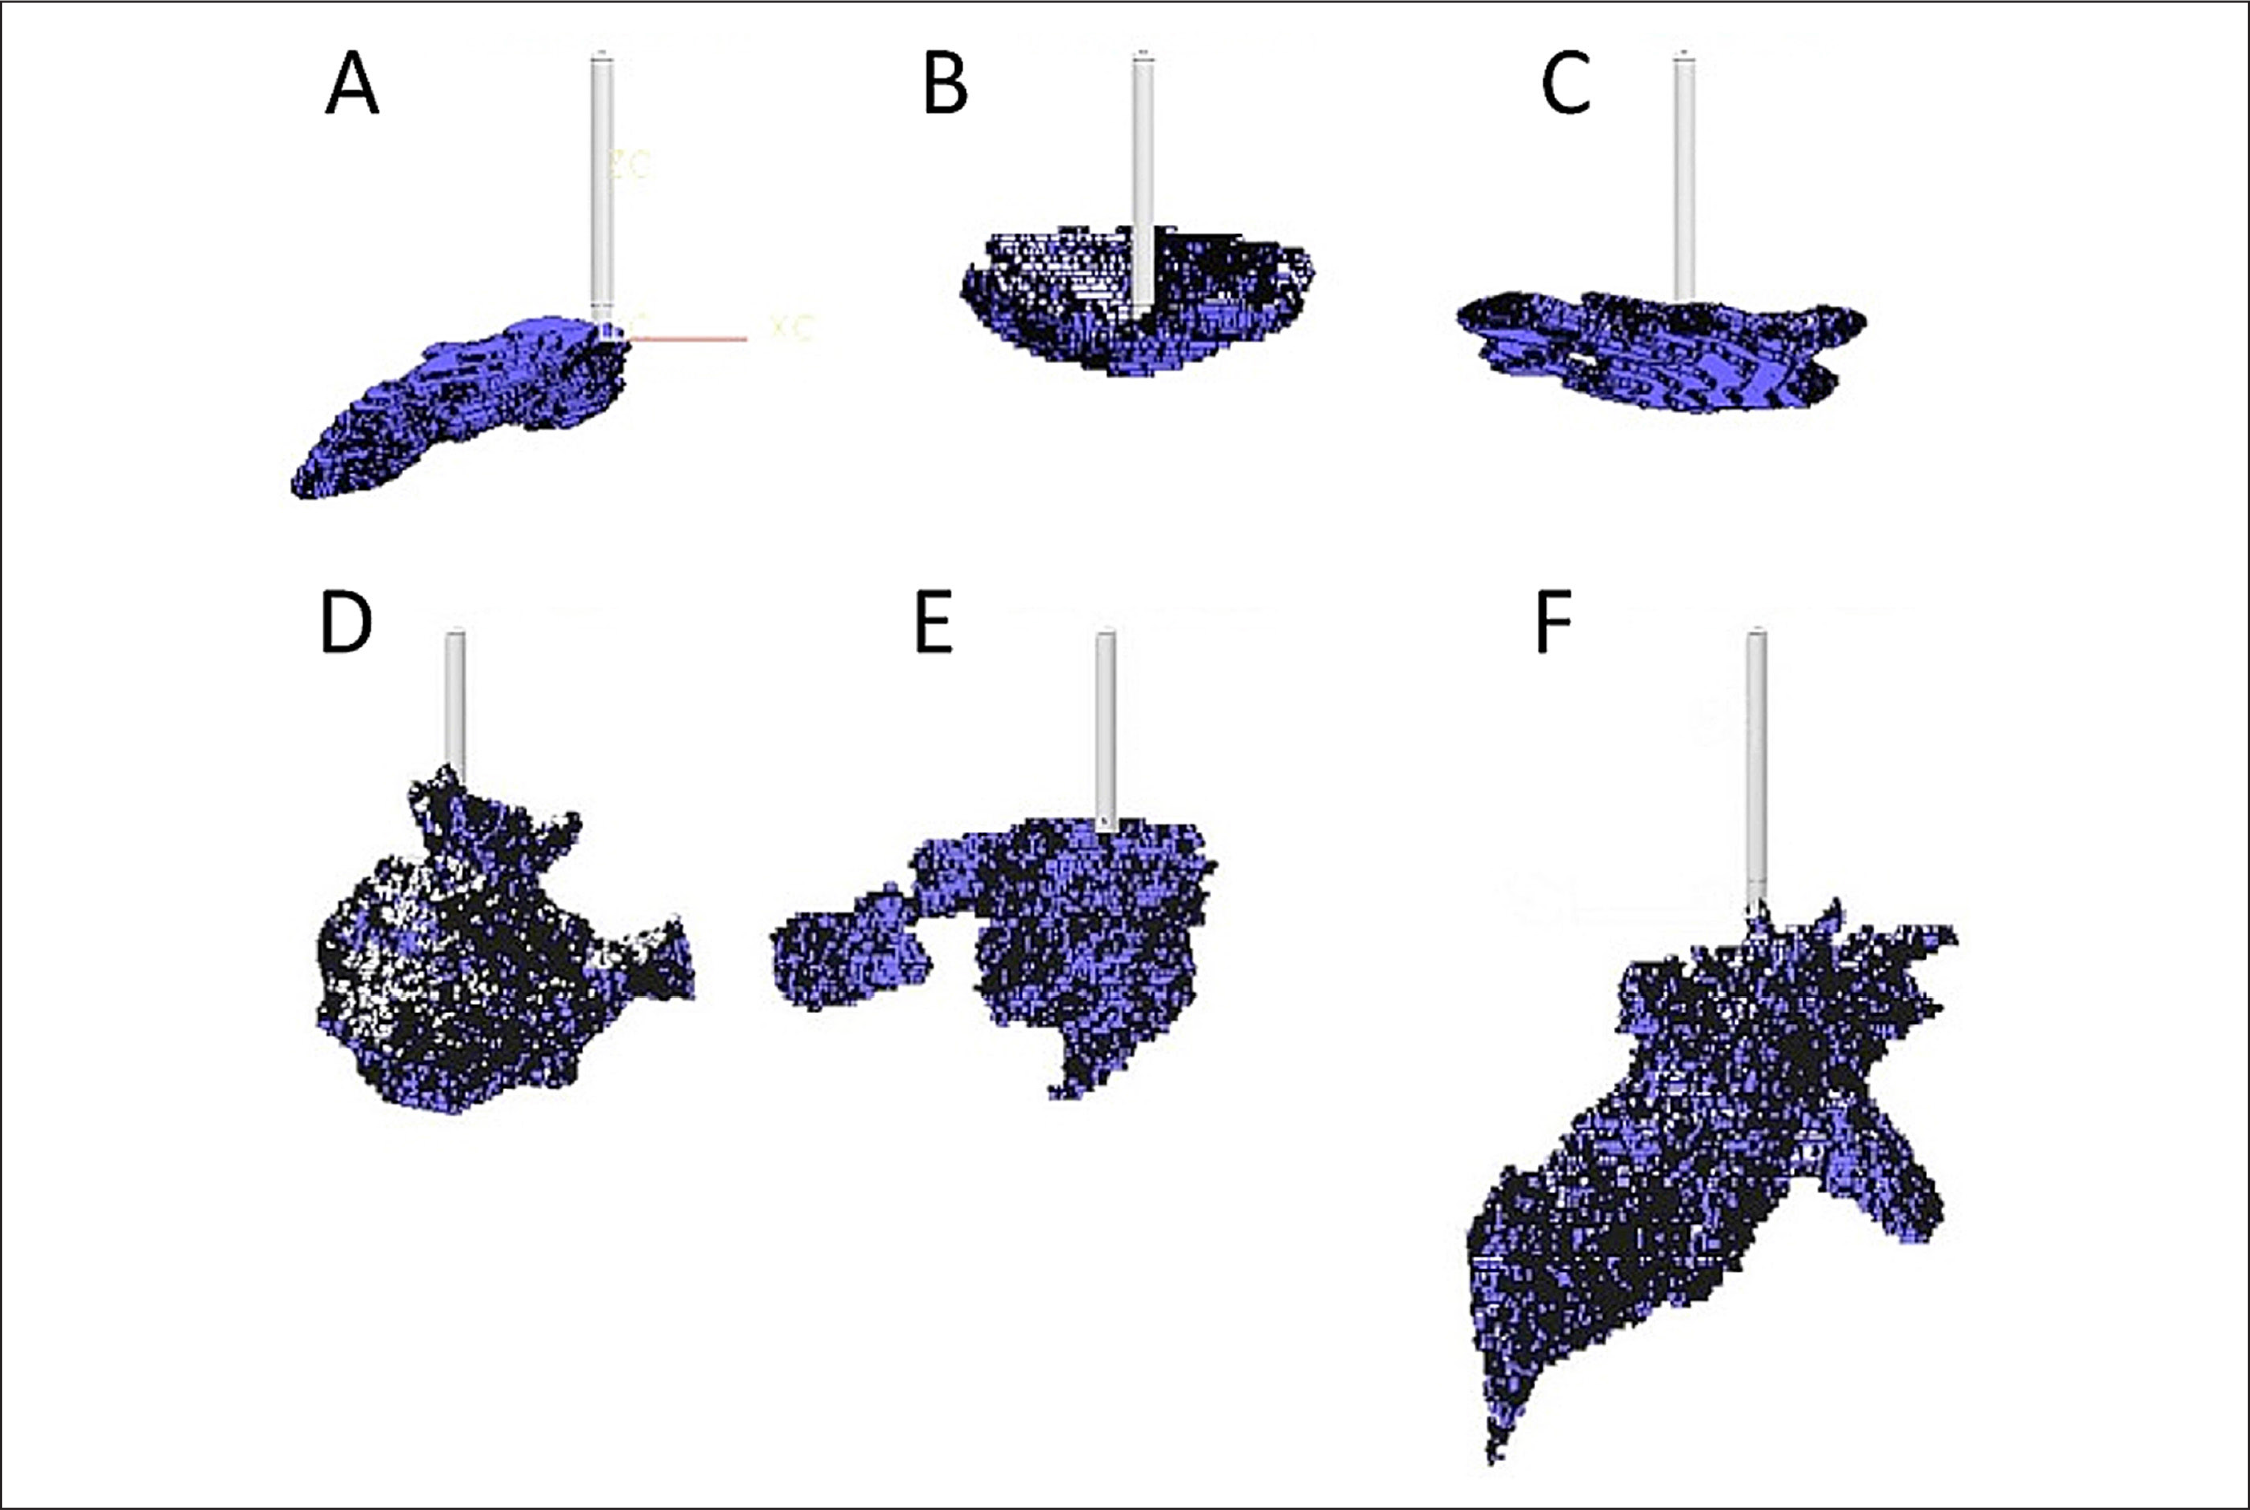
Reconstructed 3D depots of
It was observed that massaged samples showed increased variability in depot shape and outreach
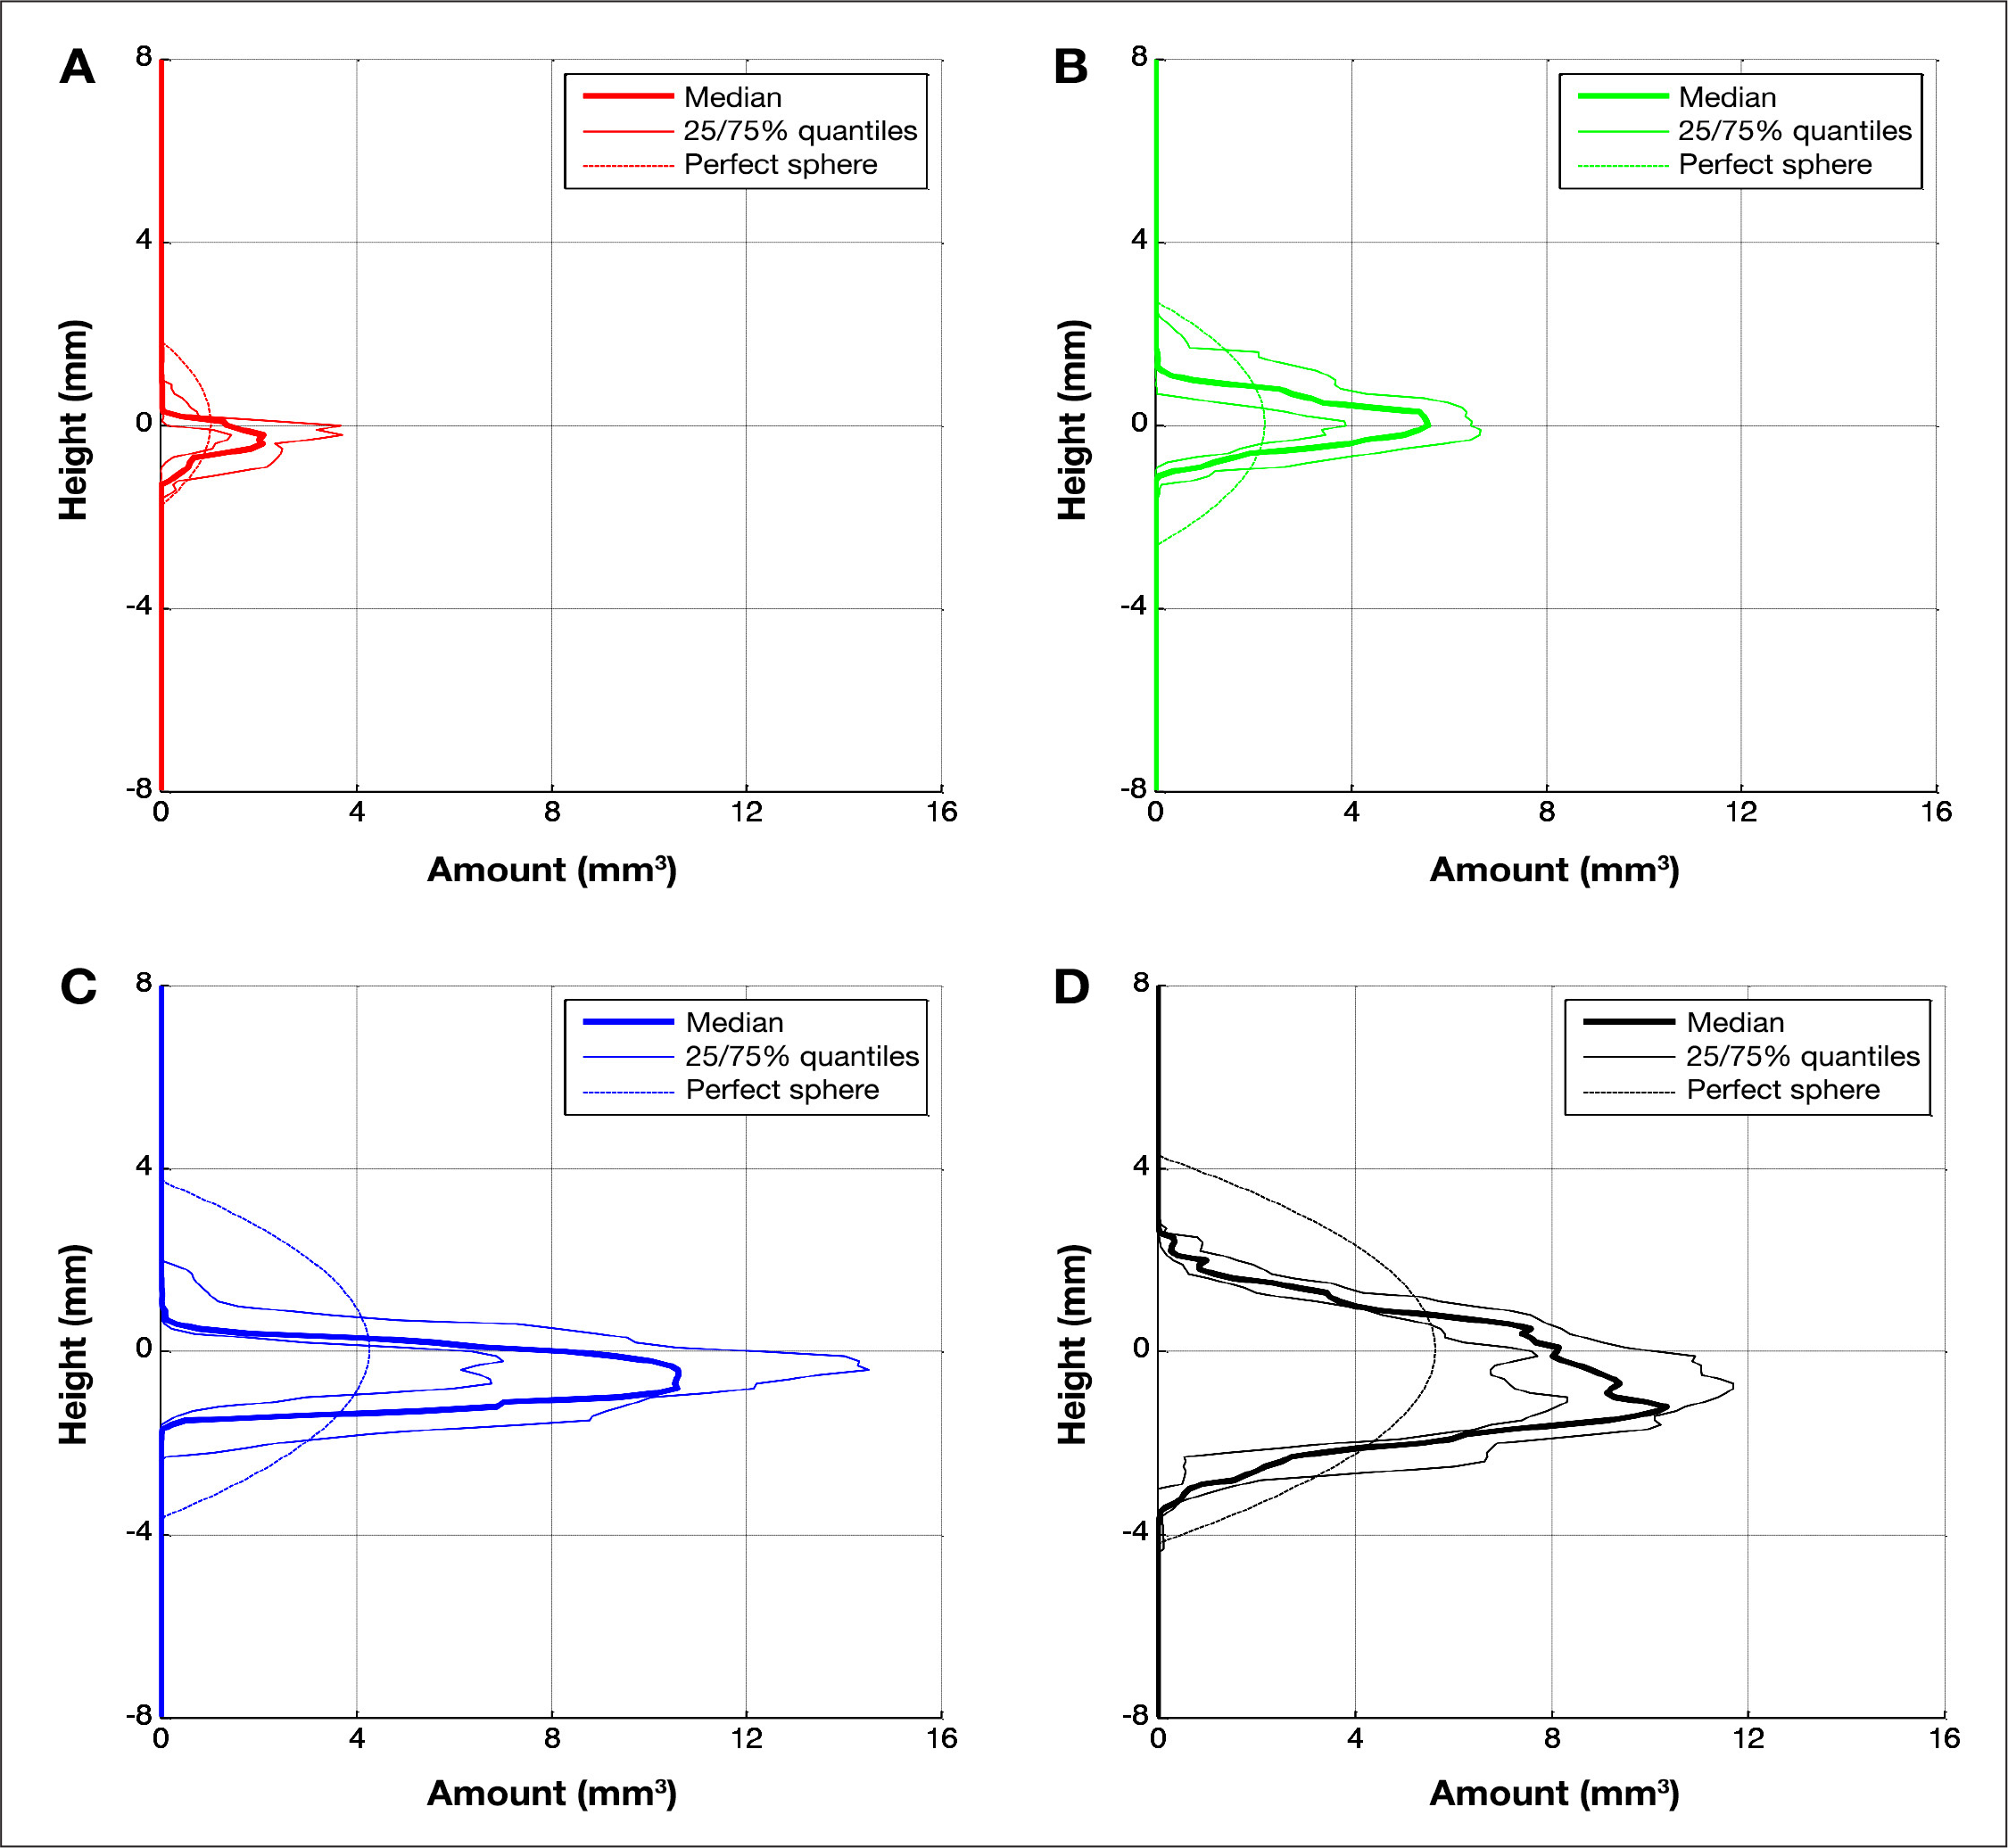
Quartiles of reconstructed amount of dyed volume per height for n samples:
The reconstructed volumes calculated follow a linear relation to the actual infused amount of insulin (coefficient of determination R
2
= 0.87; see
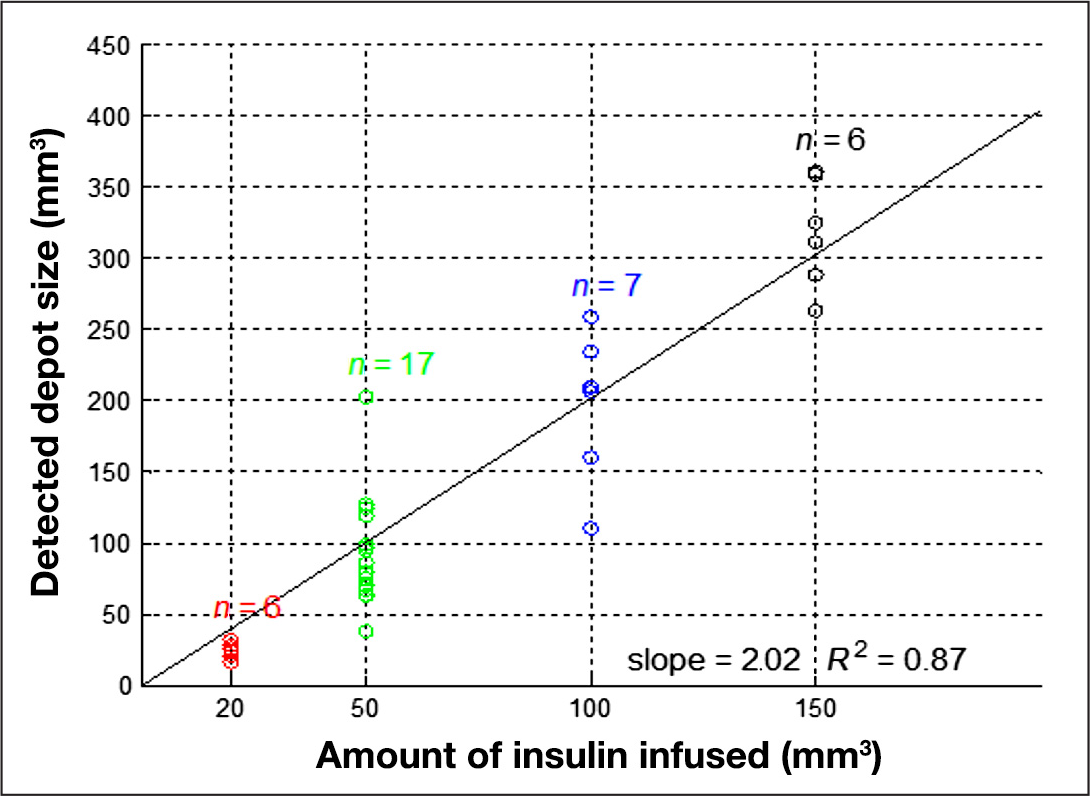
Infused volume versus reconstructed volume resulting with set color segmentation parameters.
Quartiles of the maximal outreach distances measured for a given height are shown in
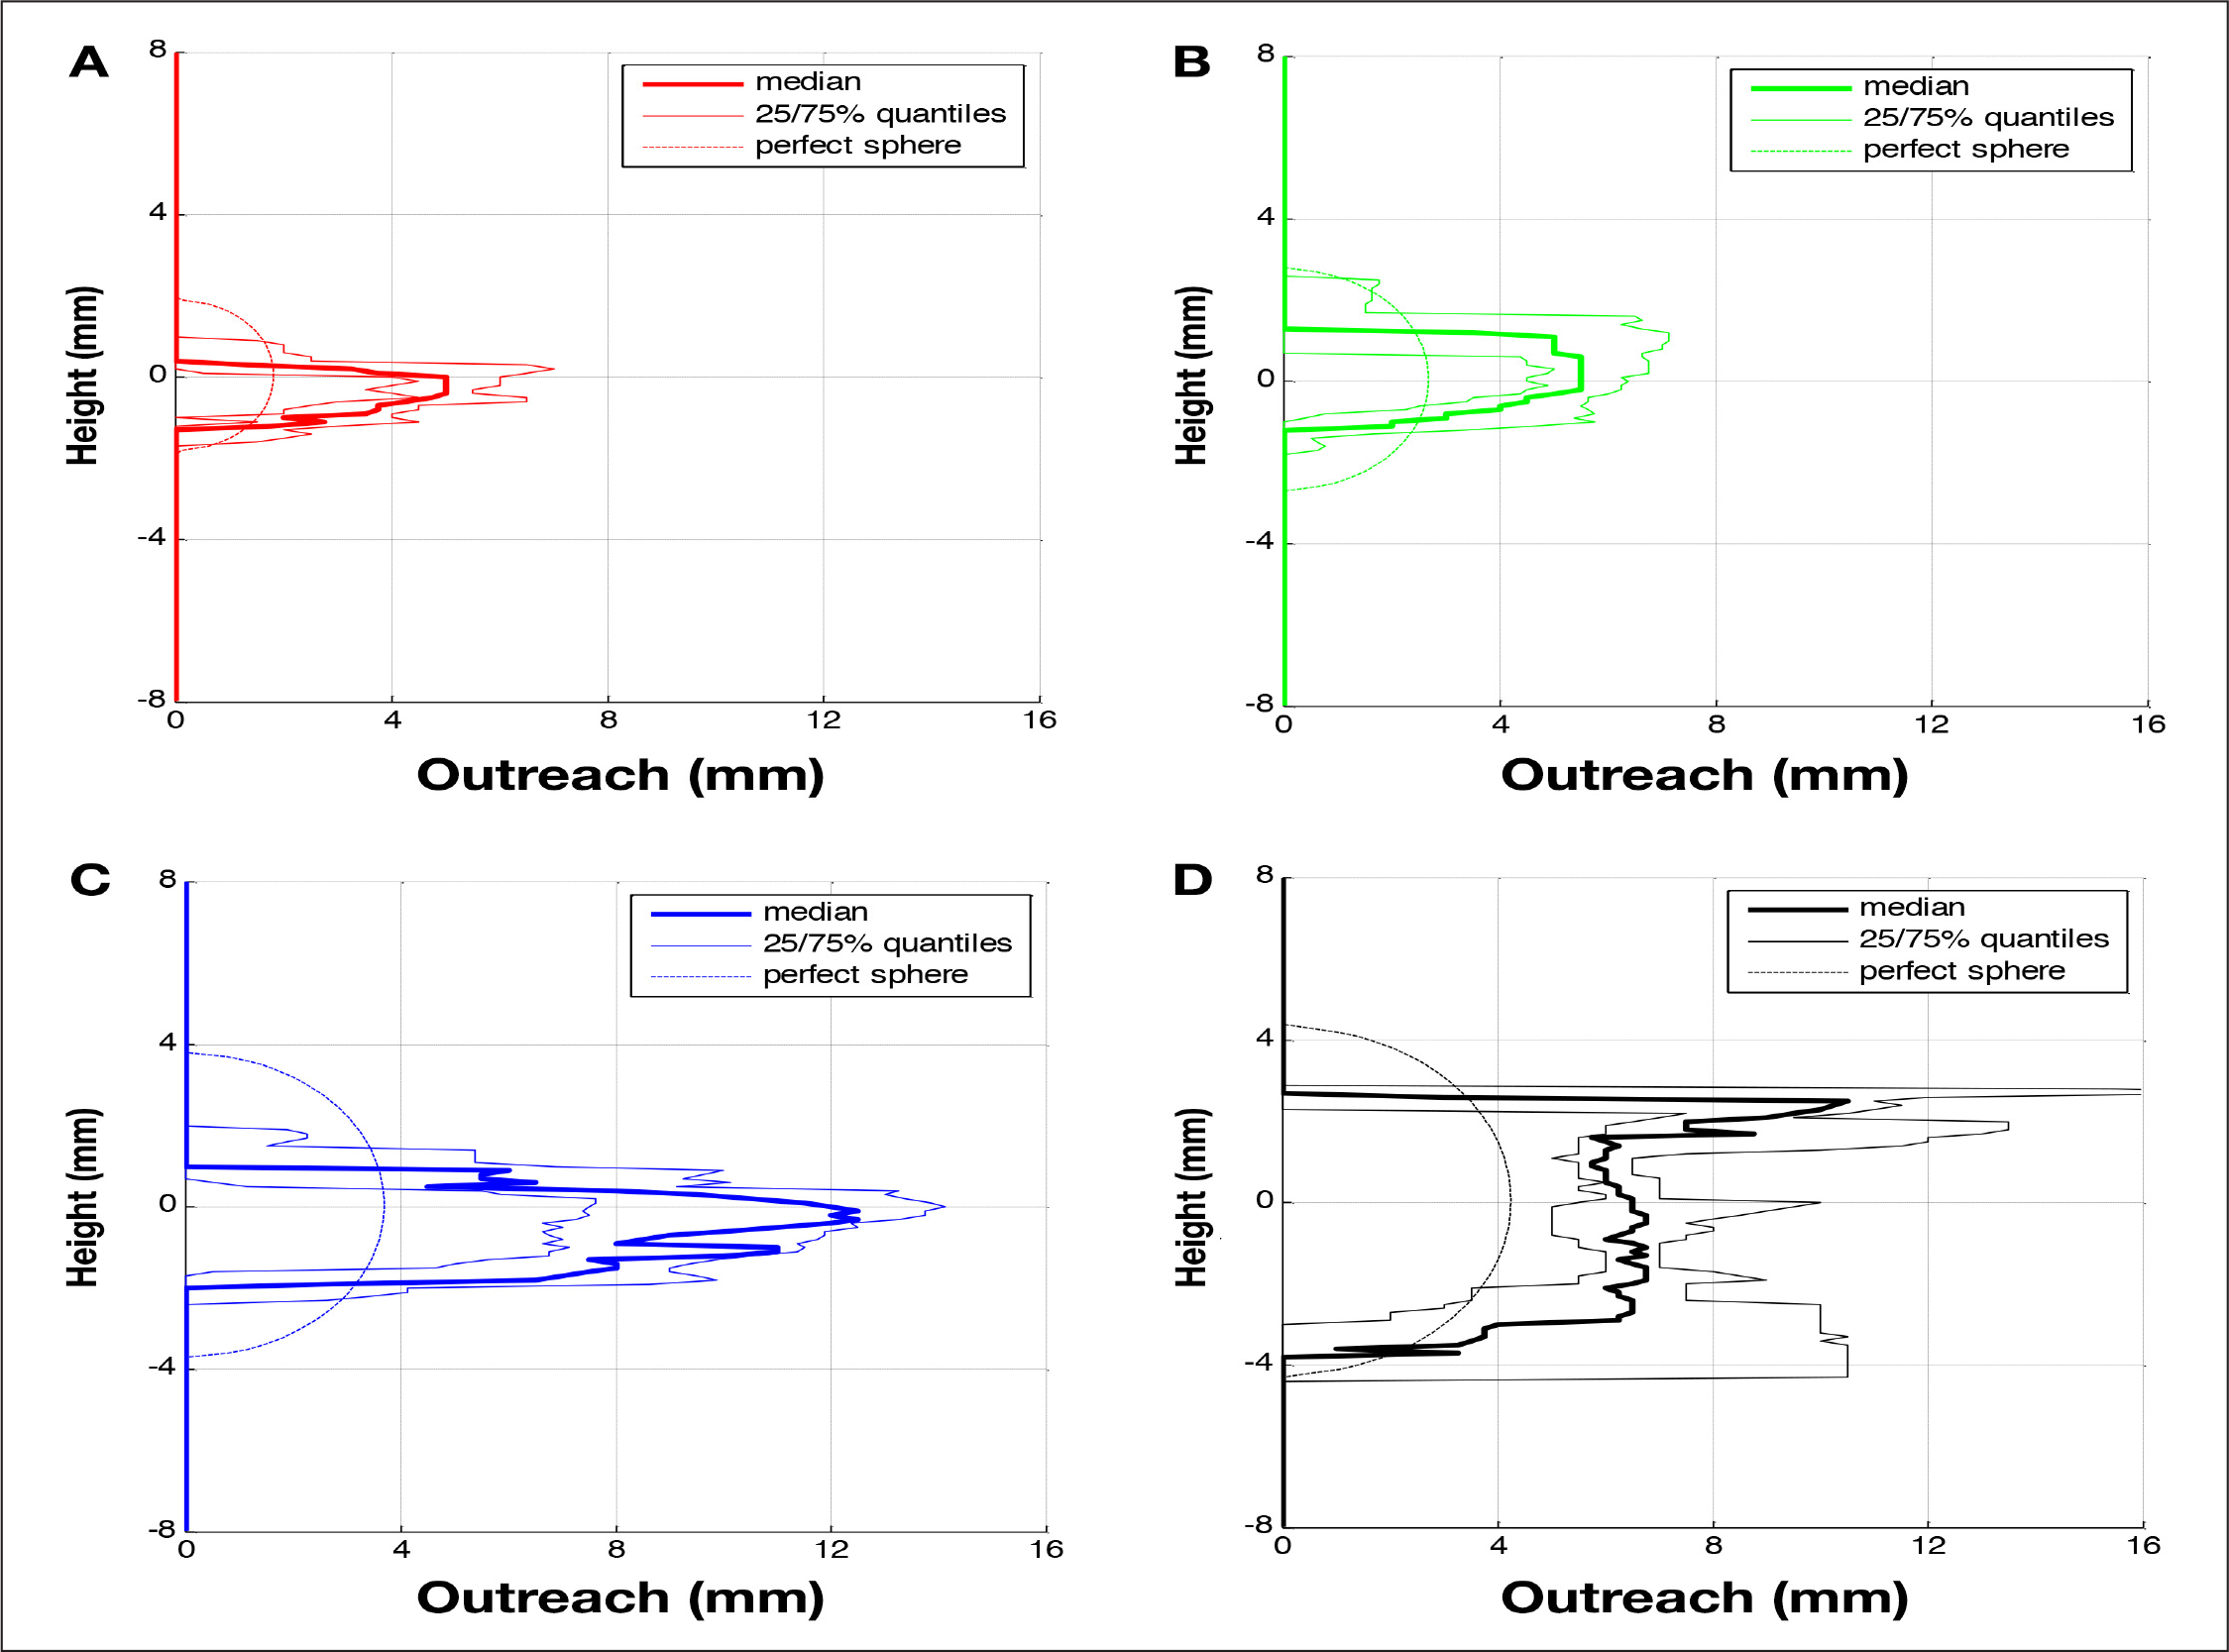
Quartiles of detected outreach of dyed area per height for n samples:
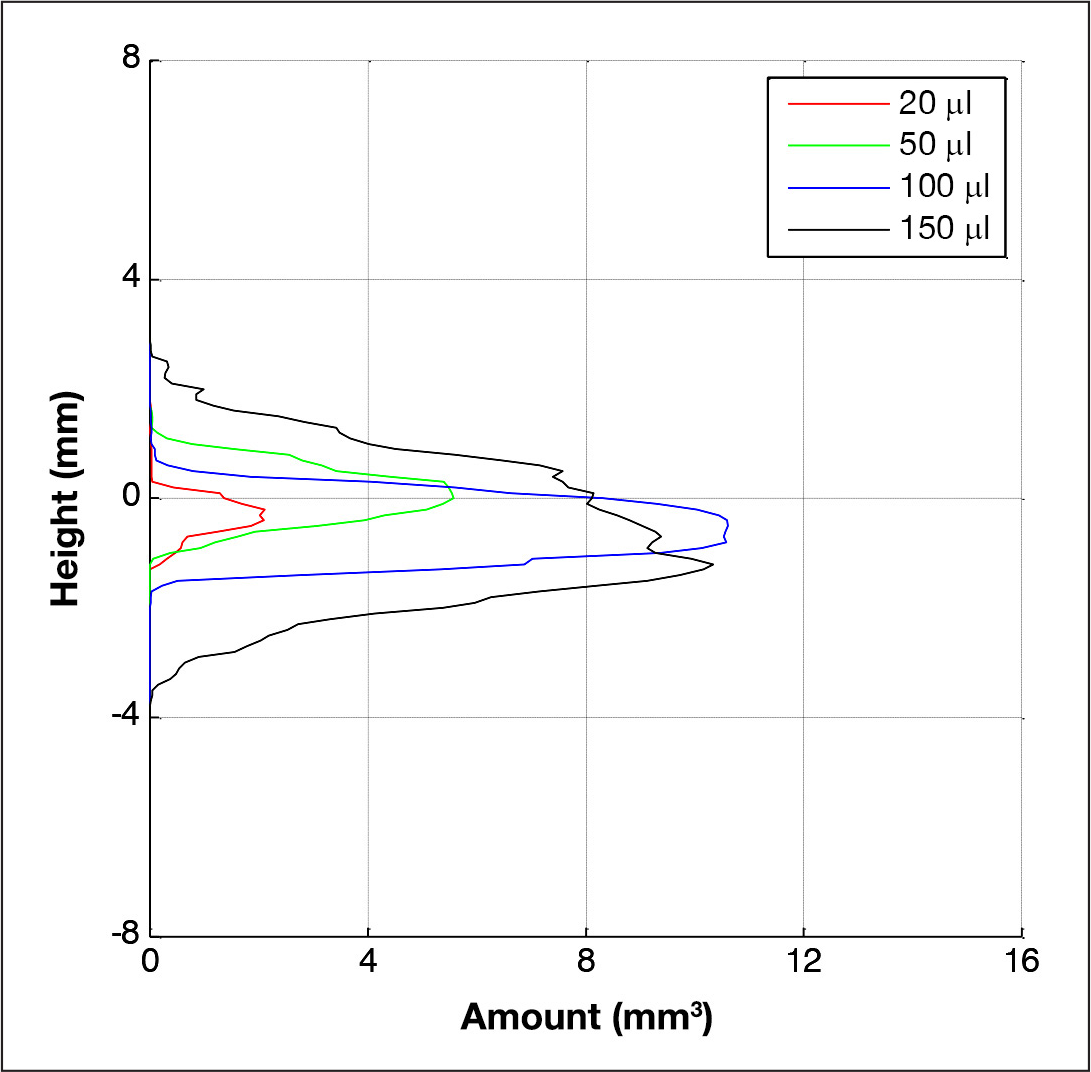
Comparison of medians for reconstructed amount of dyed volume per height for different infusion volumes.
Discussion
To the best of our knowledge, this is the first description of insulin depot formation in subcutaneous tissue following insulin infusion with such a good spatial resolution. In the surprisingly small number of studies that evaluated insulin depot behavior, nearly all of them aimed to understand absorption kinetics and/or insulin on board; depot size estimations were done with the underlying assumption that the insulin depot shape is spherical.10–12 The major finding of this study is that a spherical depot around the tip of the cannula was never observed.
The test method was designed to replicate the in vivo situation in patients with diabetes. Pig tissue was selected as a suitable model because the dermis and subcutaneous fat layers have similar structures and mechanical properties to human tissue.5,13–15 For example, the adipocyte cell diameter in porcine subcutaneous tissue (approximately 80 μm) 16 is similar to the diameter of that in human subcutaneous tissue. 17 However, perfused human skin tissue could also be used, and this could be obtained, for example, by using sparse skin tissue from patients experiencing large weight loss following gastric bypass surgery.
The infusion started rapidly postmortem, and the shock freezing took place a short time following insulin infusion. Consequently, it can be assumed that other factors that might have an additional effect in living tissue, such as absorption and diffusion, have only a minimal impact on the observed insulin depot shape. For example, an outreach of 12 mm was observed for 150 μl infused within 90 s, whereas, by the law of inhibited diffusion (diffusion coefficient for sodium is 1.33 × 10⁻⁹ m2/s−1), the fluid would only have moved 0.25 mm within this time. Clearly, over longer timescales, these differences from dead to living tissue could be more important when assessing depot shapes.
An often discussed aspect of insulin infusion is backflow of insulin along the cannula toward the skin surface, leading to a loss of insulin and, therefore, underdosing. 18 This phenomenon only occurred in the study in the few tests when the infusion cannula was removed immediately after stopping infusion. In the standard test method, where the cannula remains implanted following infusion, infused insulin was not observed on the skin surface. Nevertheless, the distance of this backflow along the cannula was determined in the experiments where the cannula was not removed. Median and maximum values for this distance were, respectively, 0.2 and 2.8 mm for the 20 μl trials and 2.6 and 5.7 mm for the 150 μl trials. As the cannula length used was 8 mm, it is clear why no insulin was observed at the skin surface.
Comley and Fleck 19 demonstrate that porcine abdominal adipose tissue consists of adipose cells tightly bound by a collagen matrix and the intracellular space filled by a ground substance. The collagen matrix determines the mechanical strength and toughness of the tissue.5,13,19 Septa also penetrate this matrix, forming a 3D fibrous network with a length scale of approximately 1 mm between connections. The collagen matrix is not completely randomly orientated but forms in layers several millimeters thick, separated by fascia layers of thin collagenous sheets ±5 μm thick. 20
We propose that the fluid opens up channels between the adipose cells following a path of least resistance. The pressure required to inject the fluid will be indicative of this flow resistance. The fluid mechanics of flow along a pipe or channel indicates that the flow resistance will be a function of fluid viscosity and the geometry of the channel (height, width, and length). In addition, the porosity of the ground substance should also be a determining factor. 21 The geometry of the channel will depend on the tearing and stretching of the collagen matrix, which are determined by the collagen's toughness and stiffness, respectively. Thus, if the collagen matrix has a very low tear strength but high stiffness, one could expect a fine network of small channels, whereas if the matrix has a high tear strength and low stiffness, one would expect a few, large channels. In the extreme case of very high toughness and low stiffness, a very small tear or cavity would expand to form the assumed spherical shape from previous studies.
Consequently, after an initial bolus infusion, subsequent basal infusions of insulin should induce flow of insulin along these preformed channels arising from the tearing of the collagen matrix. This might have an impact on insulin absorption properties. Upon changing of infusion site, a new set of pathways are opened with their own specific depot shape and subsequent absorption characteristics. Thus one administration site can be assumed to have specific insulin absorption characteristics, as long as there are no physiological or physical changes. For example, local blood flow could change due to an inflammation, 22 or the tissue might be massaged during or after the insulin application.
Further studies are warranted to better determine the importance of these factors, for example, changes in the injection pressure and distribution for repeated injections at a site could be investigated, as well as the importance of fluid viscosity and tissue mechanical properties.
To better understand fluid distribution, color intensity could be measured to determine the infused fluid concentration per voxel. It was not possible to do this reliably with the imaging technique selected for this study; however, a fluorescent dye and appropriate camera may enable this approach.
Conclusions
In summary, a wide variation in the size and geometry of insulin depots was observed, but never the previously suggested spherical insulin depot form. Formation of flow channels appears to follow a subcutaneous tissue layer until the fluidic resistance for further lateral spreading becomes greater than the fluidic resistance associated with moving to a new layer. Driving pressures for the insulin distribution are associated with hydraulic flow rather than cavity expansion or diffusion, at least in the short time window observed.
The method used in this study might be of help to assess proposals for improving the absorption rates of insulin applied, such as by adding hyaluronidase 23 or by reducing depot variability, e.g., using sprinkler needles 24 or increasing local blood flow by using warming infusion sets. 25
Footnotes
Abbreviations:
This work was funded by Roche Diabetes Care AG, Burgdorf, Switzerland.
The authors, as well as those mentioned in the acknowledgements, are or were employees of Roche Diabetes Care AG, Burgdorf, Switzerland, except for Lutz Heinemann, from Journal of Diabetes Science and Technology, who was involved in the final phase.
Acknowledgements:
The authors thank Christa Flückiger, Dorothea Weichel, Regina Wüthrich, Raphaela Liechti, and David Teutsch for the help in designing and conducting the study. Special thanks to Lutz Heinemann for his assistance in preparing this article. We also thank Christoph Huwiler and Gilbert Schiltges for many things; especially for giving us the opportunity and continued support for this project.